

Weekly Market Recap (Apr 29-May 3): Pullback Over? Not So Fast
Weekly Market Recap (Apr 29-May 3): Pullback Over? Not So Fast
Everything you need to know about last week's markets performance and what to expect next.
Dear subscribers,
Welcome to My Weekly Stock, where we blend in-depth market analysis with proven momentum-based trading strategies. My mission? Help you navigate the financial markets with unbiased, data-driven insights you can act on!
Every week, I spend hours curating this market recap, producing insightful analyses with clear visuals and a structured layout so you can easily find what you need, week after week. And because it's easy to get swayed by personal bias, I like to let the data do most of the talking.
Let’s get started!
SUMMARY
Here are this week's highlights and what to look out for next:
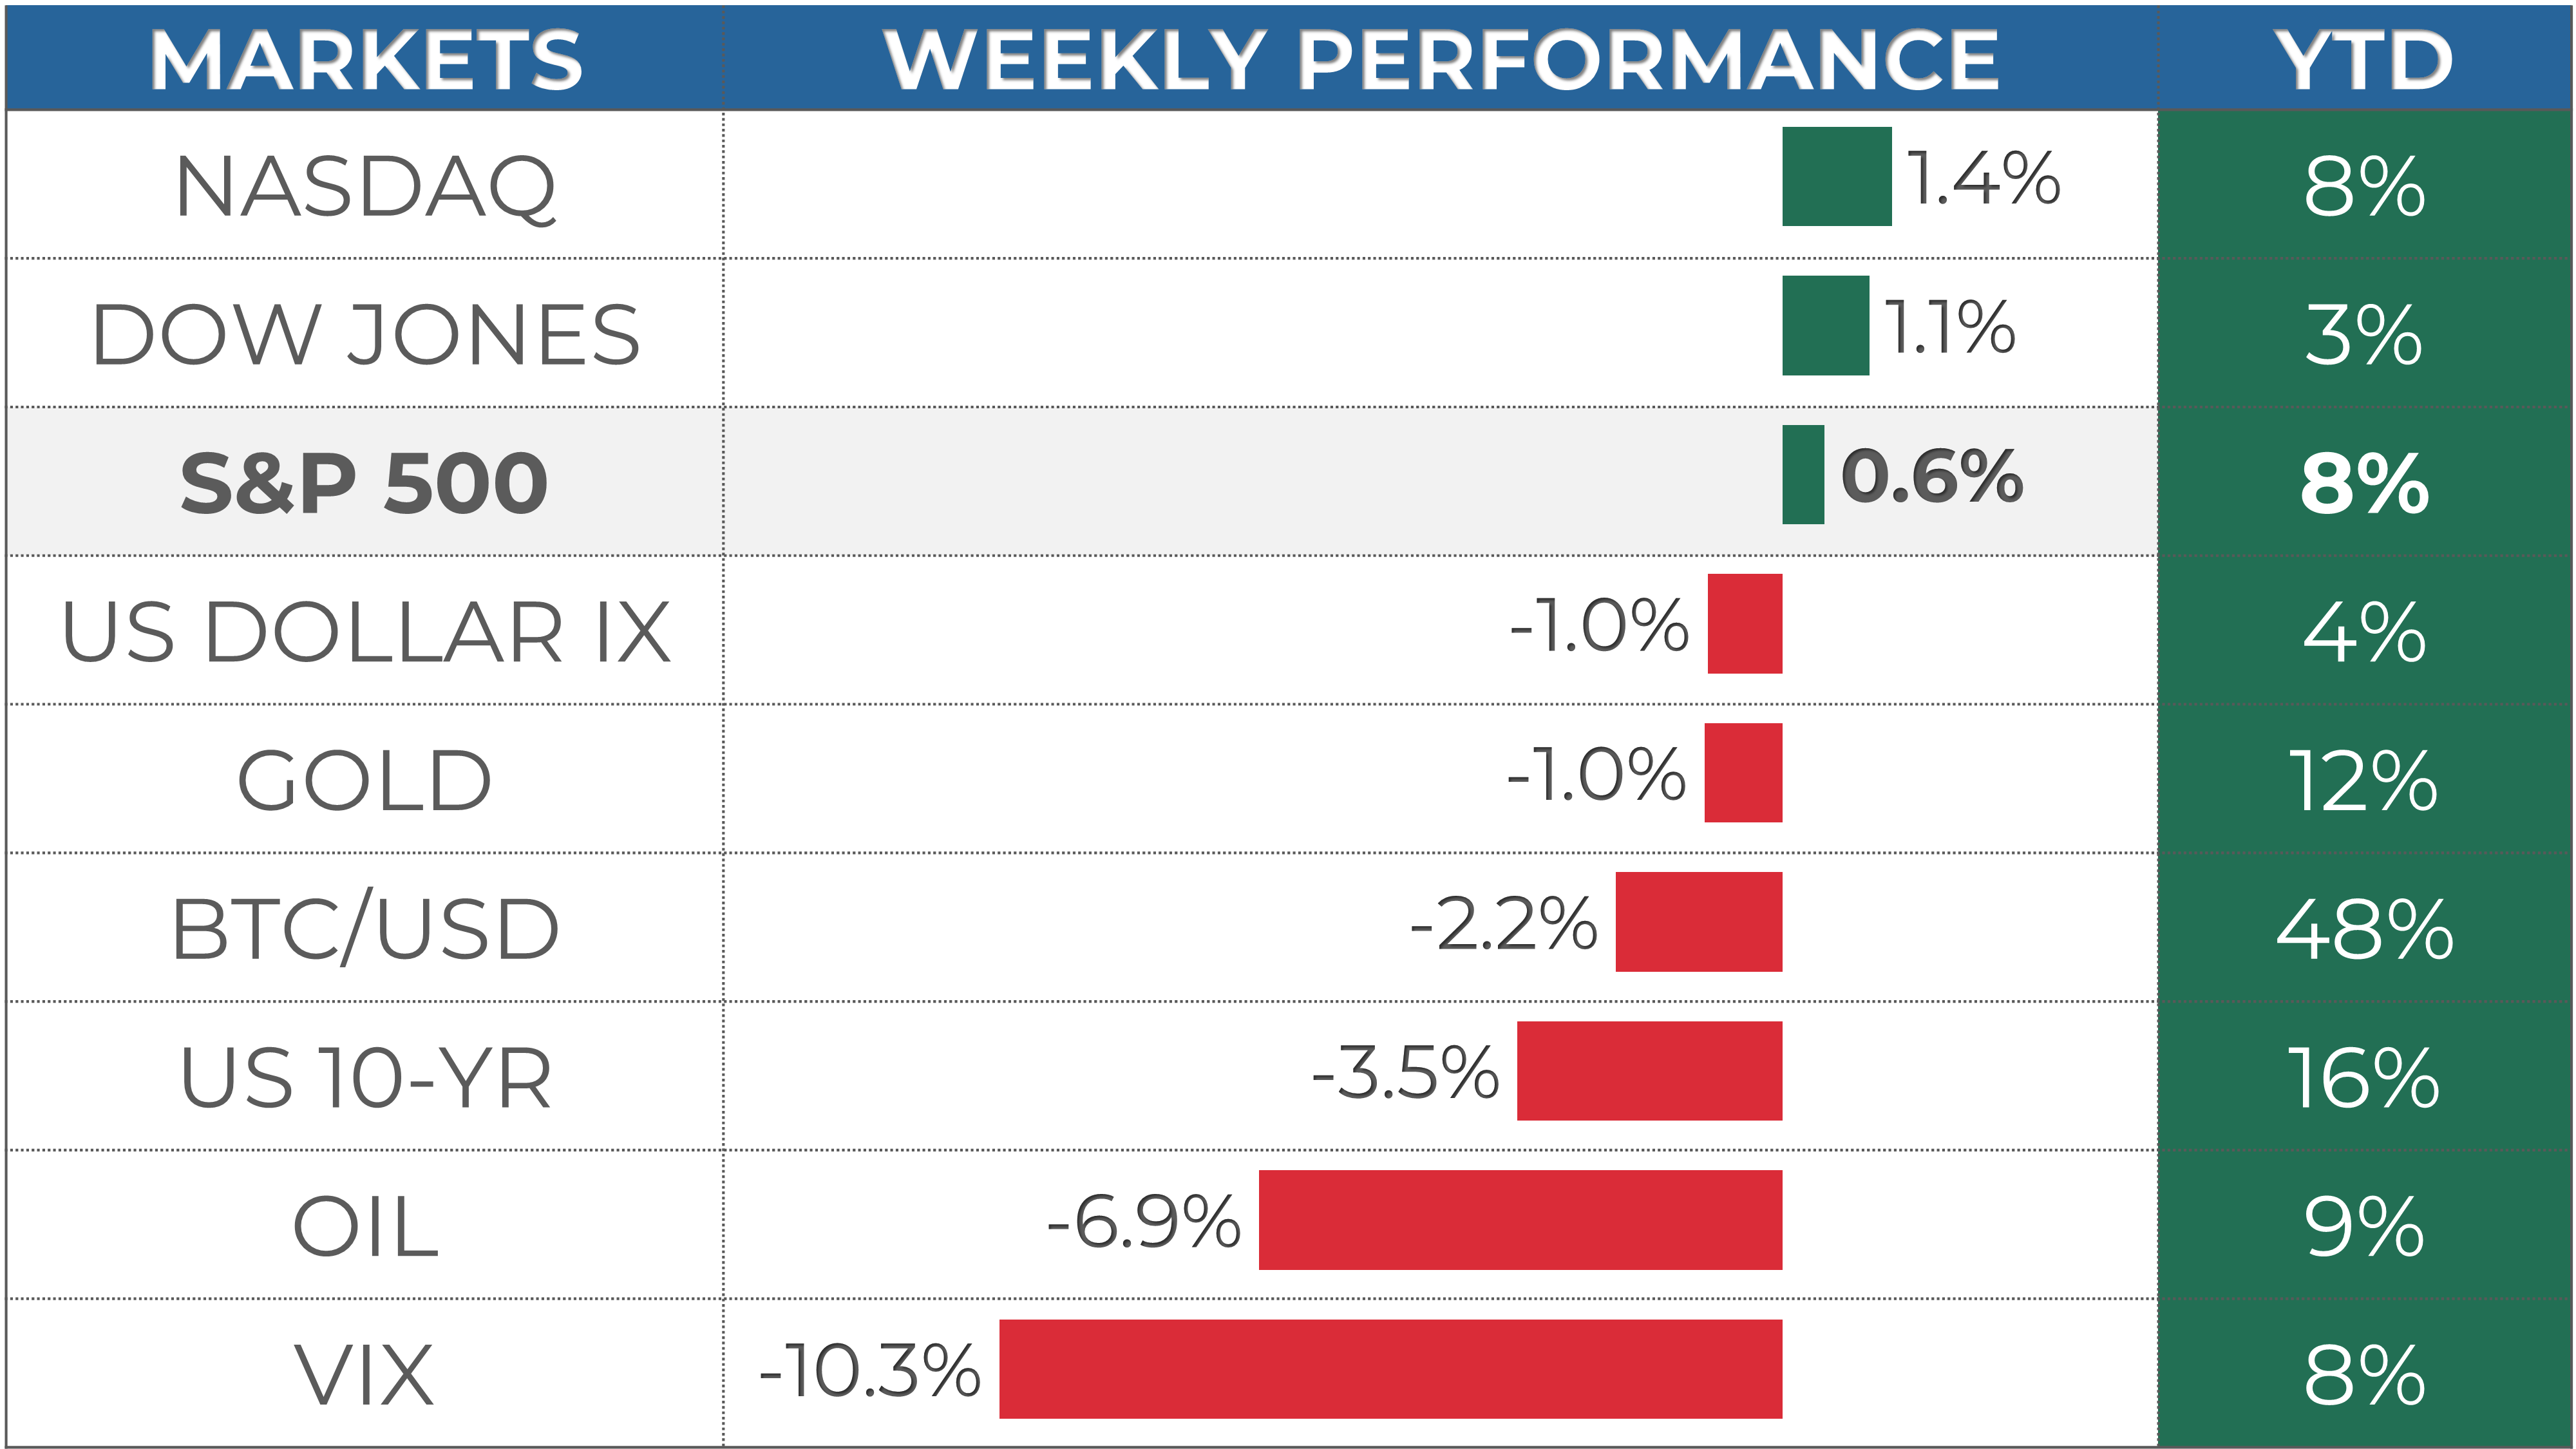
1. The markets were up for the week, with the S&P 500 up 0.6%, the Nasdaq 1.4%, and the Dow Jones 1.1%. Utilities (+3.4%) and Real Estate (+1.6%) were the best-performing sectors.
2. The S&P 500's long-term trend is positive. 5,150 is the next resistance, while 4,940 is support.
3. The earnings season is well under way, and 397 companies from the S&P 500 index have released their Q1 results, with 77% beating estimates. Earnings are expected to be up 7% in Q1 2024 and 10% in 2024.
4. Market sentiment is at the "Fear" level (40) as measured by the Fear & Greed indicator, while VIX is at a low value of 13.
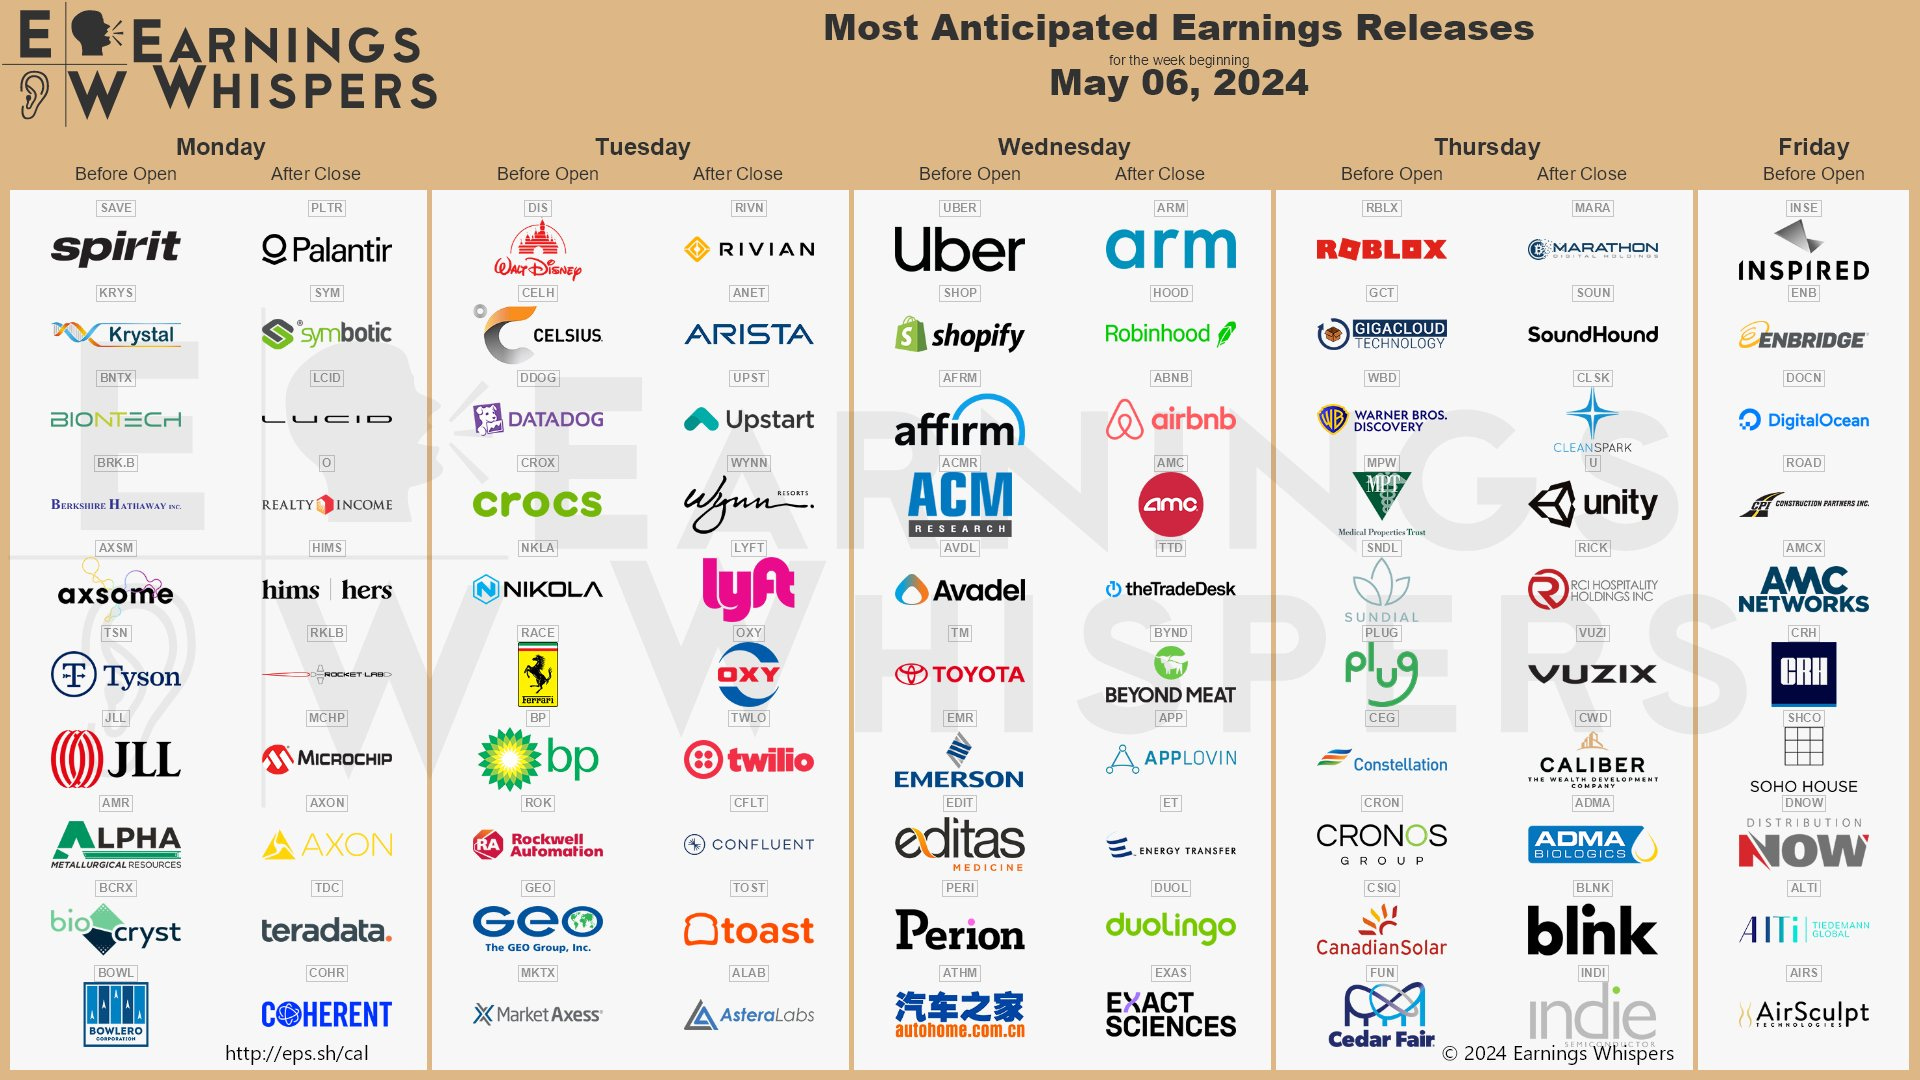
5. Earnings reports from Disney and Uber are scheduled for next week.
My take:
Despite some weakness early on, we secured a second consecutive green week. The S&P 500 stayed above the 5,000 level throughout the week and firmly reclaimed its 21-day exponential moving average - a key trend line we lost in early April, signaling the start of the sell-off.
So, is the pullback over? I still see encouraging signs, and this week's performance was reassuring. The next step is to clear resistance levels, starting with 5,150. However, the ultimate test would be to return to previous highs and break above. Until we achieve this, we are always at risk of a reversal and revisiting lower levels
PERFORMANCE RECAP
1. S&P 500 Sector Performance
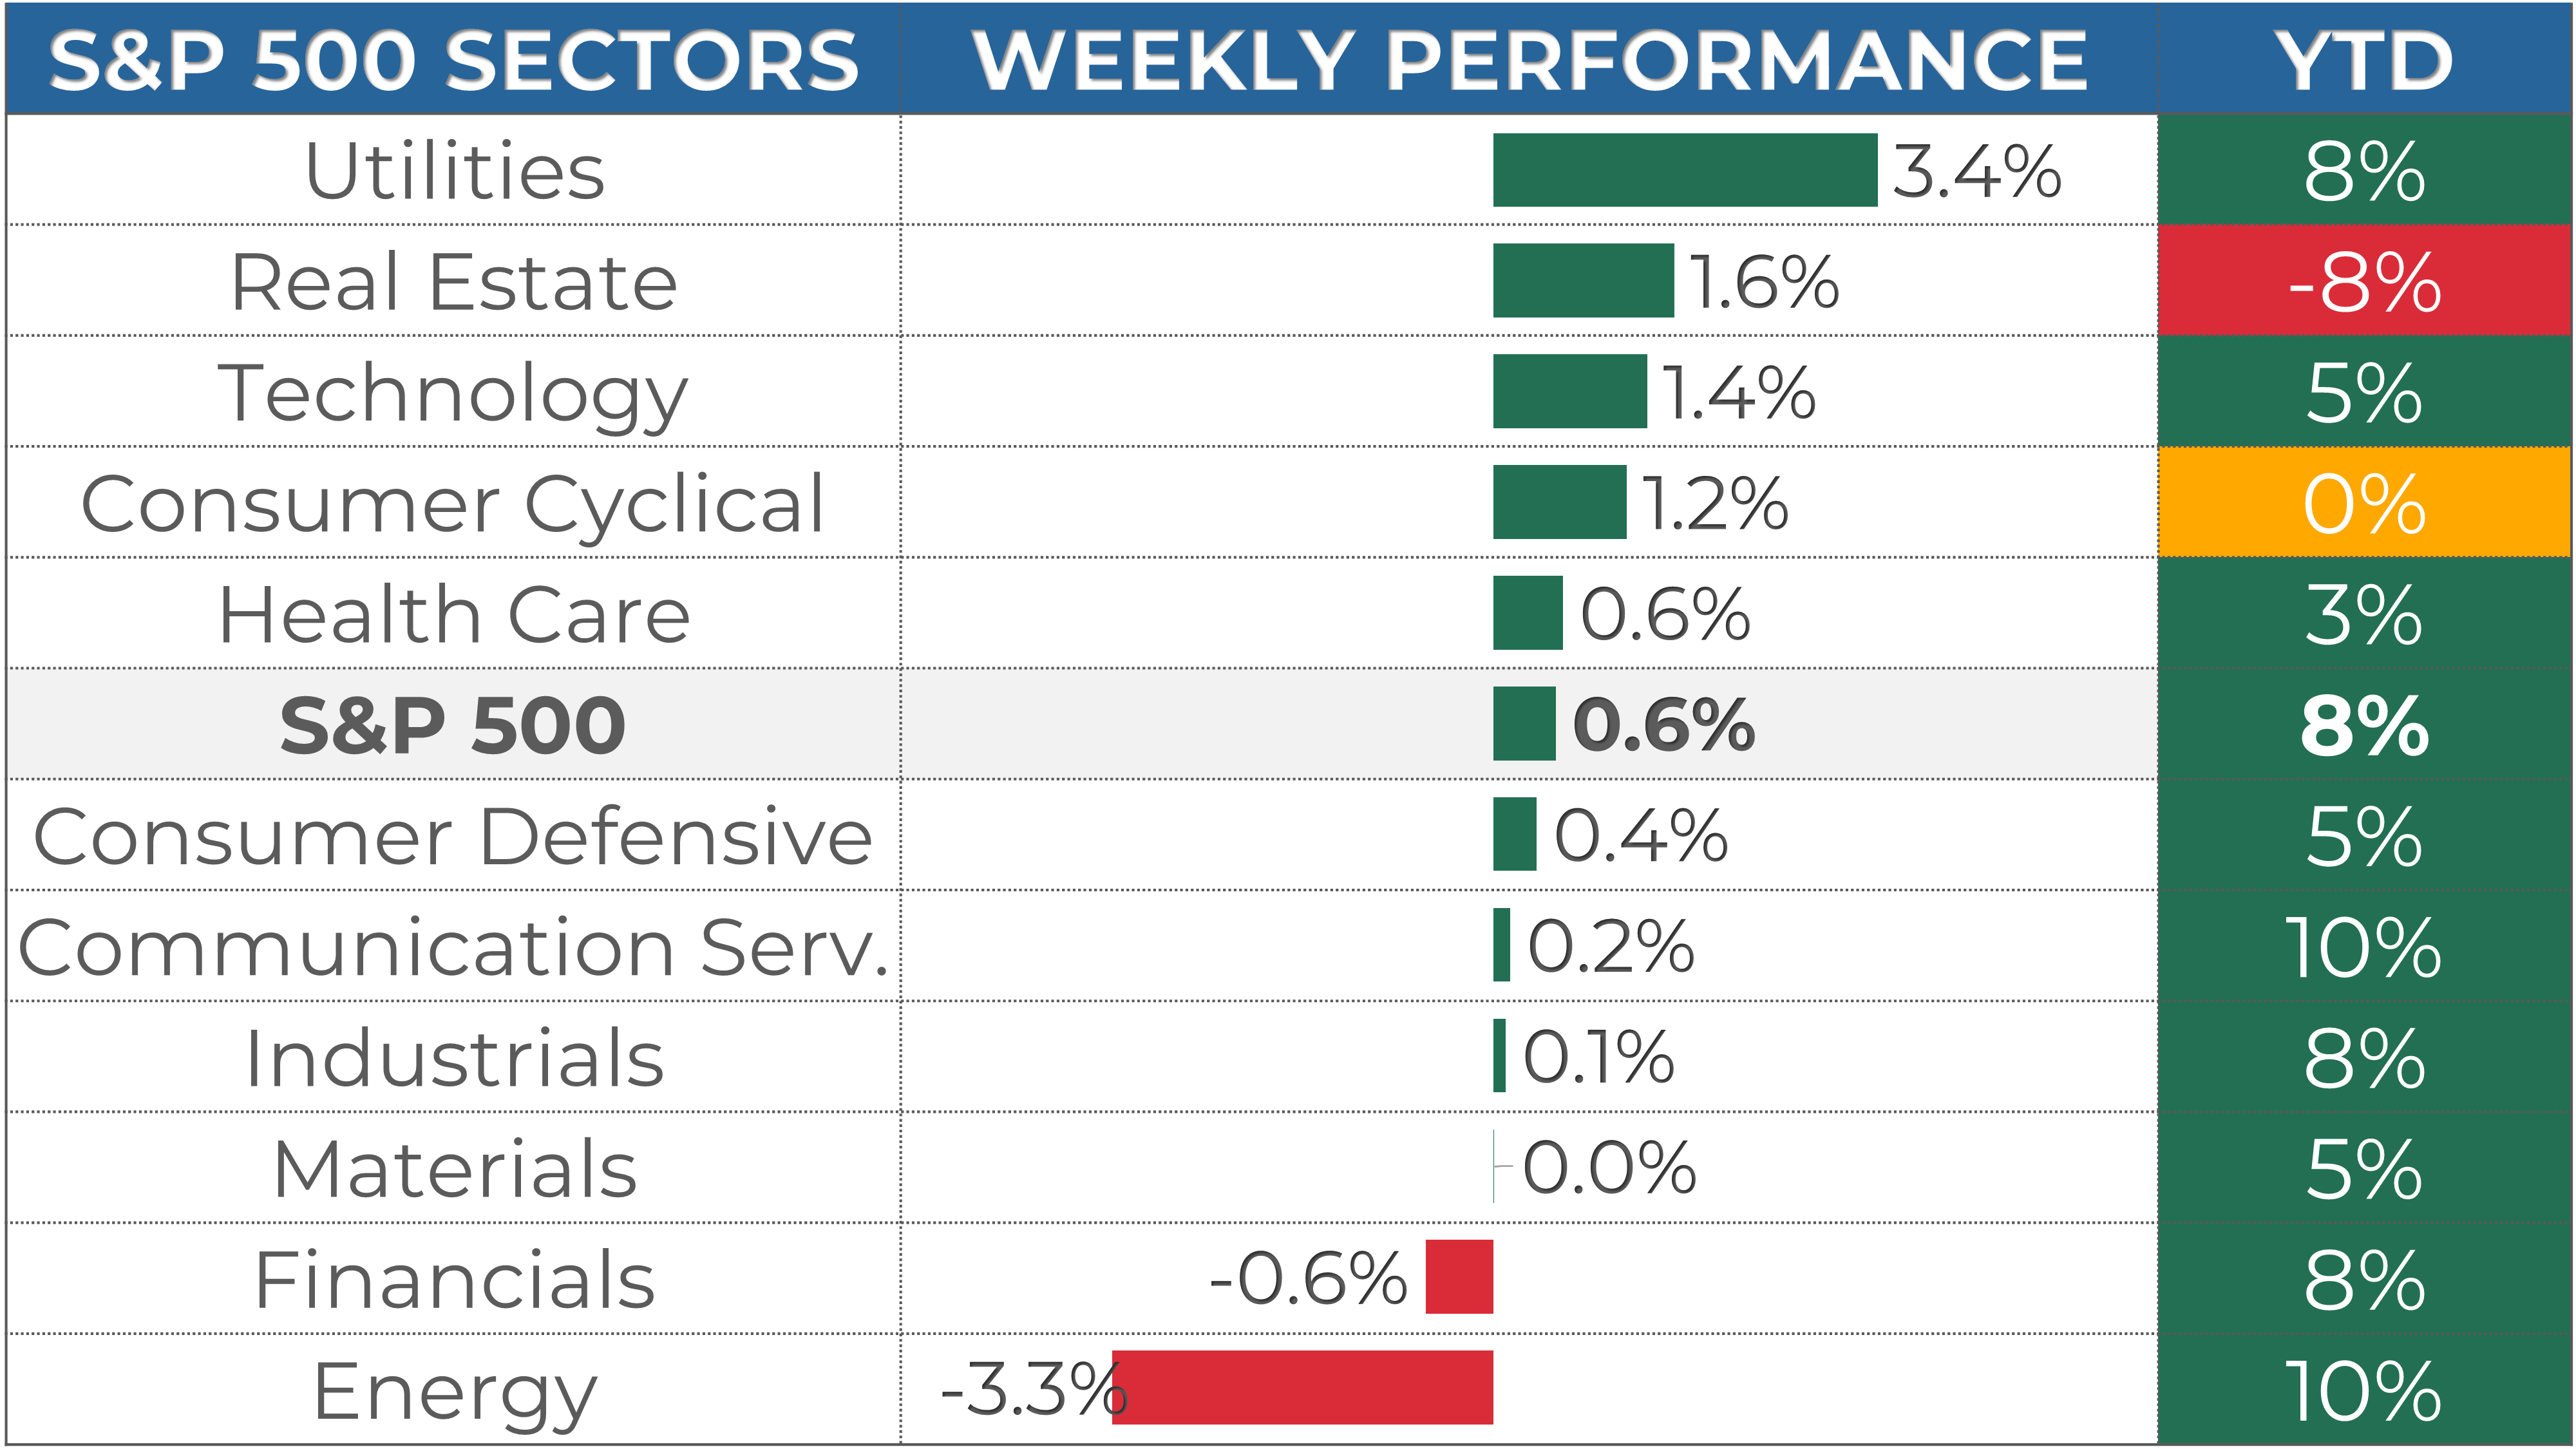
Over the week, 9 of the 11 S&P 500 sectors have achieved gains. Utilities led the way, rising by 3.4%. By contrast, Energy was the weakest, falling by -3.3%.
Year-to-date, 9 of the sectors have seen positive results. Communication Services has been the most successful sector, with a 10% gain. On the other hand, Real Estate has been trailing behind.
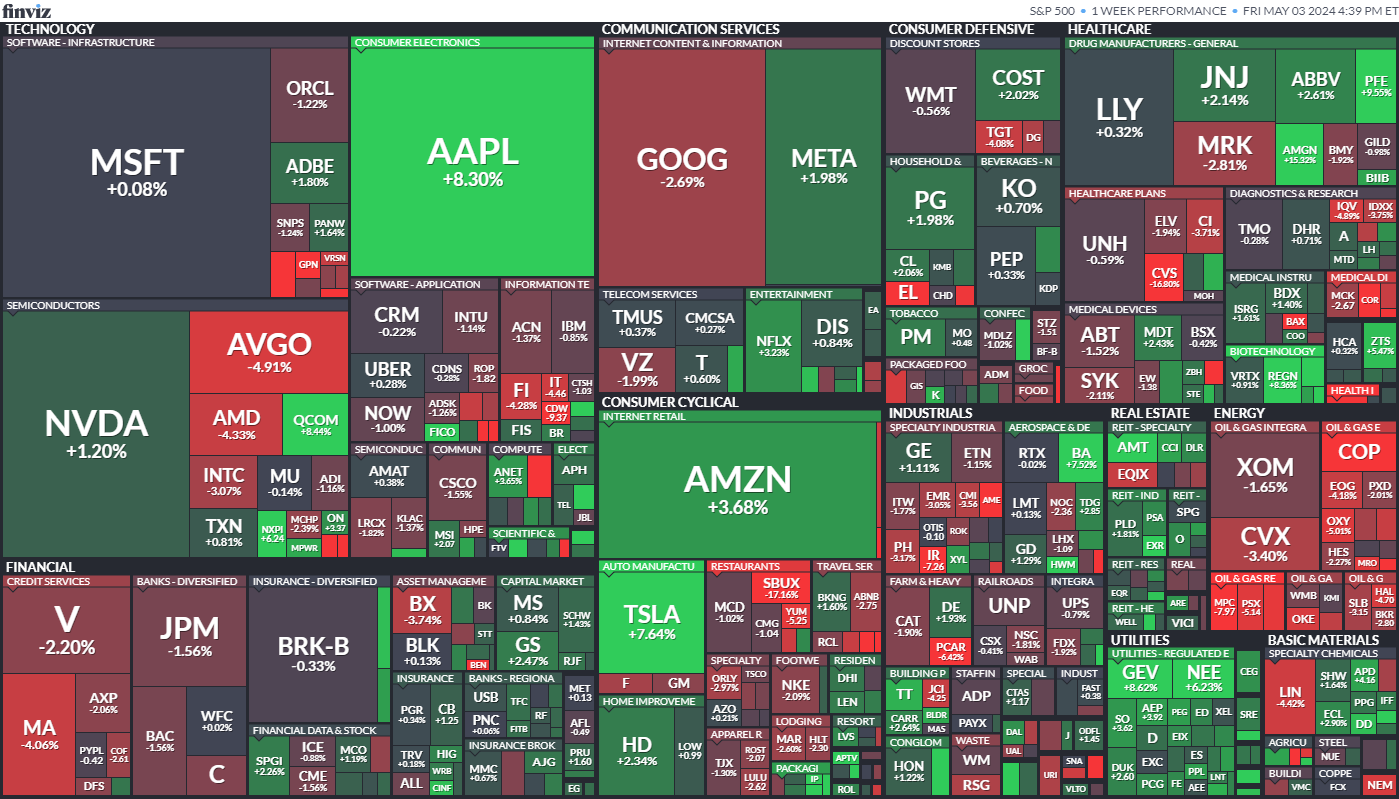
2. S&P 500 Top & Worst Performers
Last week, 54% of the stocks in the S&P 500 index rose in value.
The best-performing stocks were:
Bio-Techne Corp (TECH, 21%)
Howmet Aerospace Inc (HWM, 19%)
Moderna Inc (MRNA, 16%)
Meanwhile, the worst-performing stocks were:
CVS Health Corp (CVS, -17%)
Starbucks Corp. (SBUX, -17%)
Qorvo Inc (QRVO, -18%)
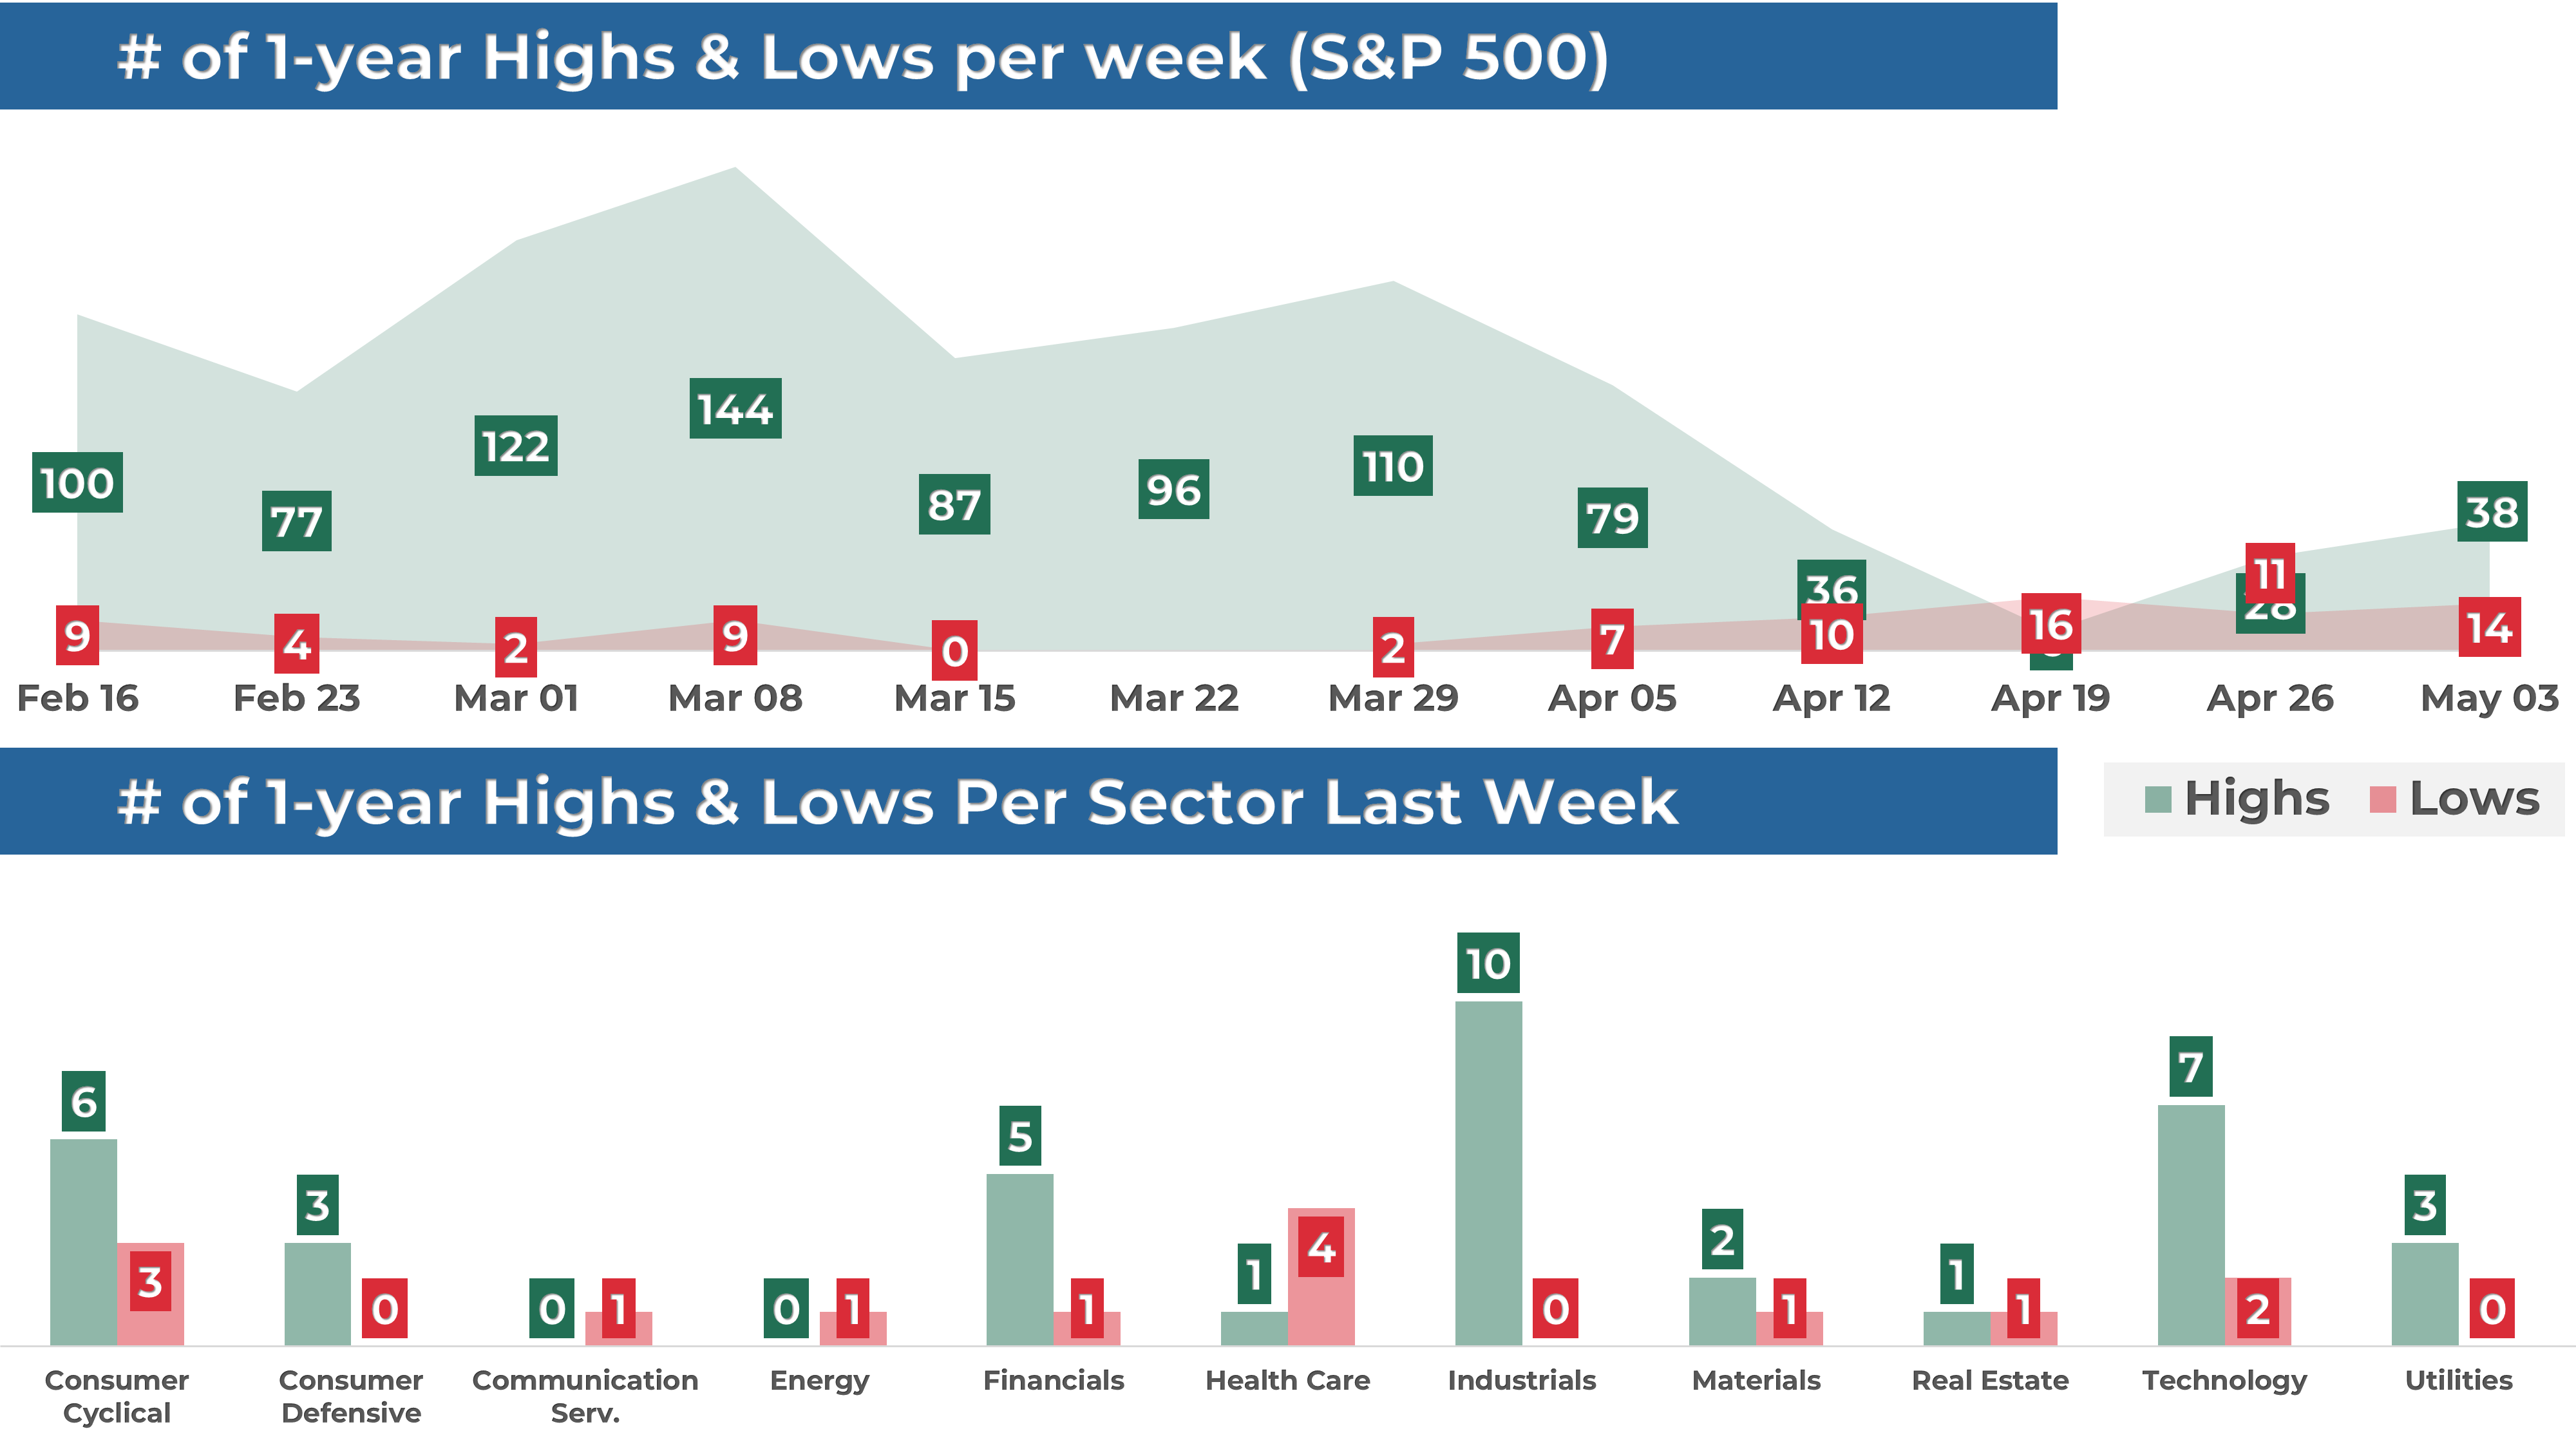
In addition, 38 stocks within the S&P 500 reached a new 52-week high, while 14 set new lows, indicating that momentum has back to the upside. Most of the highs this week came from the Industrial sector, while Healthcare has seen the most lows.
MARKET TRENDS & MOMENTUM
1. S&P 500 Long-Term Trend
The long-term trend for the S&P 500 is positive. I base this evaluation on the weekly chart's 9 and 30 exponential moving averages (EMAs). To determine if the trend is strongly positive, I look for the following conditions (the 1st is the most important):
EMA9 is above the EMA30: 🟢
Price is trading above the EMA9: 🟡
Price is trading above the EMA30: 🟢
EMA9 is rising: 🟡
EMA30 is rising: 🟢
I also use the MACD as an additional tool to detect trend changes. The MACD has crossed below its signal line, a negative signal for the index.

2. S&P 500 Technical Analysis
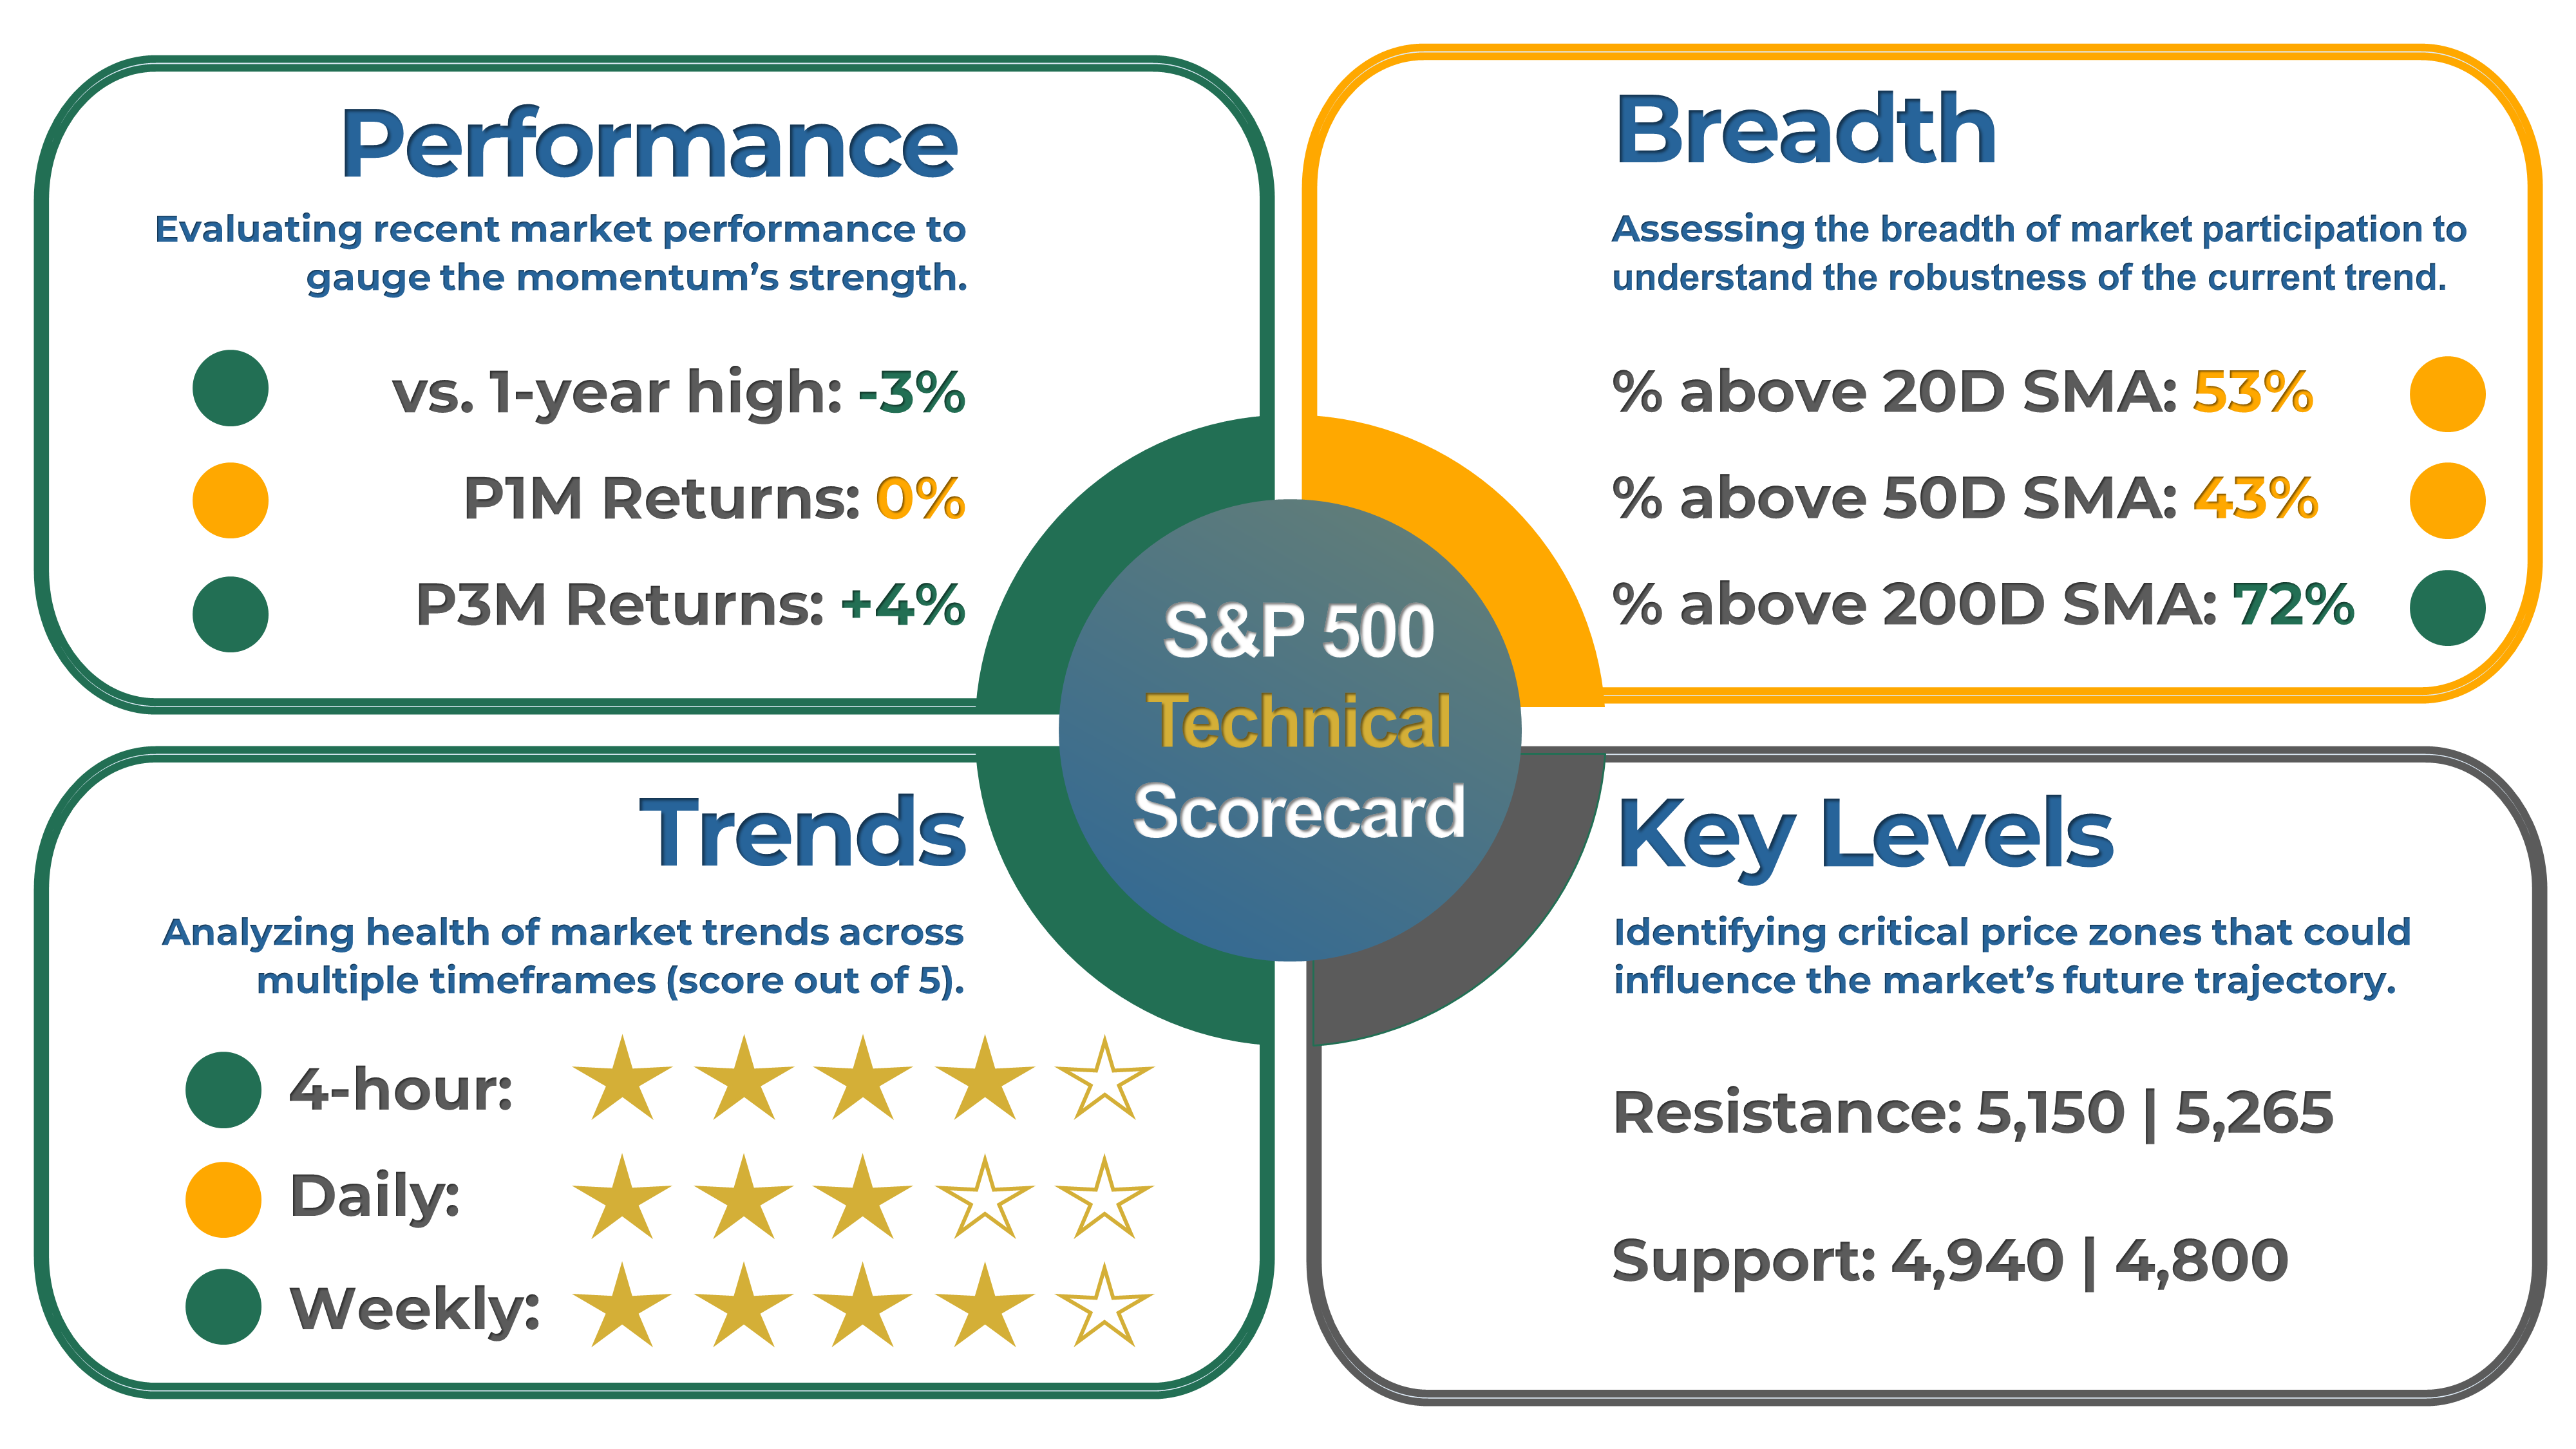
Healthy bull markets typically see the index set several new highs, broad market participation, and ascending trend lines. That's why I've created a four-part scorecard – a straightforward tool to give us a comprehensive view of these essential health indicators.
Momentum: The index is flat over the past month, up 4% in the last three months, and is trading 3% away from its 52-week high.
Breadth: Market participation remains healthy in the long term, as 72% of S&P 500 stocks are trading above their 200-day moving average (SMA). Meanwhile, 53% of stocks are trading above their 20-day SMA, increasing by 13 points compared to the previous week.
Trends: The 1-day and 4-hour charts are turning bullish again, but I would like to see further confirmation next week.
Key levels: The next resistance level is 5,150, followed by 5,265. On the other hand, the next support area is 4,940, followed by 4,800.
3. Momentum Analysis of the Week
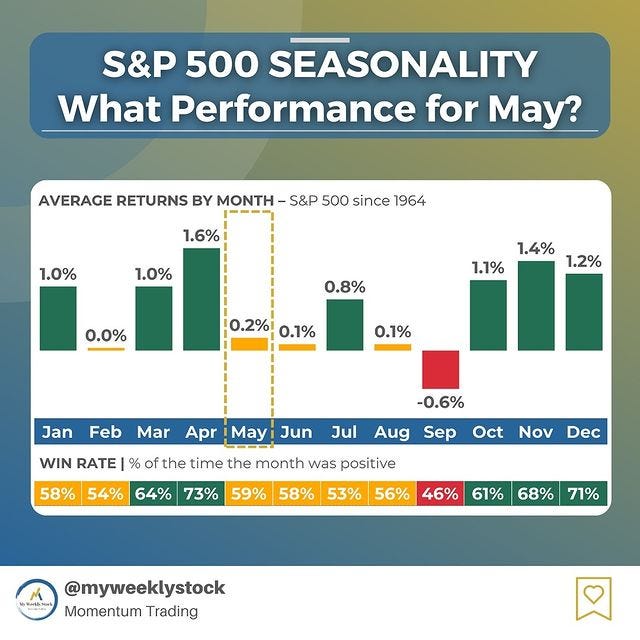
This week's momentum analysis is about seasonality, as we just started the month of May. Since 1964, the S&P 500 has been up 59% of the time in May, averaging a 0.2% return.
EARNINGS RECAP
1. Q1 and Full Year 2024 Expected EPS & Revenue Growth
Q1 2024 earnings for the S&P 500 are expected to be up 7%. Excluding the energy sector, the figure is +10%.
Earnings are projected to grow by 10% in 2024, slightly higher than the 9% growth seen on average over the last decade. In the past four weeks, 57% of earnings revisions made by analysts were to increase their outlook.
The forward 4-quarter P/E ratio is 20.0, higher than the average over the past five and ten years.

2. Q1 Earnings Season Summary
397 companies from the S&P 500 index have released their Q1 2024 earnings, with 77% posting higher EPS than expectations. This is roughly in line with the previous four-quarter average of 78% and higher than the historical average of 67%.
MARKET SENTIMENT
Measures of investor sentiment can be helpful as they provide insight into the views and opinions of professional or individual investors. However, it's important to note that these measures are not perfect predictors of market movements. They should be combined with other indicators and analysis tools for a complete market picture.
1. AAII Sentiment Survey (Individual Investors)
The American Association of Individual Investors (AAII) conducts a weekly survey among its members to gauge their expectations for the stock market over the next six months. The results are published every Wednesday.
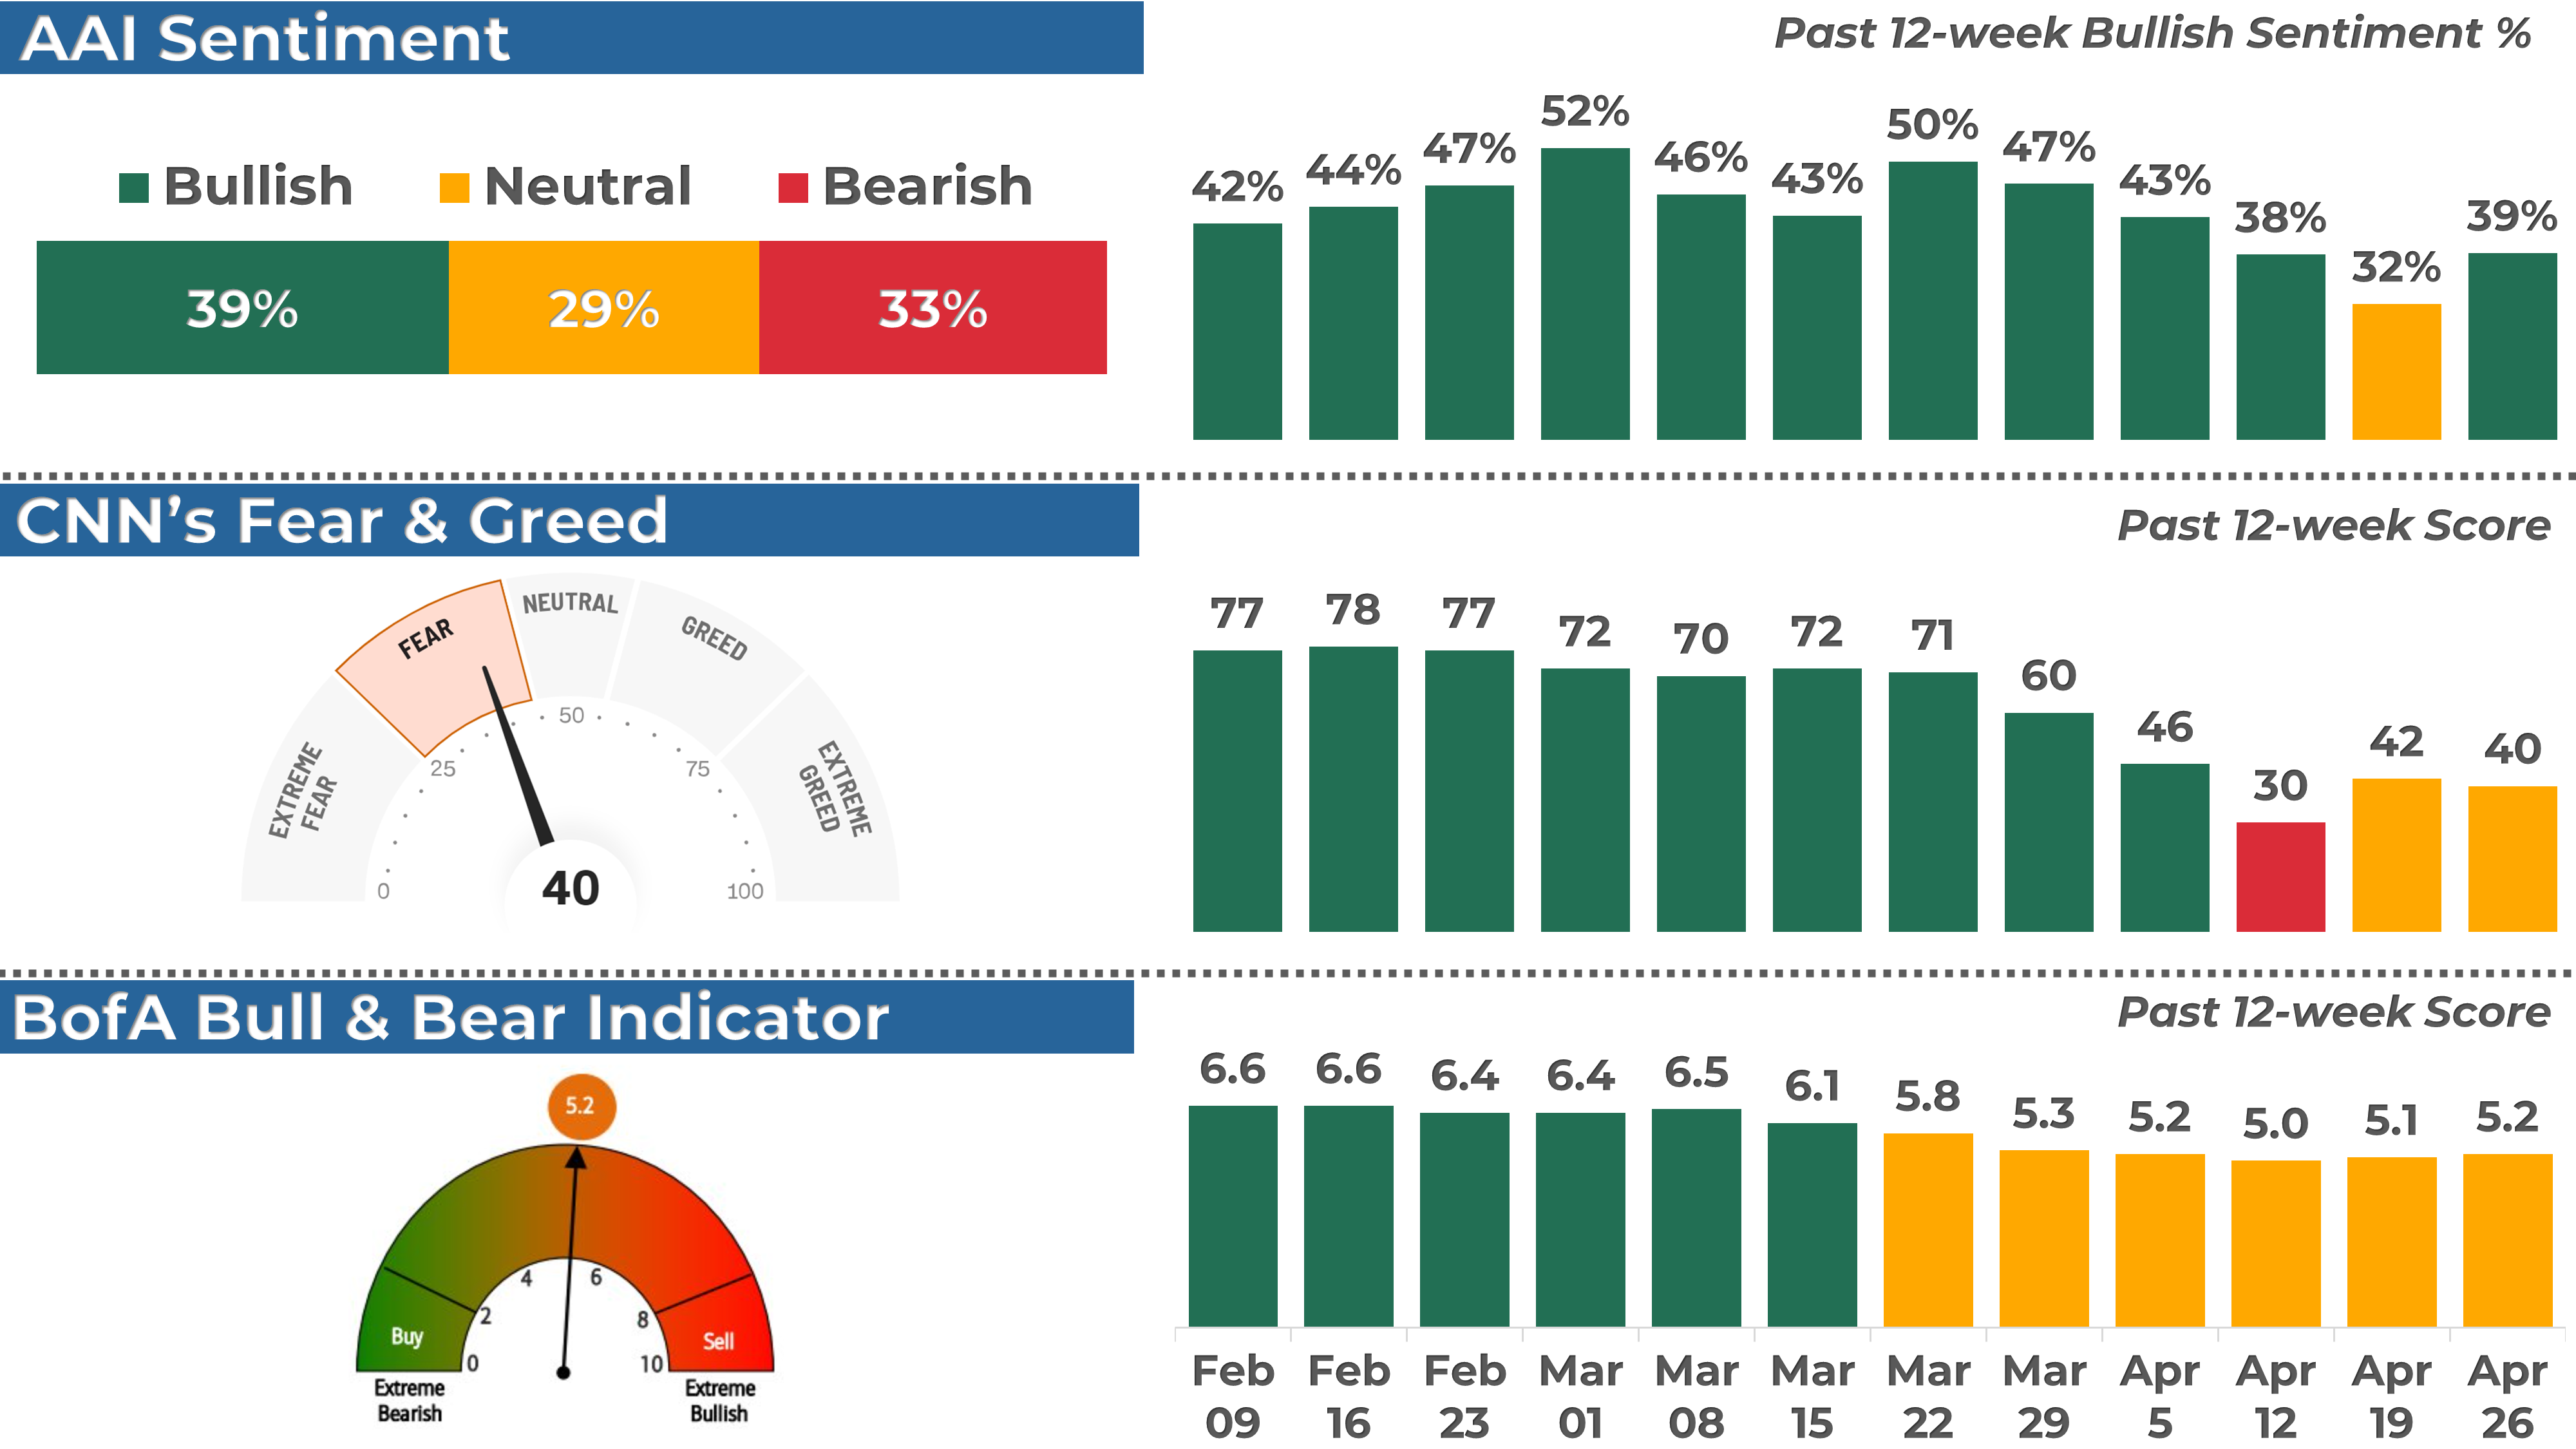
According to the most recent AAII survey, 39% of the respondents had a bullish outlook on the stock market, up 7 points from the previous week.
2. BofA Bull & Bear Indicator (Institutional Investors)
The Bank of America Bull-Bear Indicator is a proprietary measure of investor sentiment developed by Bank of America. It is based on a survey of fund managers and institutional investors, and it tracks the percentage of respondents who are bullish, bearish, or neutral on the stock market. Results are published in the form of a score ranging from 0 (extremely bearish) to 10 (extremely bullish)
The indicator rose from 5.1 to 5.2, a neutral sentiment reading.
3. CNN Fear & Greed Index (Technical)
The CNN Fear & Greed Index is a daily measure that analyzes seven market indicators to assess how emotions influence investors' decisions. The index is scored out of 100 and categorizes results into five stages: Extreme Fear, Fear, Neutral, Greed, and Extreme Greed.
The index closed at 40, or a “Fear” level, down from 42 last Friday.
THE WEEK AHEAD
1. Economic Calendar
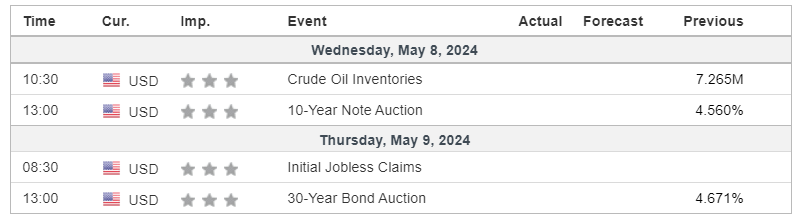
A relatively calm week is awaiting us, with no significant economic report expected.
2. Earnings Calendar
The earnings season continues next week, and 51 companies from the S&P 500, including Disney and Uber, are expected to release their quarterly results.
3. Next Week’s Earnings Watchlist
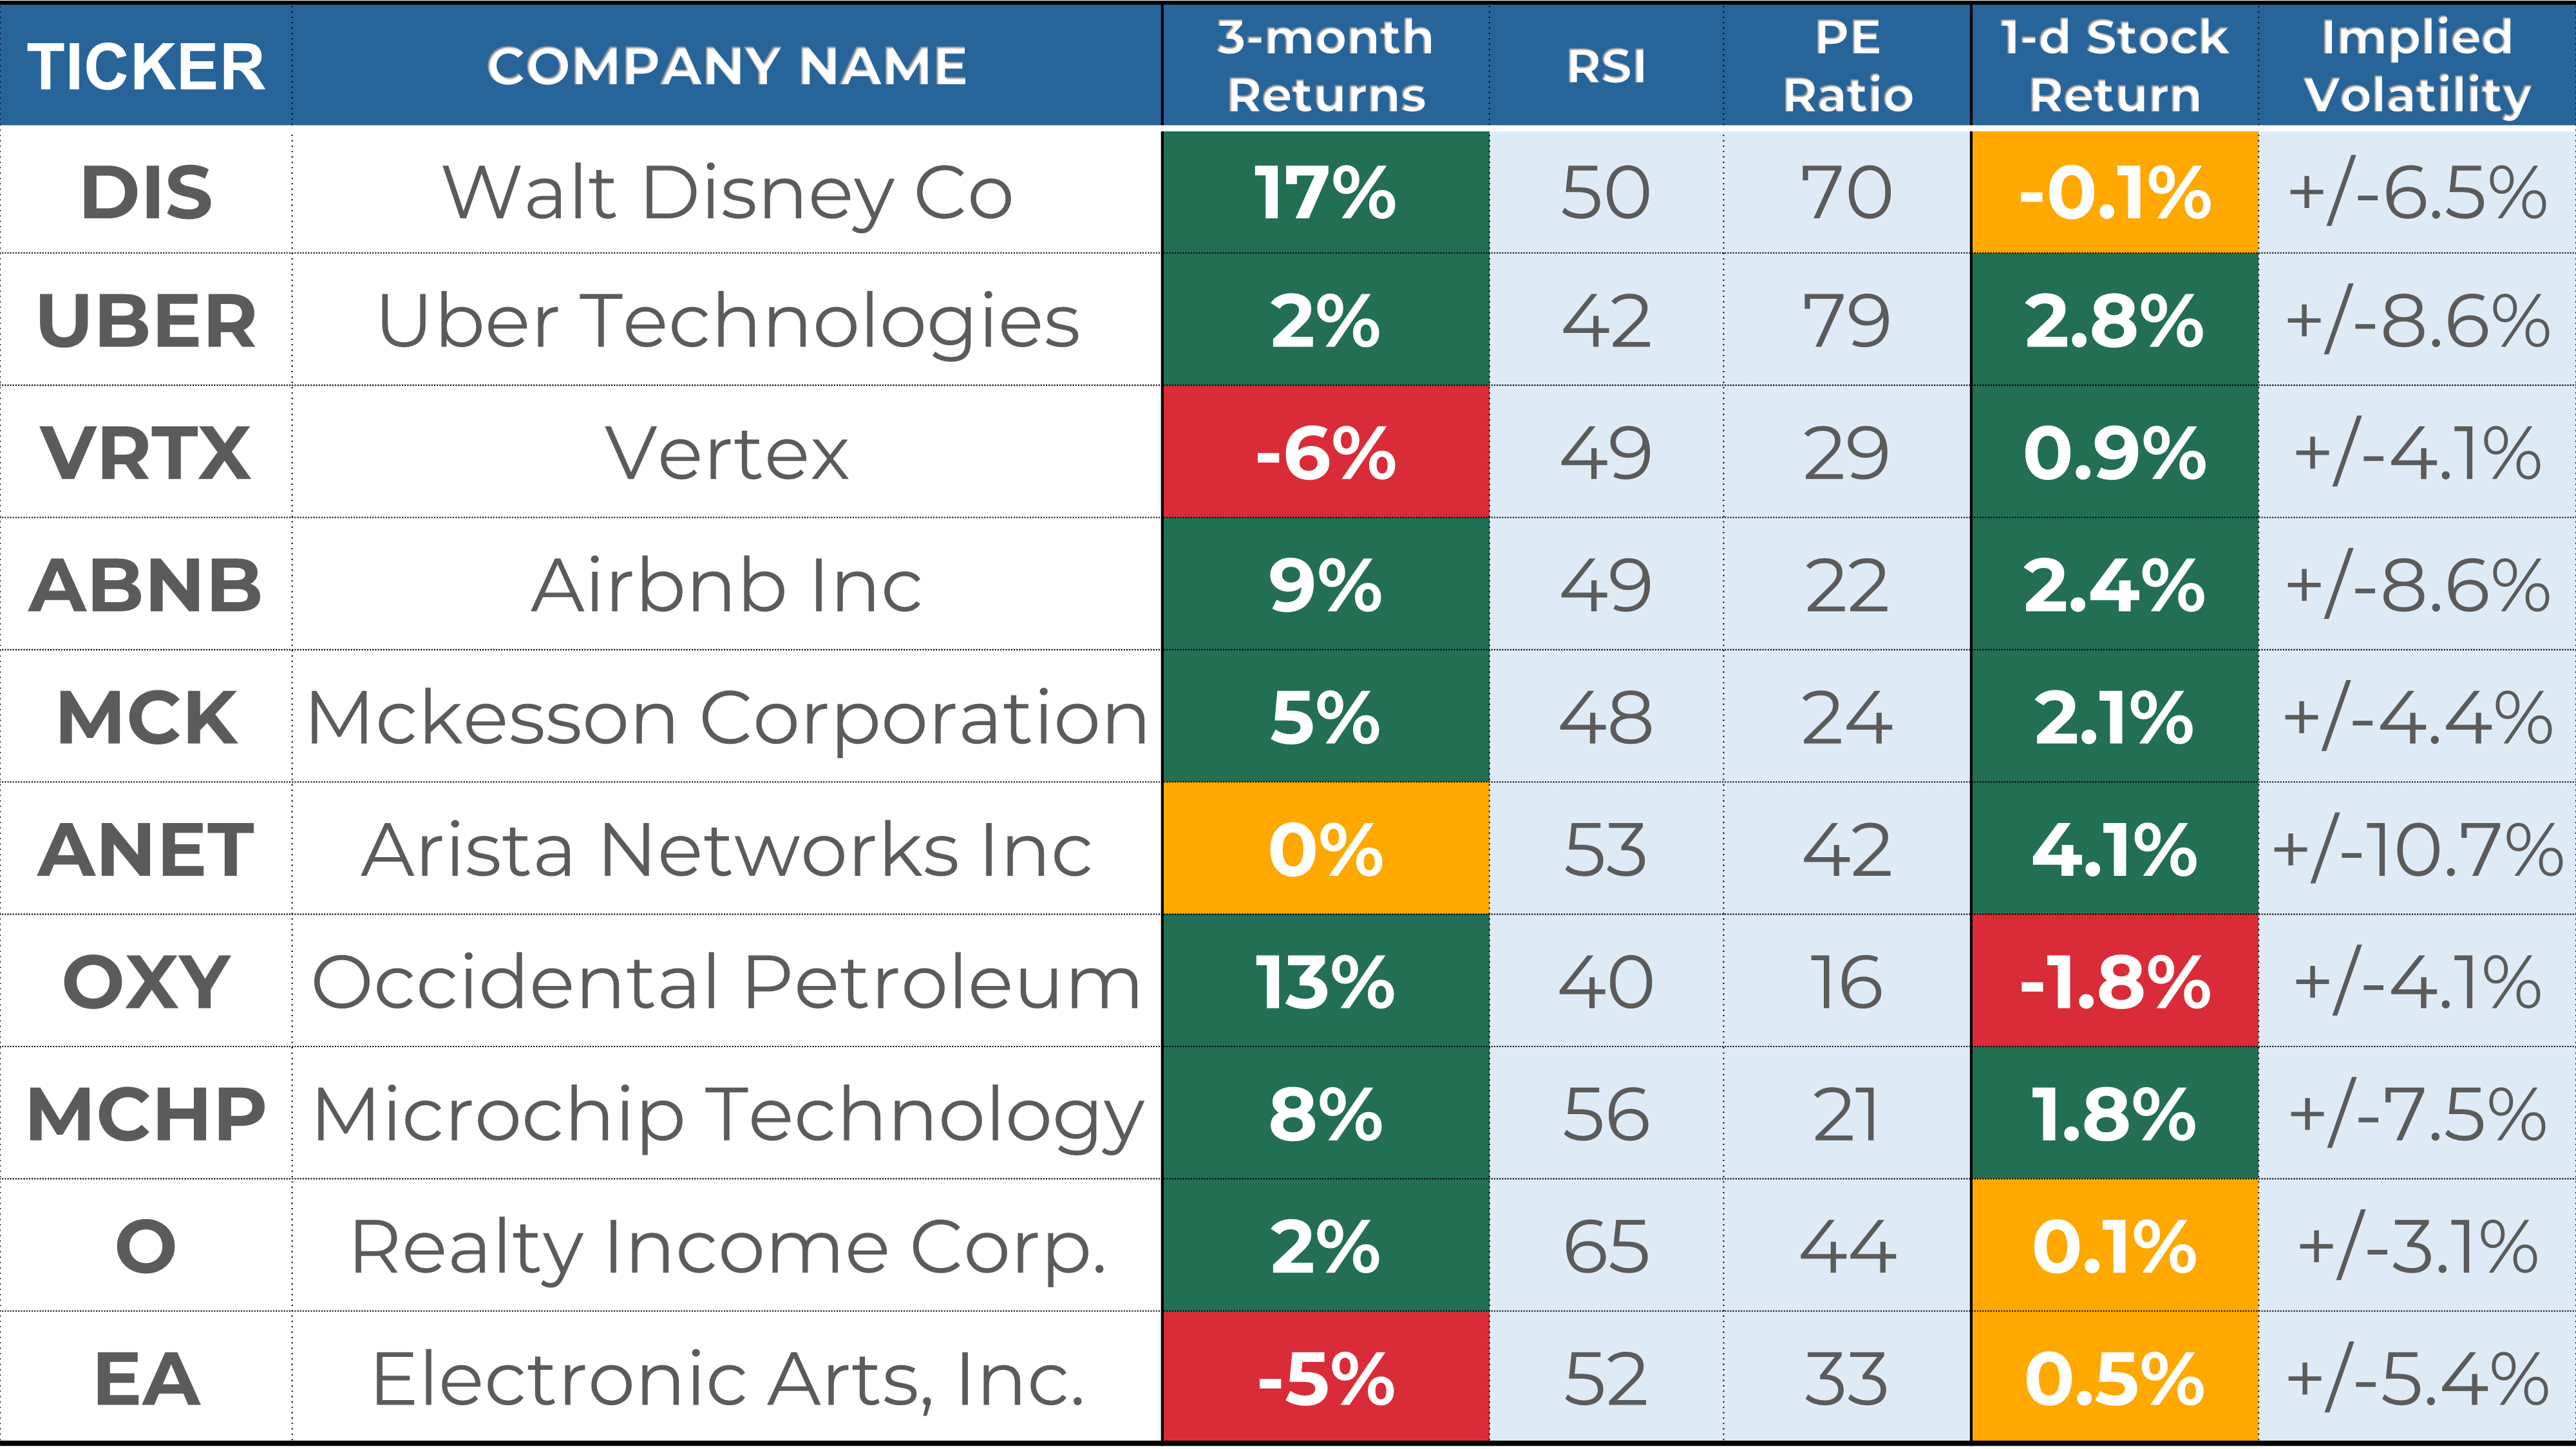
Below is my watchlist of stocks reporting week next week, along with several key indicators I like to review:
Stock Indicators:
Stock performance in the last 3 months.
RSI, where a reading of 70 indicates overbought status and a reading of 30 oversold.
PE ratio, where a reading below 25 indicates a "cheap" valuation and/or low growth expectations.
Stock Price Reactions to Earnings:
1-day Stock Return on Earnings is the stock performance on the earnings release date.
Implied volatility is the expected 1-day stock change after earnings are released, as assessed by the options markets.
Every week, I share a deep dive into 1 stock reporting earnings in the coming days. This week, I prepared an in-depth overview of Uber Technologies (UBER). In this post, I break down key data points around UBER’s fundamentals, stock returns, analyst ratings, and past earnings performance to help you make informed investment decisions.

That’s a wrap for this week’s recap! I hope it helped you understand the market better.
Did you enjoy my analysis? The premium section offers much more: I provide my short-term trading and analysis of over 20 US large caps and share my long-term investing portfolios. Upgrade your subscription to unlock all the exclusive features and insights! The first month is free!
If you have any questions or feedback, please don't hesitate to email me or comment on this post. Your support helps me create high-quality content and is greatly appreciated!
Have a great week!
My Weekly Stock
DISCLAIMER
The information provided in this newsletter is for informational purposes only and should not be taken as financial advice. Any investments or decisions made based on the information provided in this newsletter are the reader's sole responsibility. We recommend that readers conduct their own research and consult a qualified financial professional before making investment decisions. The author does not assume any responsibility for any losses or damages arising from using the information provided in this newsletter.