

Weekly Market Recap (Jul 1-5): The S&P 500 Surges to All-Time Highs. More to Come?
Weekly Market Recap (Jul 1-5): The S&P 500 Surges to All-Time Highs. More to Come?
Everything you need to know about last week's markets performance and what to expect next.
Dear subscribers,
Welcome to My Weekly Stock, where we blend in-depth market analysis with proven momentum-based trading strategies. My mission? Help you navigate the financial markets with unbiased, data-driven insights you can act on!
Every week, I spend hours curating this market recap, producing insightful analyses with clear visuals and a structured layout so you can easily find what you need, week after week. And because it's easy to get swayed by personal bias, I like to let the data do most of the talking.
To celebrate the first six months of the premium section of My Weekly Stock, you can get your annual subscription at a 30% discount. This offer is valid until the end of July, so don’t miss out!
Let’s get started!
SUMMARY
Here are this week's highlights and what to look out for next:
1. The markets were up for the week, with the S&P 500 up 2%, the Nasdaq 3.5%, and the Dow Jones 0.7%. Consumer Cyclical (+3.8%) and Technology (+2.9%) were the best-performing sectors.
2. The S&P 500's long-term trend is positive. 5,600 is the next resistance, while 5,450 is support.
3. The earnings season is starting, and 19 companies from the S&P 500 index have released their Q2 results, with 84% beating estimates. Earnings are expected to be up 10% in Q2 2024 and 11% in 2024.
4. Market sentiment is at the "Neutral" level (54) as measured by CNN’s Fear & Greed indicator, while VIX is at a low value of 12.
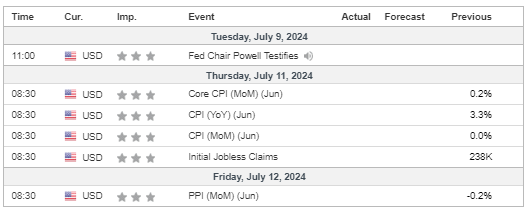
5. Earnings reports from JPMorgan and PepsiCo, the CPI and PPI reports, and testimony from the Fed Chair are scheduled for next week.
My take:
After two unsuccessful attempts, the S&P 500 finally sustained a move above 5,500. This was a more challenging barrier, but ultimately, it broke, just like previous ones. We should remain cautious since it was a holiday week with lighter trading volume, and we'll need further confirmation next week, particularly with the upcoming CPI data.
Calls for a market top and significant correction will increase in the coming weeks. A major US bank even revised its year-end outlook, predicting a potential sell-off of over 20%. Could this happen? Certainly, the market faces several challenges, from inflation pressures to a slowing economy and upcoming US elections. However, we must consider what's most likely, in particular, in terms of the sequence of events. And as long as we remain in a strong uptrend, both long and short-term, without losing any major support, the index will continue hitting new highs, as it should in a bull market. So, let's enjoy the ride while it lasts and onward to a successful second half!
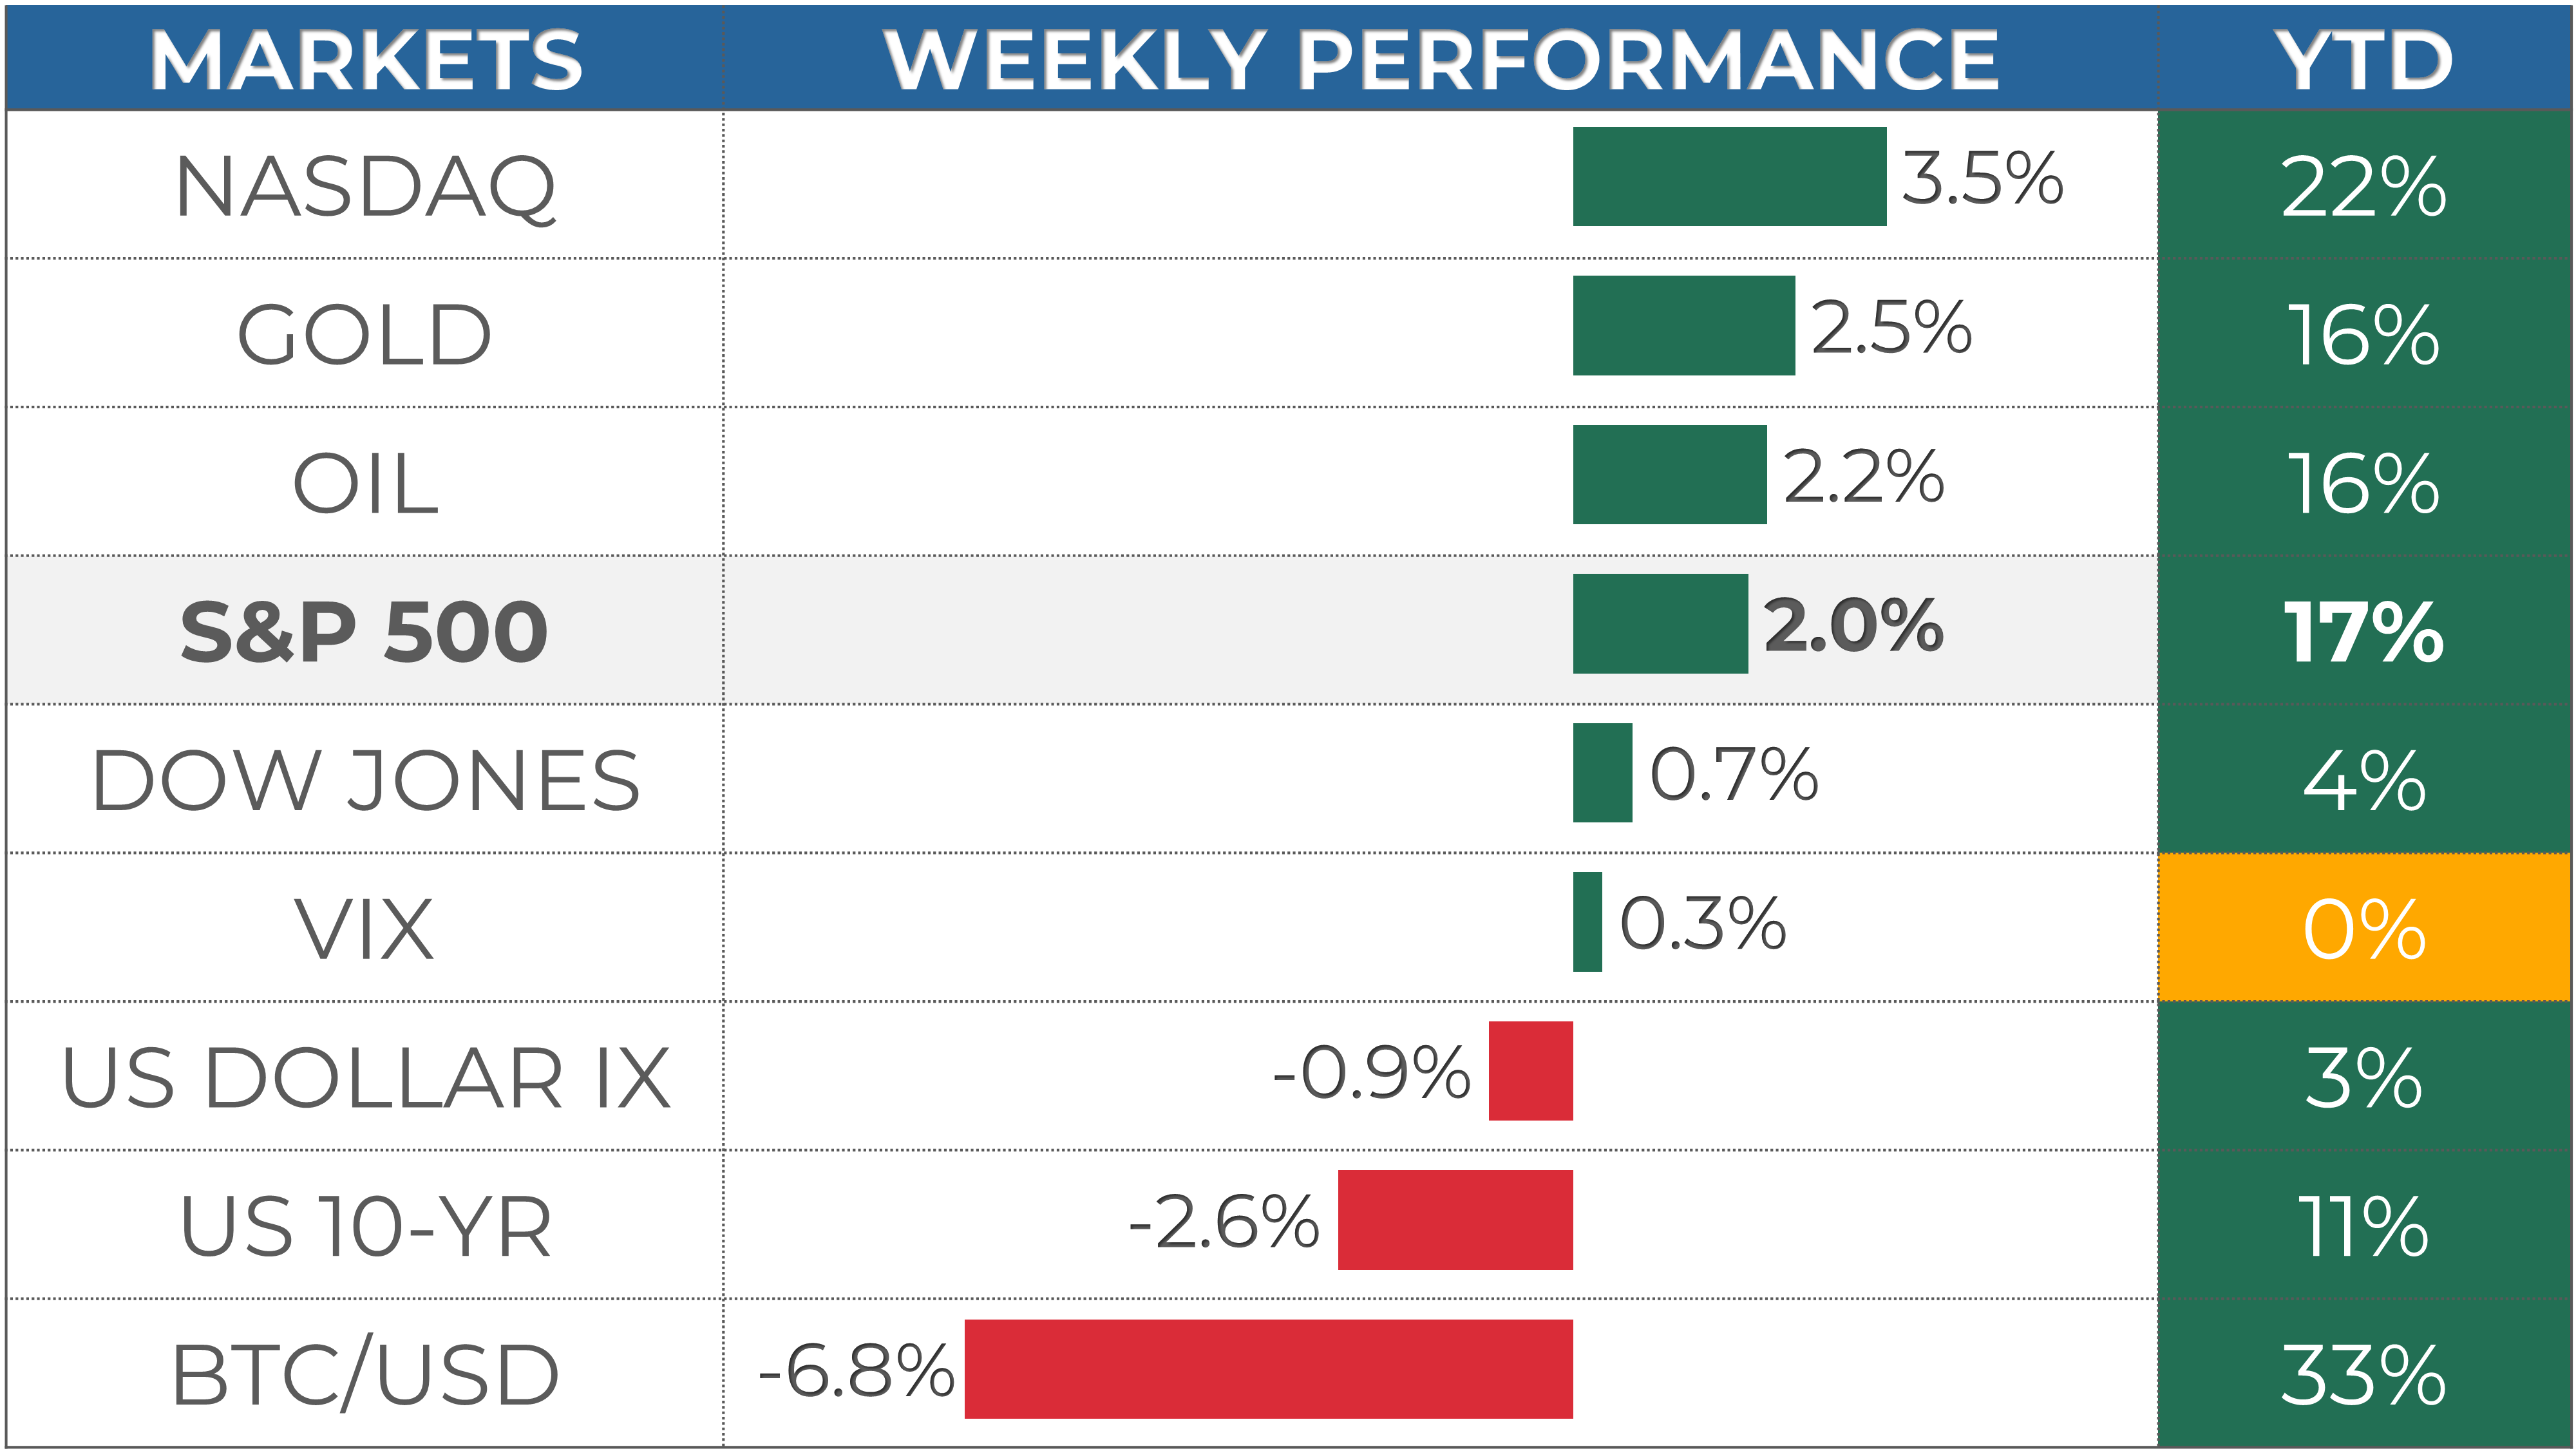
PERFORMANCE RECAP
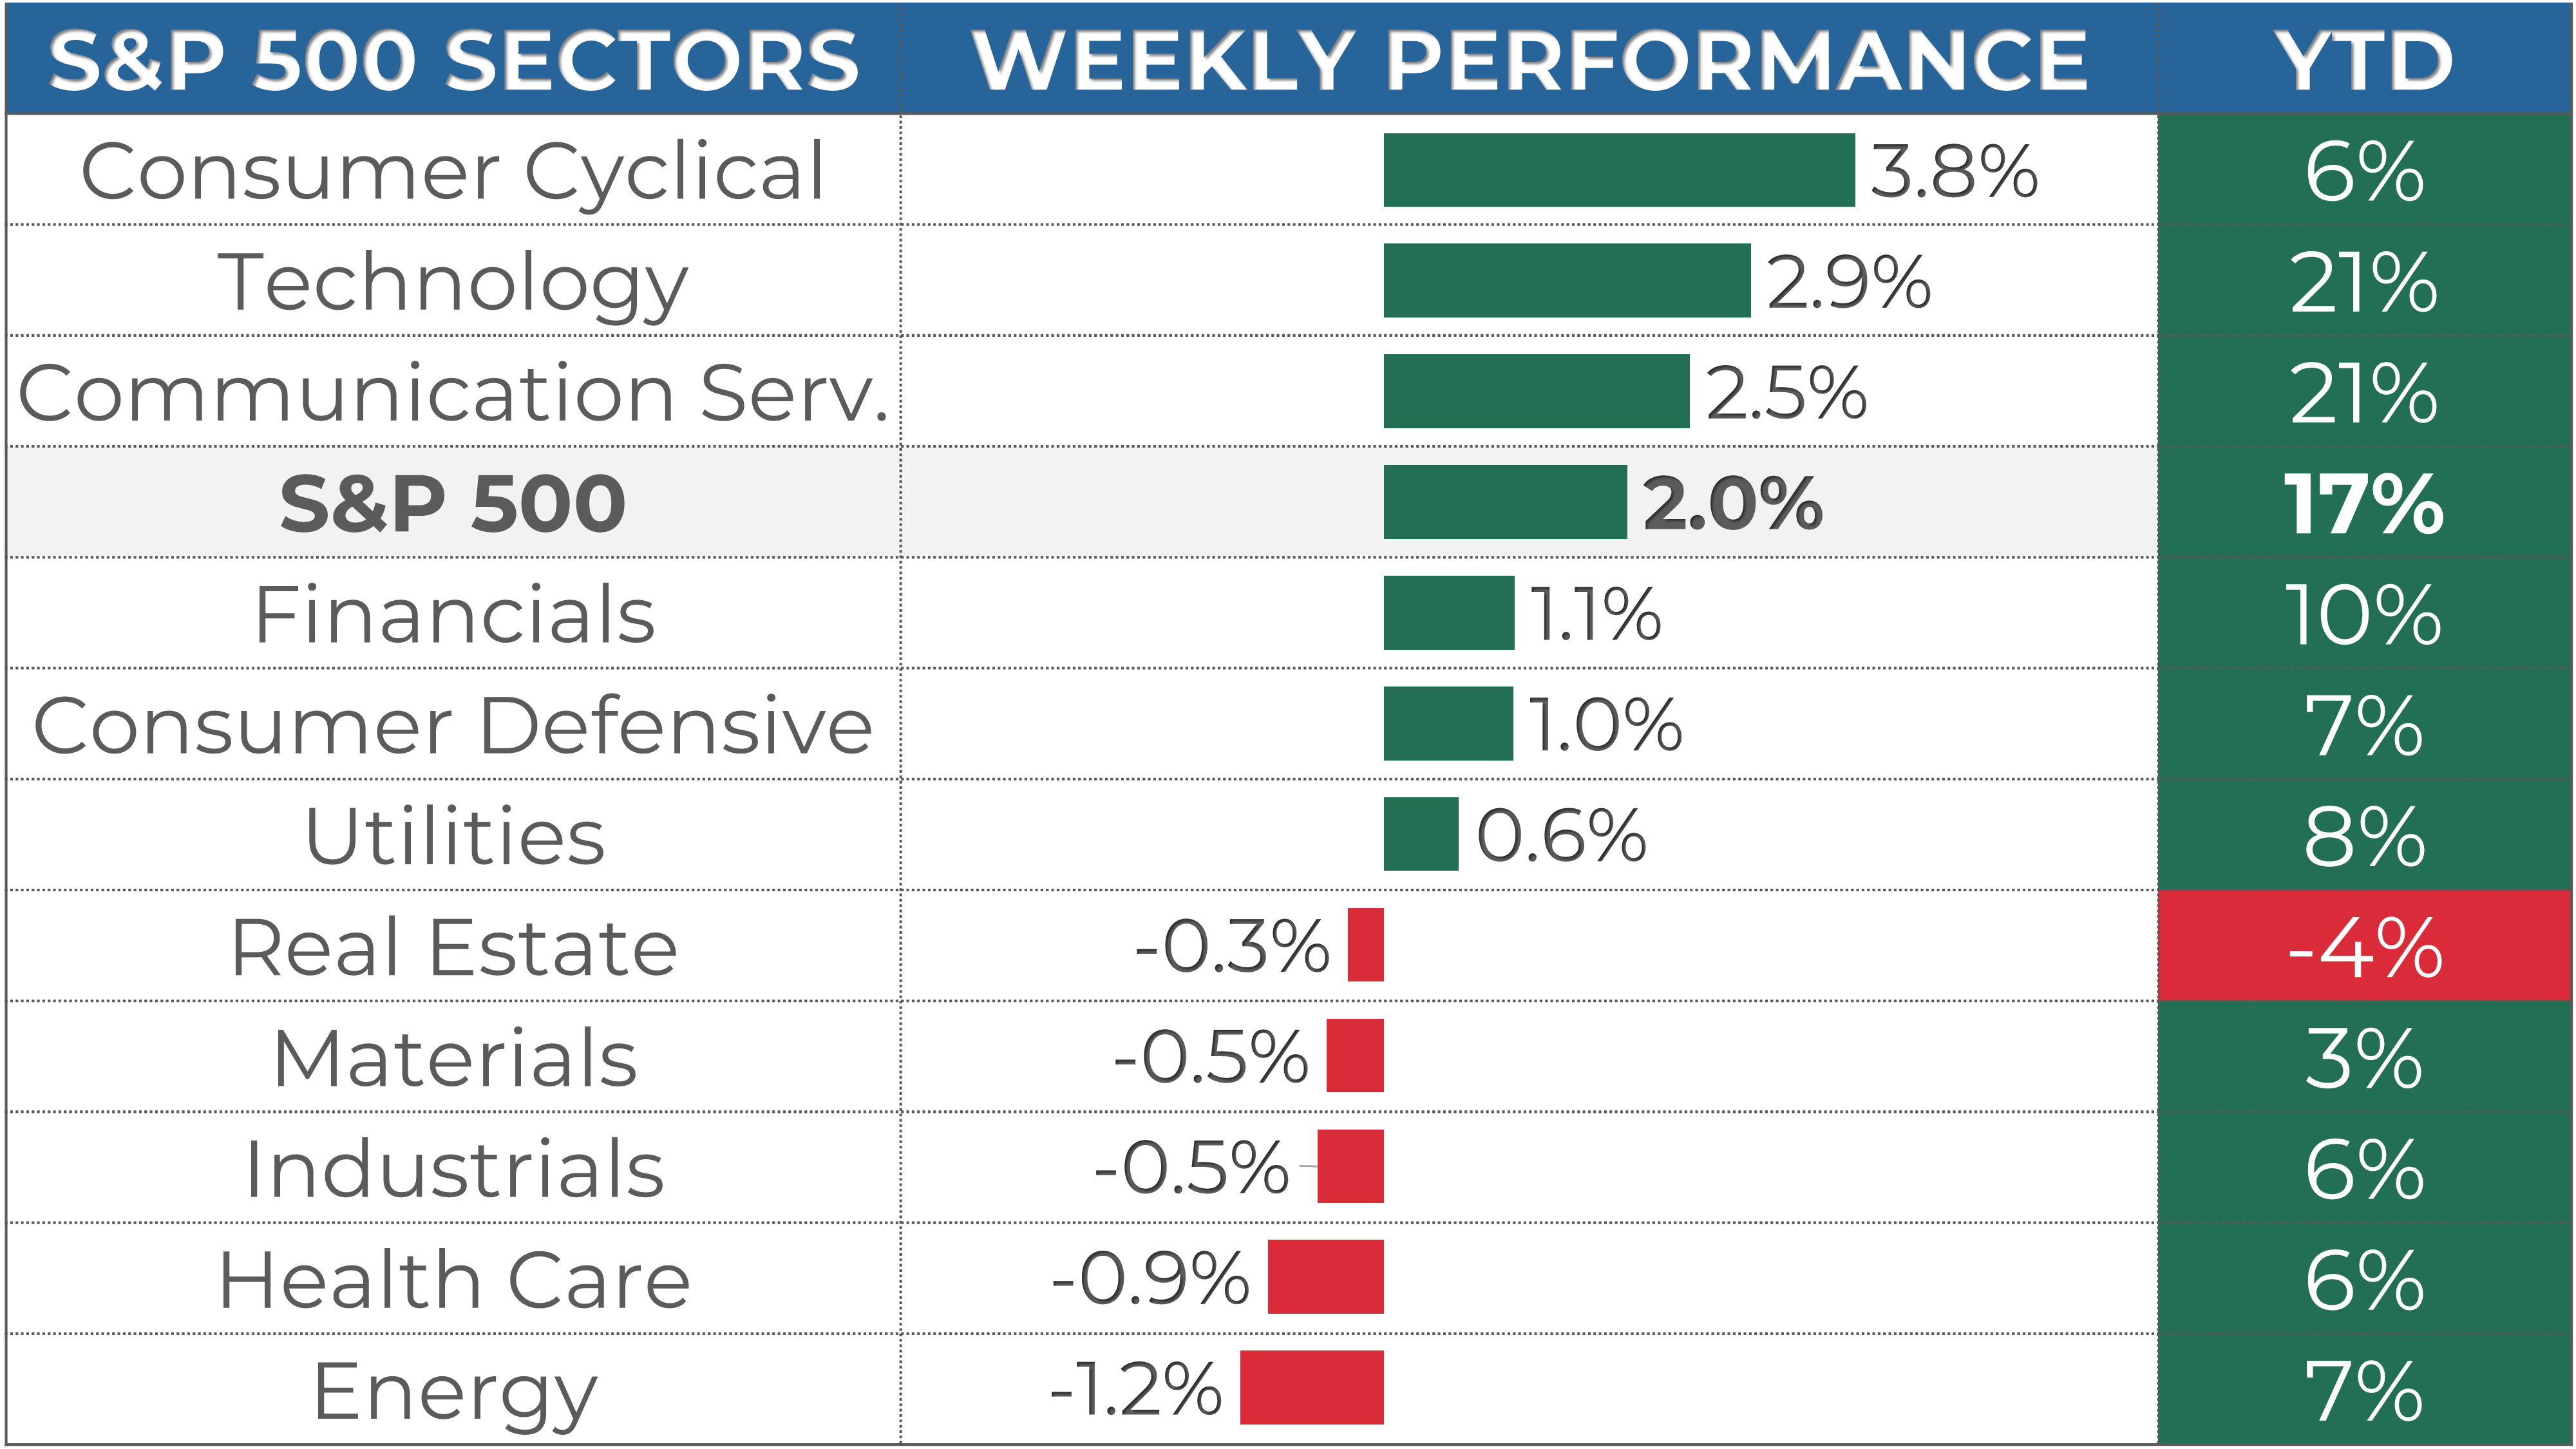
1. S&P 500 Sector Performance
Over the week, 6 of the 11 S&P 500 sectors have achieved gains. Consumer Cyclical led the way, rising by 3.8%. By contrast, Energy was the weakest, falling by -1.2%.
Year-to-date, 10 of the sectors have seen positive results. Technology has been the most successful sector, with a 21% gain. On the other hand, Real Estate has been trailing behind.
2. S&P 500 Top & Worst Performers
In the last 5 trading days, 43% of the stocks in the S&P 500 index rose in value.
The best-performing stocks were:
Tesla Inc (TSLA, 27%)
Paramount Global (PARA, 15%)
ON Semiconductor Corp. (ON, 8%)
Meanwhile, the worst-performing stocks were:
Mosaic Company (MOS, -8%)
First Solar Inc (FSLR, -11%)
Nike, Inc. (NKE, -20%)

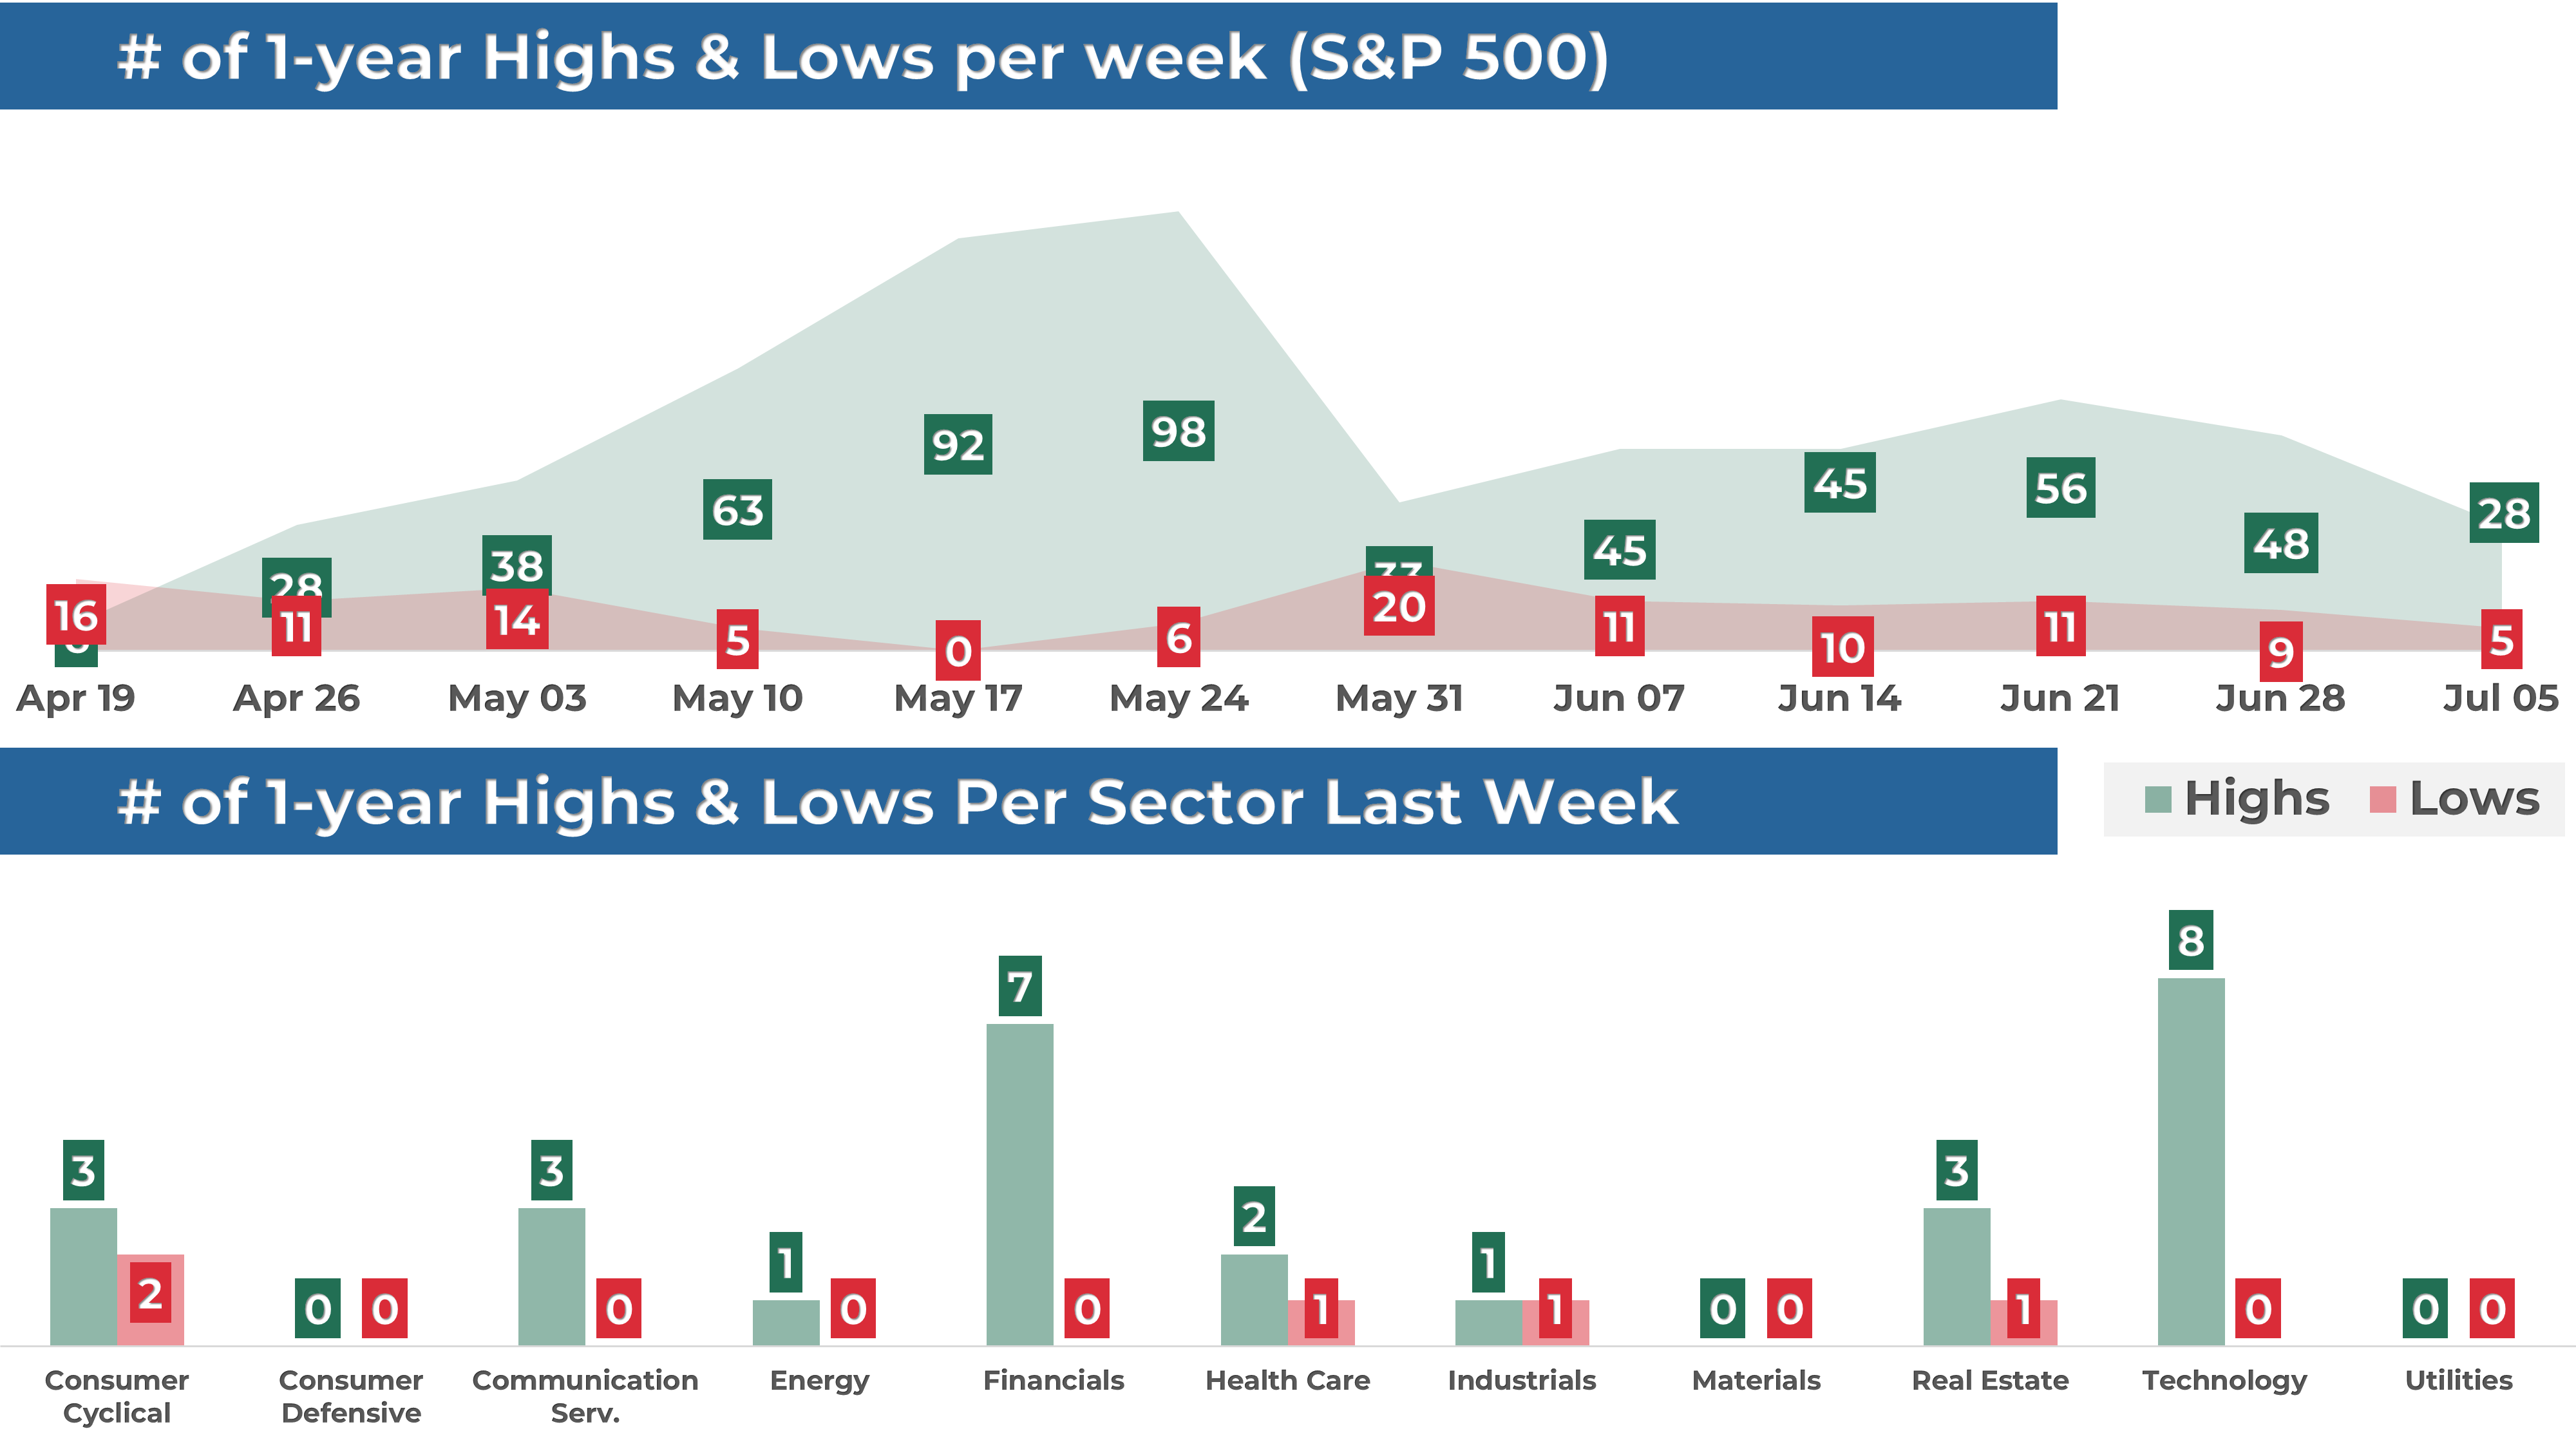
In addition, 28 stocks within the S&P 500 reached a new 52-week high, while 5 set new lows, indicating that the momentum is on the upside. Most of the highs this week came from the Technology sector.
MARKET TRENDS & MOMENTUM
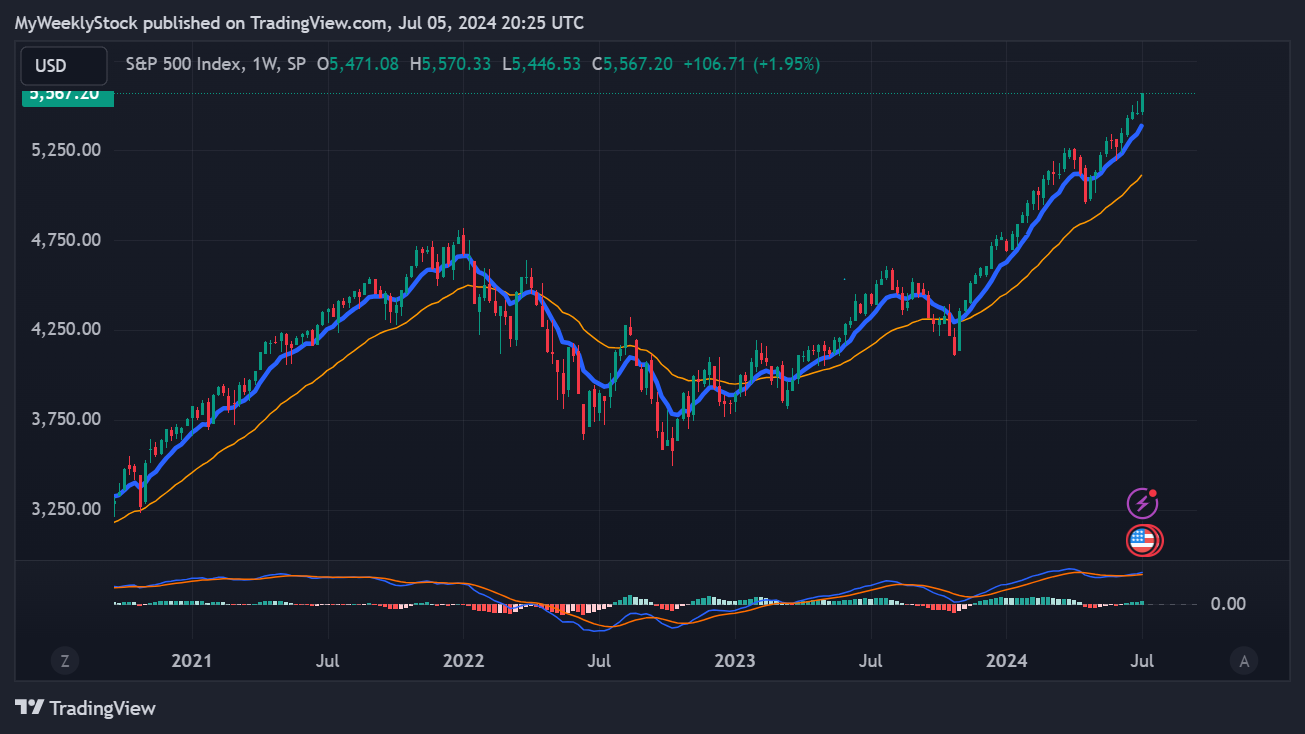
1. S&P 500 Long-Term Trend
The long-term trend for the S&P 500 is positive. I base this evaluation on the 9 and 30-week exponential moving averages (EMAs). To determine if the trend is strongly positive, I look for the following conditions (the 1st is the most important):
9-week EMA is above the 30-week EMA: 🟢
Price is trading above the 9-week EMA: 🟢
Price is trading above the 30-week EMA: 🟢
The 9-week EMA trend line is rising: 🟢
The 30-week EMA trend line is rising: 🟢
I also use the MACD as an additional tool to detect trend changes. The MACD has crossed its signal line, a positive indication for the index.
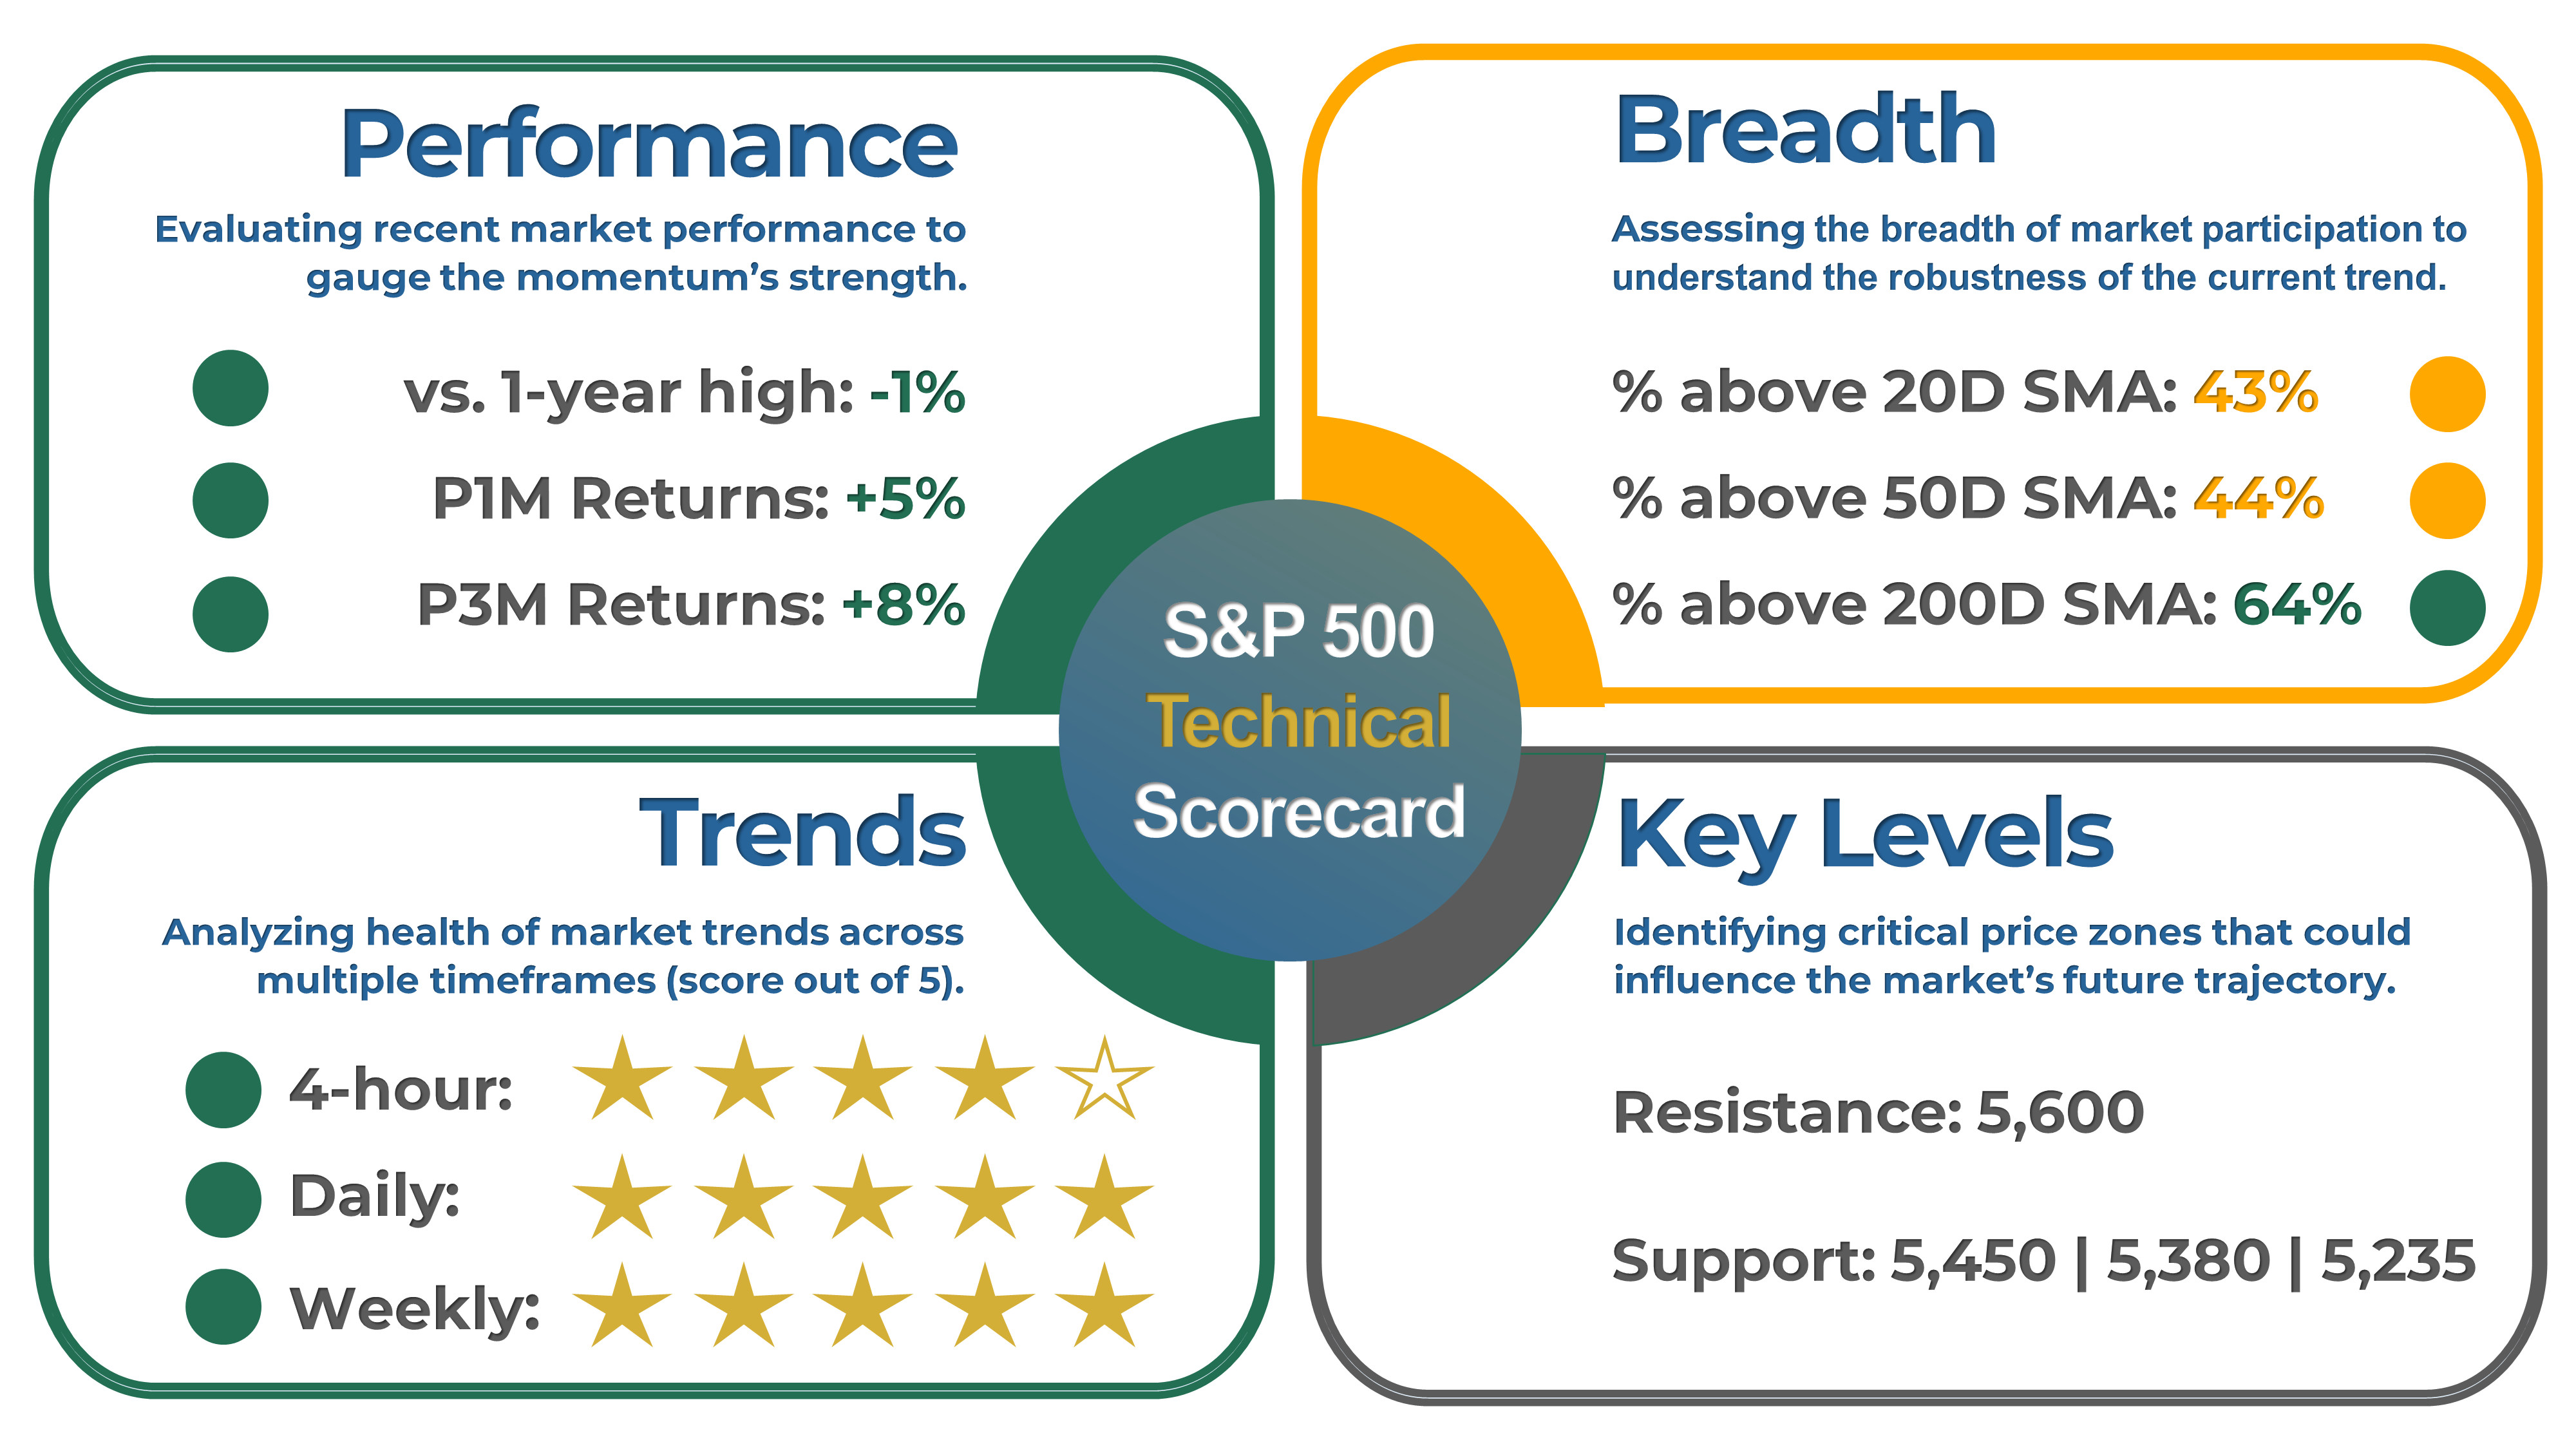
2. S&P 500 Technical Analysis
Healthy bull markets typically see the index set several new highs, broad market participation, and ascending trend lines. That's why I've created a four-part scorecard – a straightforward tool to give us a comprehensive view of these essential health indicators.
Momentum: The index is up 5% over the past month, 8% in the last three months, and is trading 1% away from its 52-week high.
Breadth: Market participation remains healthy in the long term, as 64% of S&P 500 stocks are trading above their 200-day moving average (SMA). Meanwhile, 43% of the stocks are trading above their 20-day SMA, down by 8 points compared to the previous week.
Trends: The trend on 4-hour and 1-day charts is positive, with the index trading price above the 21-period exponential moving averages, and with rising trend lines.
Key levels: The next resistance level is 5,600. On the other hand, the next support areas are at 5,450 and 5,380.
3. Momentum Analysis of the Week
This week's momentum analysis is about the top and worst-performing stocks in each sector. The difference in performance between the best and worst-performing stocks in each sector is huge, emphasizing the importance of stock selection. Choosing wisely when it comes to stock selection can have a significant impact on your portfolio.

EARNINGS RECAP
1. Q2 and Full Year 2024 Expected EPS & Revenue Growth
Q2 2024 earnings for the S&P 500 are expected to be up 10%. Excluding the energy sector, the figure is +10%.
Earnings are projected to grow by 11% in 2024, higher than the 9% growth seen on average over the last decade. In the past four weeks, 45% of earnings revisions made by analysts were to increase their outlook.
The forward 4-quarter P/E ratio is 21.2, higher than the average over the past five and ten years.
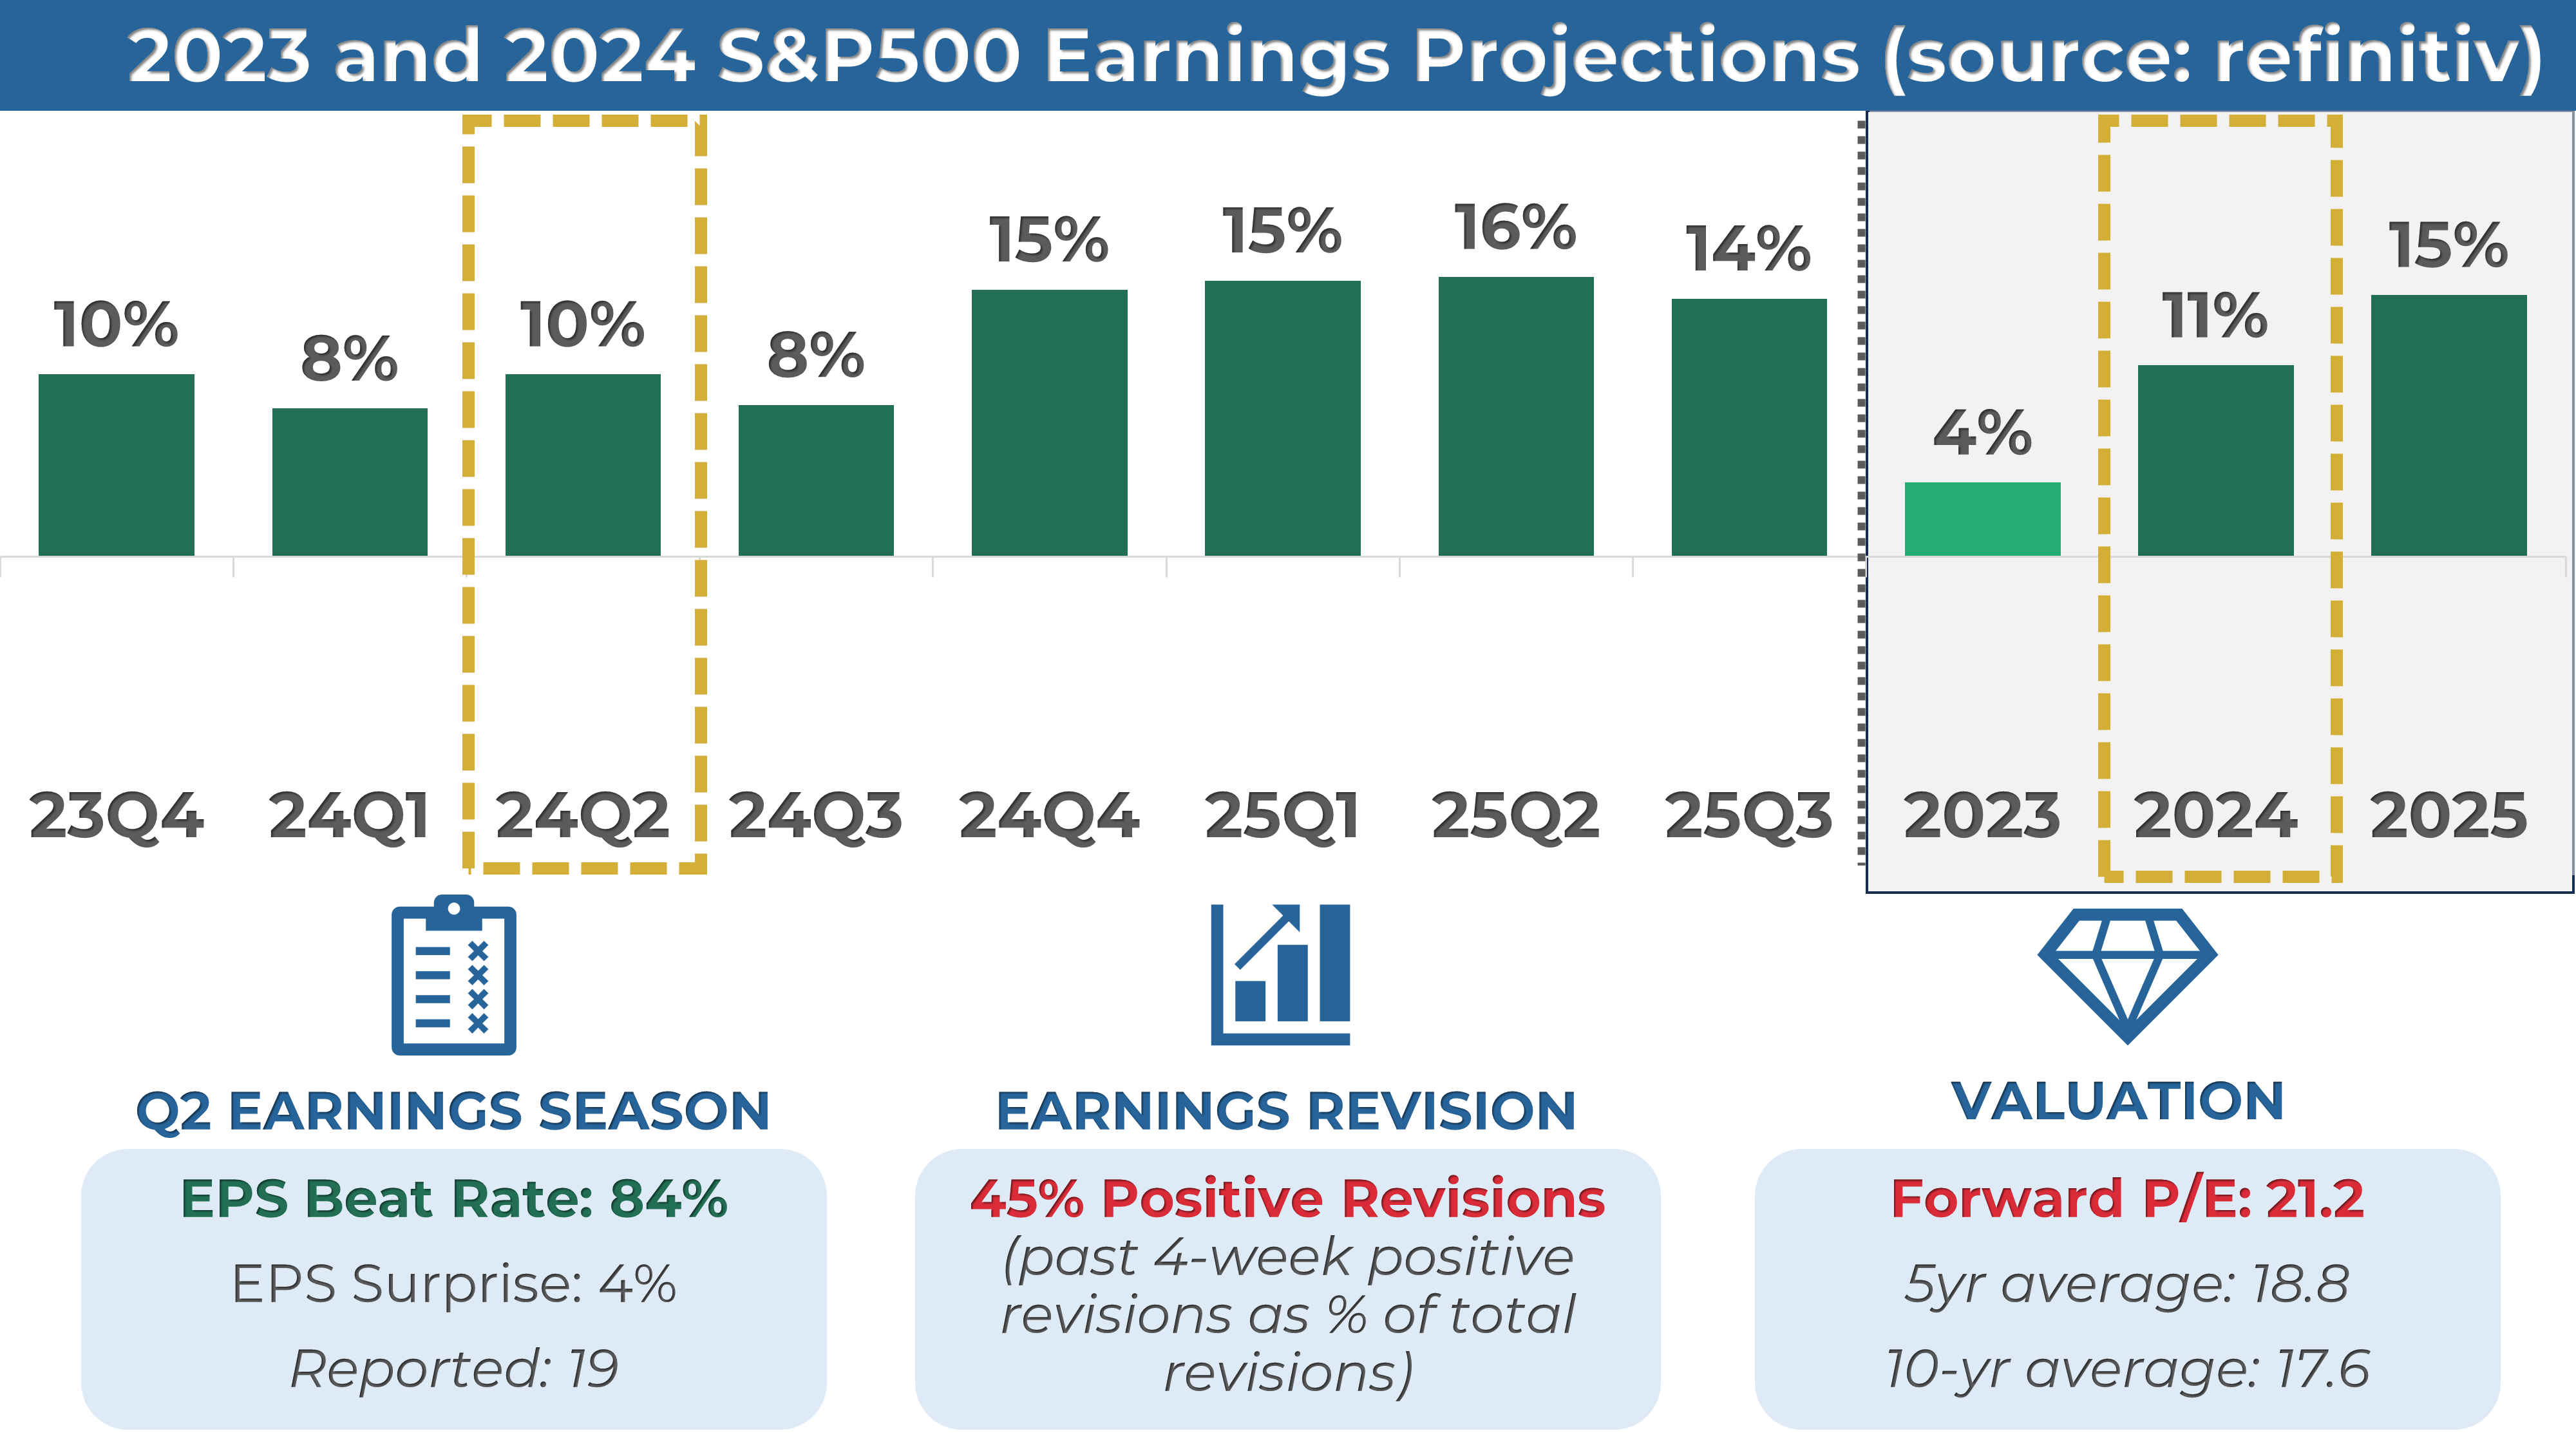
2. Q1 Earnings Season Summary
19 companies from the S&P 500 index have released their Q2 2024 earnings, with 84% posting higher EPS than expectations. This is higher than the previous four-quarter average of 79% and the historical average of 67%.
MARKET SENTIMENT
Measures of investor sentiment can be helpful as they provide insight into the views and opinions of professional or individual investors. However, it's important to note that these measures are not perfect predictors of market movements. They should be combined with other indicators and analysis tools for a complete market picture.

1. AAII Sentiment Survey (Individual Investors)
The American Association of Individual Investors (AAII) conducts a weekly survey among its members to gauge their expectations for the stock market over the next six months. The results are published every Wednesday.
According to the most recent AAII survey, 42% of the respondents had a bullish outlook on the stock market, decreasing by 3 points from the previous week.
2. BofA Bull & Bear Indicator (Institutional Investors)
The Bank of America Bull-Bear Indicator is a proprietary measure of investor sentiment developed by Bank of America. It is based on a survey of fund managers and institutional investors, and it tracks the percentage of respondents who are bullish, bearish, or neutral on the stock market. Results are published in the form of a score ranging from 0 (extremely bearish) to 10 (extremely bullish)
The indicator decreased from 6.2 to 6.1, a slightly bullish sentiment reading.
3. CNN Fear & Greed Index (Technical)
The CNN Fear & Greed Index is a daily measure that analyzes seven market indicators to assess how emotions influence investors' decisions. The index is scored out of 100 and categorizes results into five stages: Extreme Fear, Fear, Neutral, Greed, and Extreme Greed.
The index closed at 54 or a “Neutral” level, up from 44 last Friday.
THE WEEK AHEAD
1. Economic Calendar
We have a busy week of data ahead of us. On Tuesday, the Fed Chair will testify in Congress about the central bank's economic outlook and monetary policy. On Thursday, we will get an inflation update with the Consumer Price Index (CPI), followed by the Producer Price Index (PPI) on Friday.
2. Earnings Calendar
The earnings season is starting, and 8 companies from the S&P 500, including JPMorgan and PepsiCo, are expected to release their quarterly results.
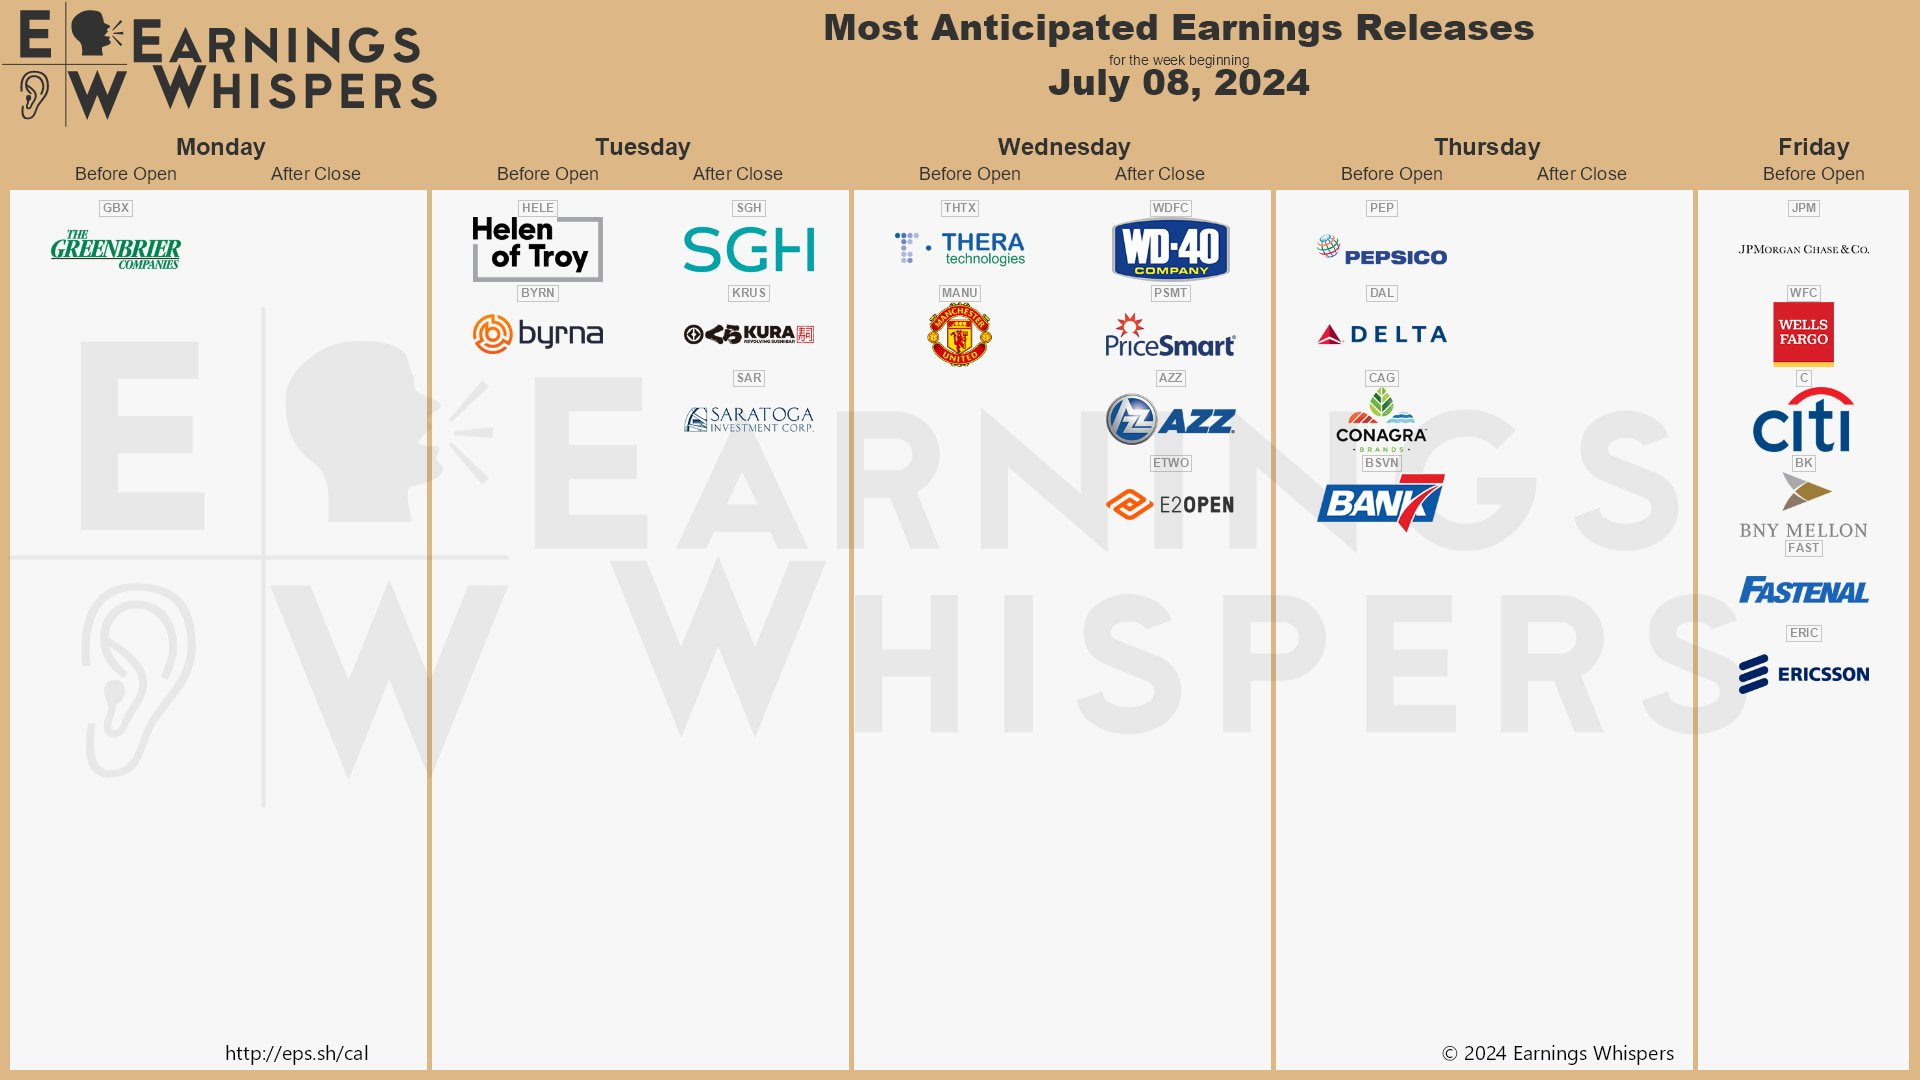
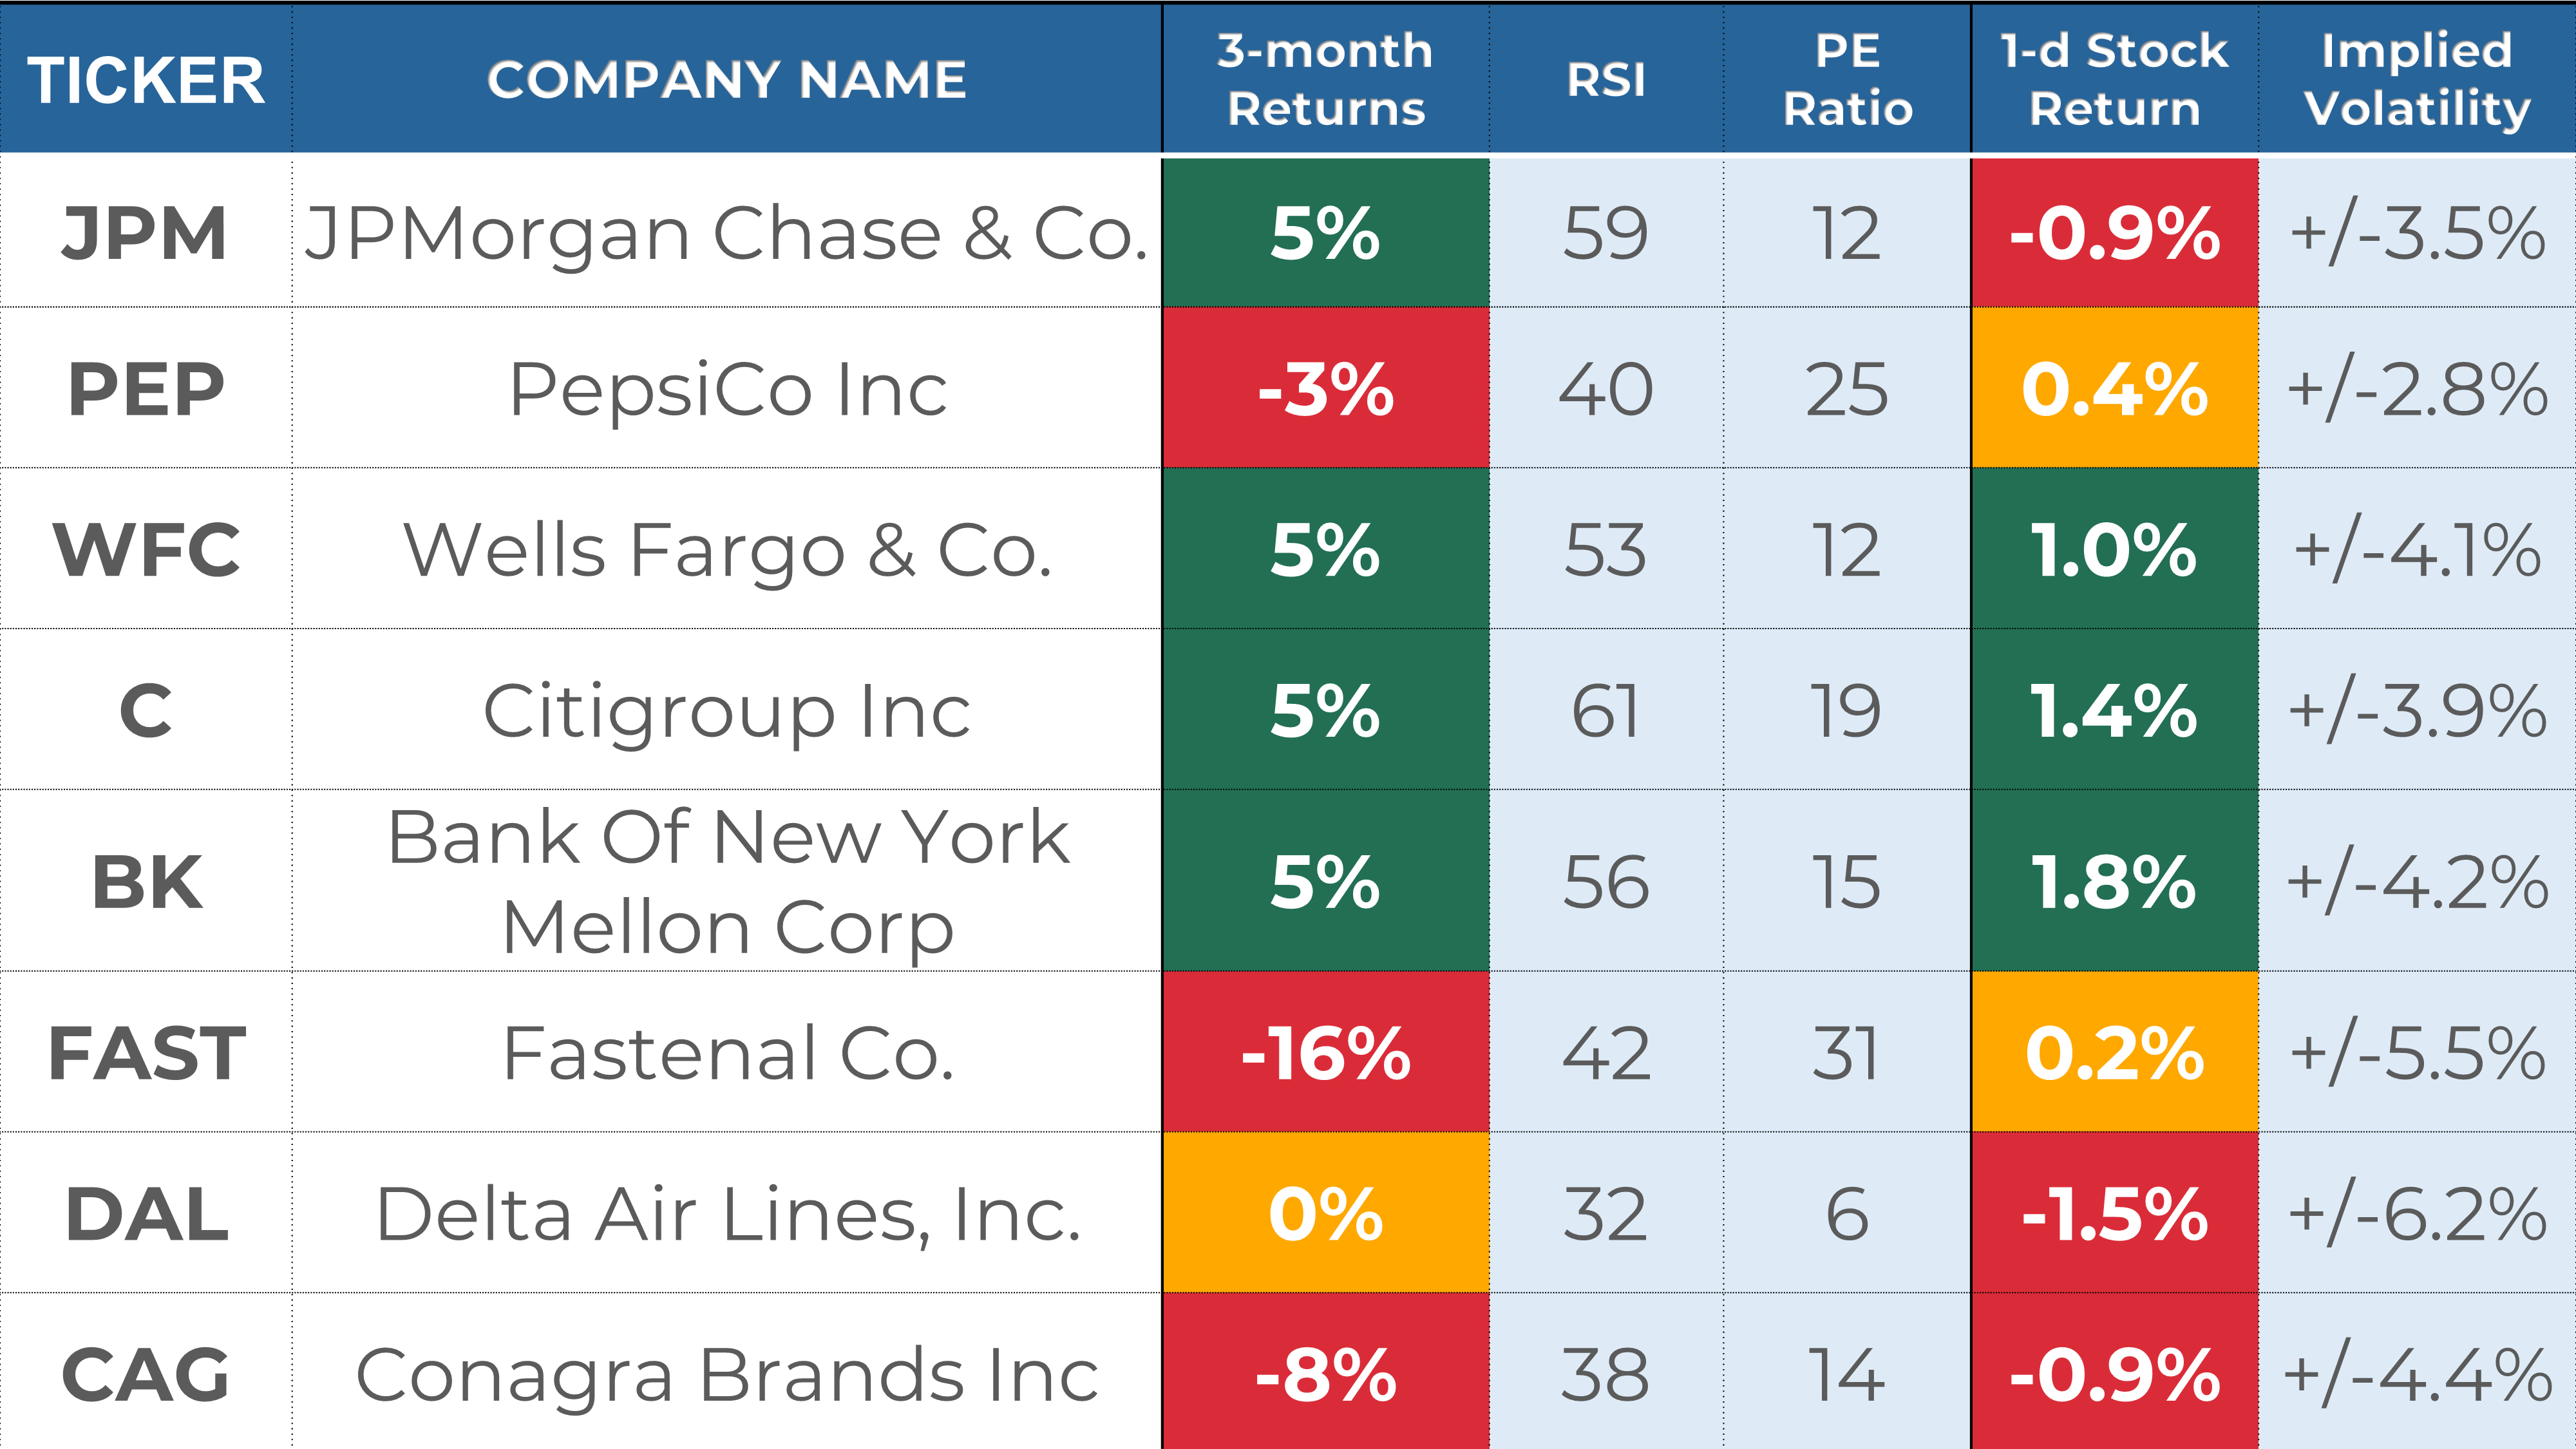
3. Next Week’s Earnings Watchlist
Below is my watchlist of stocks reporting week next week, along with several key indicators I like to review:
Stock Indicators:
Stock performance in the last 3 months.
RSI, where a reading of 70 indicates overbought status and a reading of 30 oversold.
PE ratio, where a reading below 25 indicates a "cheap" valuation and/or low growth expectations.
Stock Price Reactions to Earnings:
1-day Stock Return on Earnings is the stock performance on the earnings release date.
Implied volatility is the expected 1-day stock change after earnings are released, as assessed by the options markets.
Every week, I share a deep dive into 1 stock reporting earnings in the coming days. This week, I prepared an in-depth overview of JPMorgan ($JPM). In this post, I break down key data points around JPM’s fundamentals, stock returns, analyst ratings, and past earnings performance to help you make informed investment decisions. Check out the post and learn why I gave a ”HOLD” rating to JPMorgan.

That’s a wrap for this week’s recap! I hope it helped you understand the market better.
If you enjoyed this post, you should explore the premium section: I provide my short-term trading and analysis of over 20 US large caps and share my long-term investing portfolios. Upgrade your subscription to unlock all the exclusive features and insights. Remember you can get your annual subscription at a 30% discount until the end of July!
If you have any questions or feedback, please don't hesitate to email me or comment on this post. Your support helps me create high-quality content and is greatly appreciated!
Have a great week!
My Weekly Stock
DISCLAIMER
The information provided in this newsletter is for informational purposes only and should not be taken as financial advice. Any investments or decisions made based on the information provided in this newsletter are the reader's sole responsibility. We recommend that readers conduct their own research and consult a qualified financial professional before making investment decisions. The author does not assume any responsibility for any losses or damages arising from using the information provided in this newsletter.