

Weekly Market Recap (Jun 17-21): Another Week, Another High. Cool Down Next?
Weekly Market Recap (Jun 17-21): Another Week, Another High. Cool Down Next?
Everything you need to know about last week's markets performance and what to expect next.
Dear subscribers,
Welcome to My Weekly Stock, where we blend in-depth market analysis with proven momentum-based trading strategies. My mission? Help you navigate the financial markets with unbiased, data-driven insights you can act on!
Every week, I spend hours curating this market recap, producing insightful analyses with clear visuals and a structured layout so you can easily find what you need, week after week. And because it's easy to get swayed by personal bias, I like to let the data do most of the talking.
Let’s get started!
SUMMARY
Here are this week's highlights and what to look out for next:
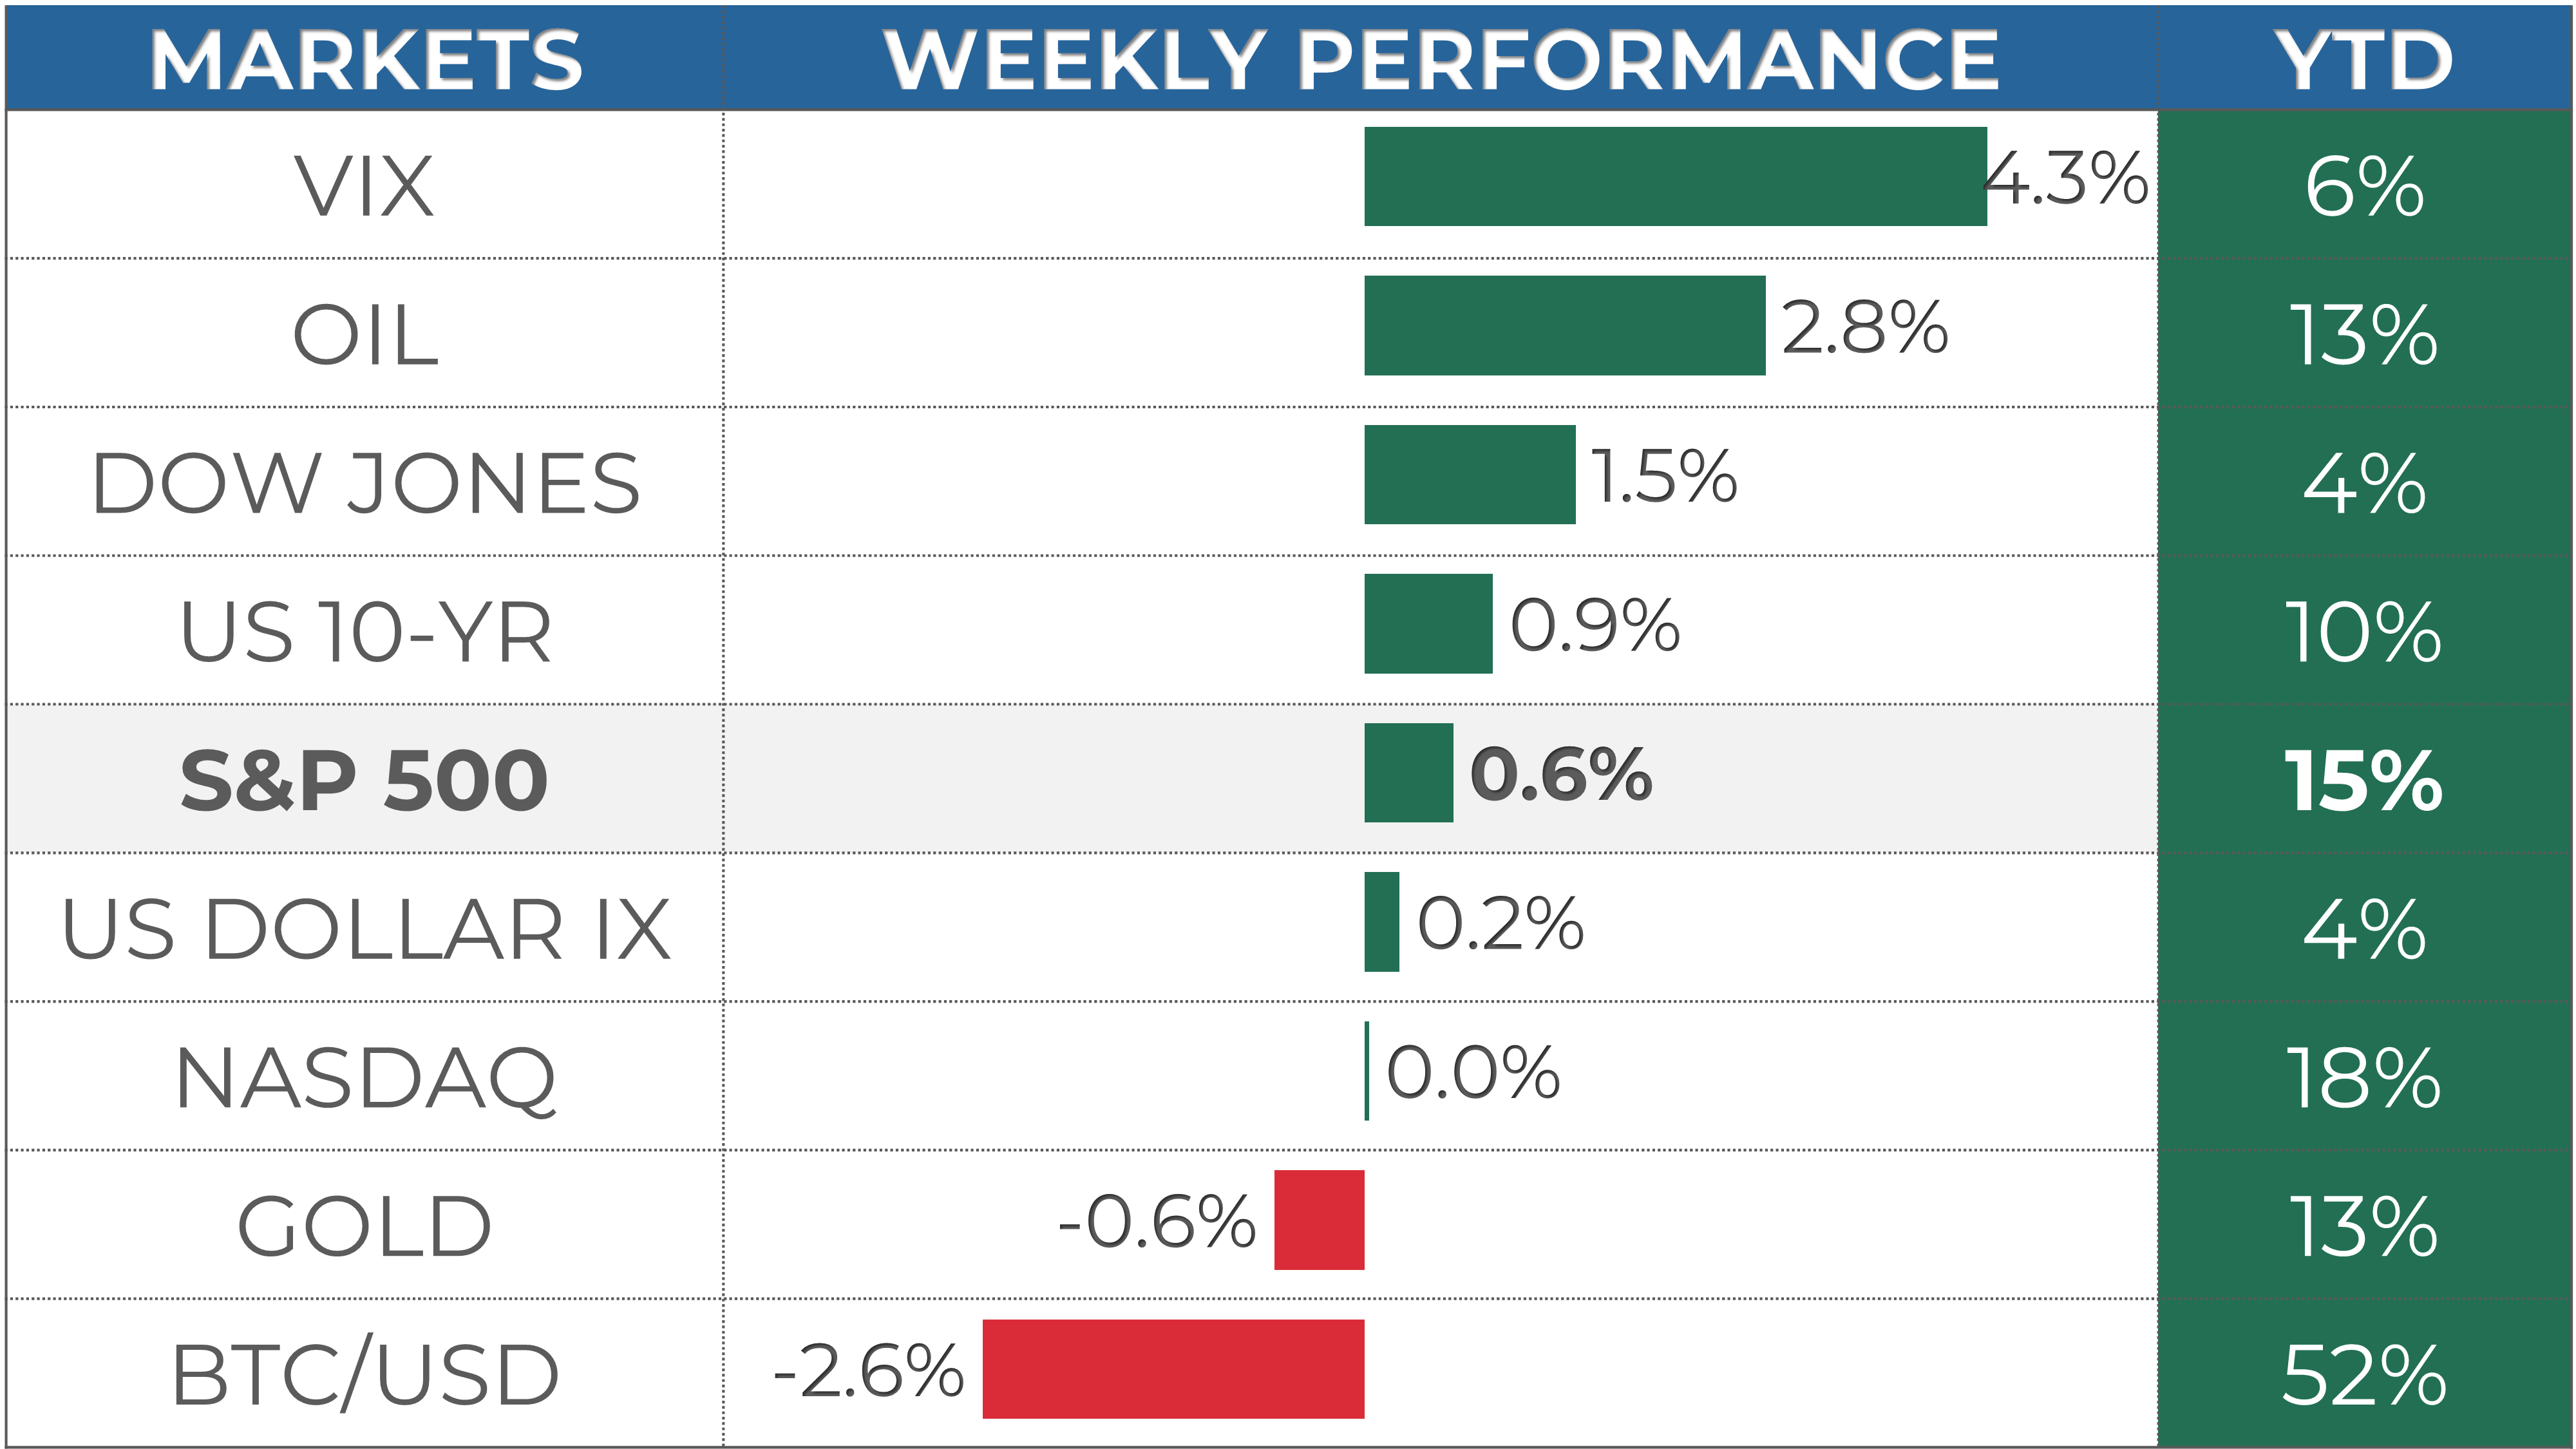
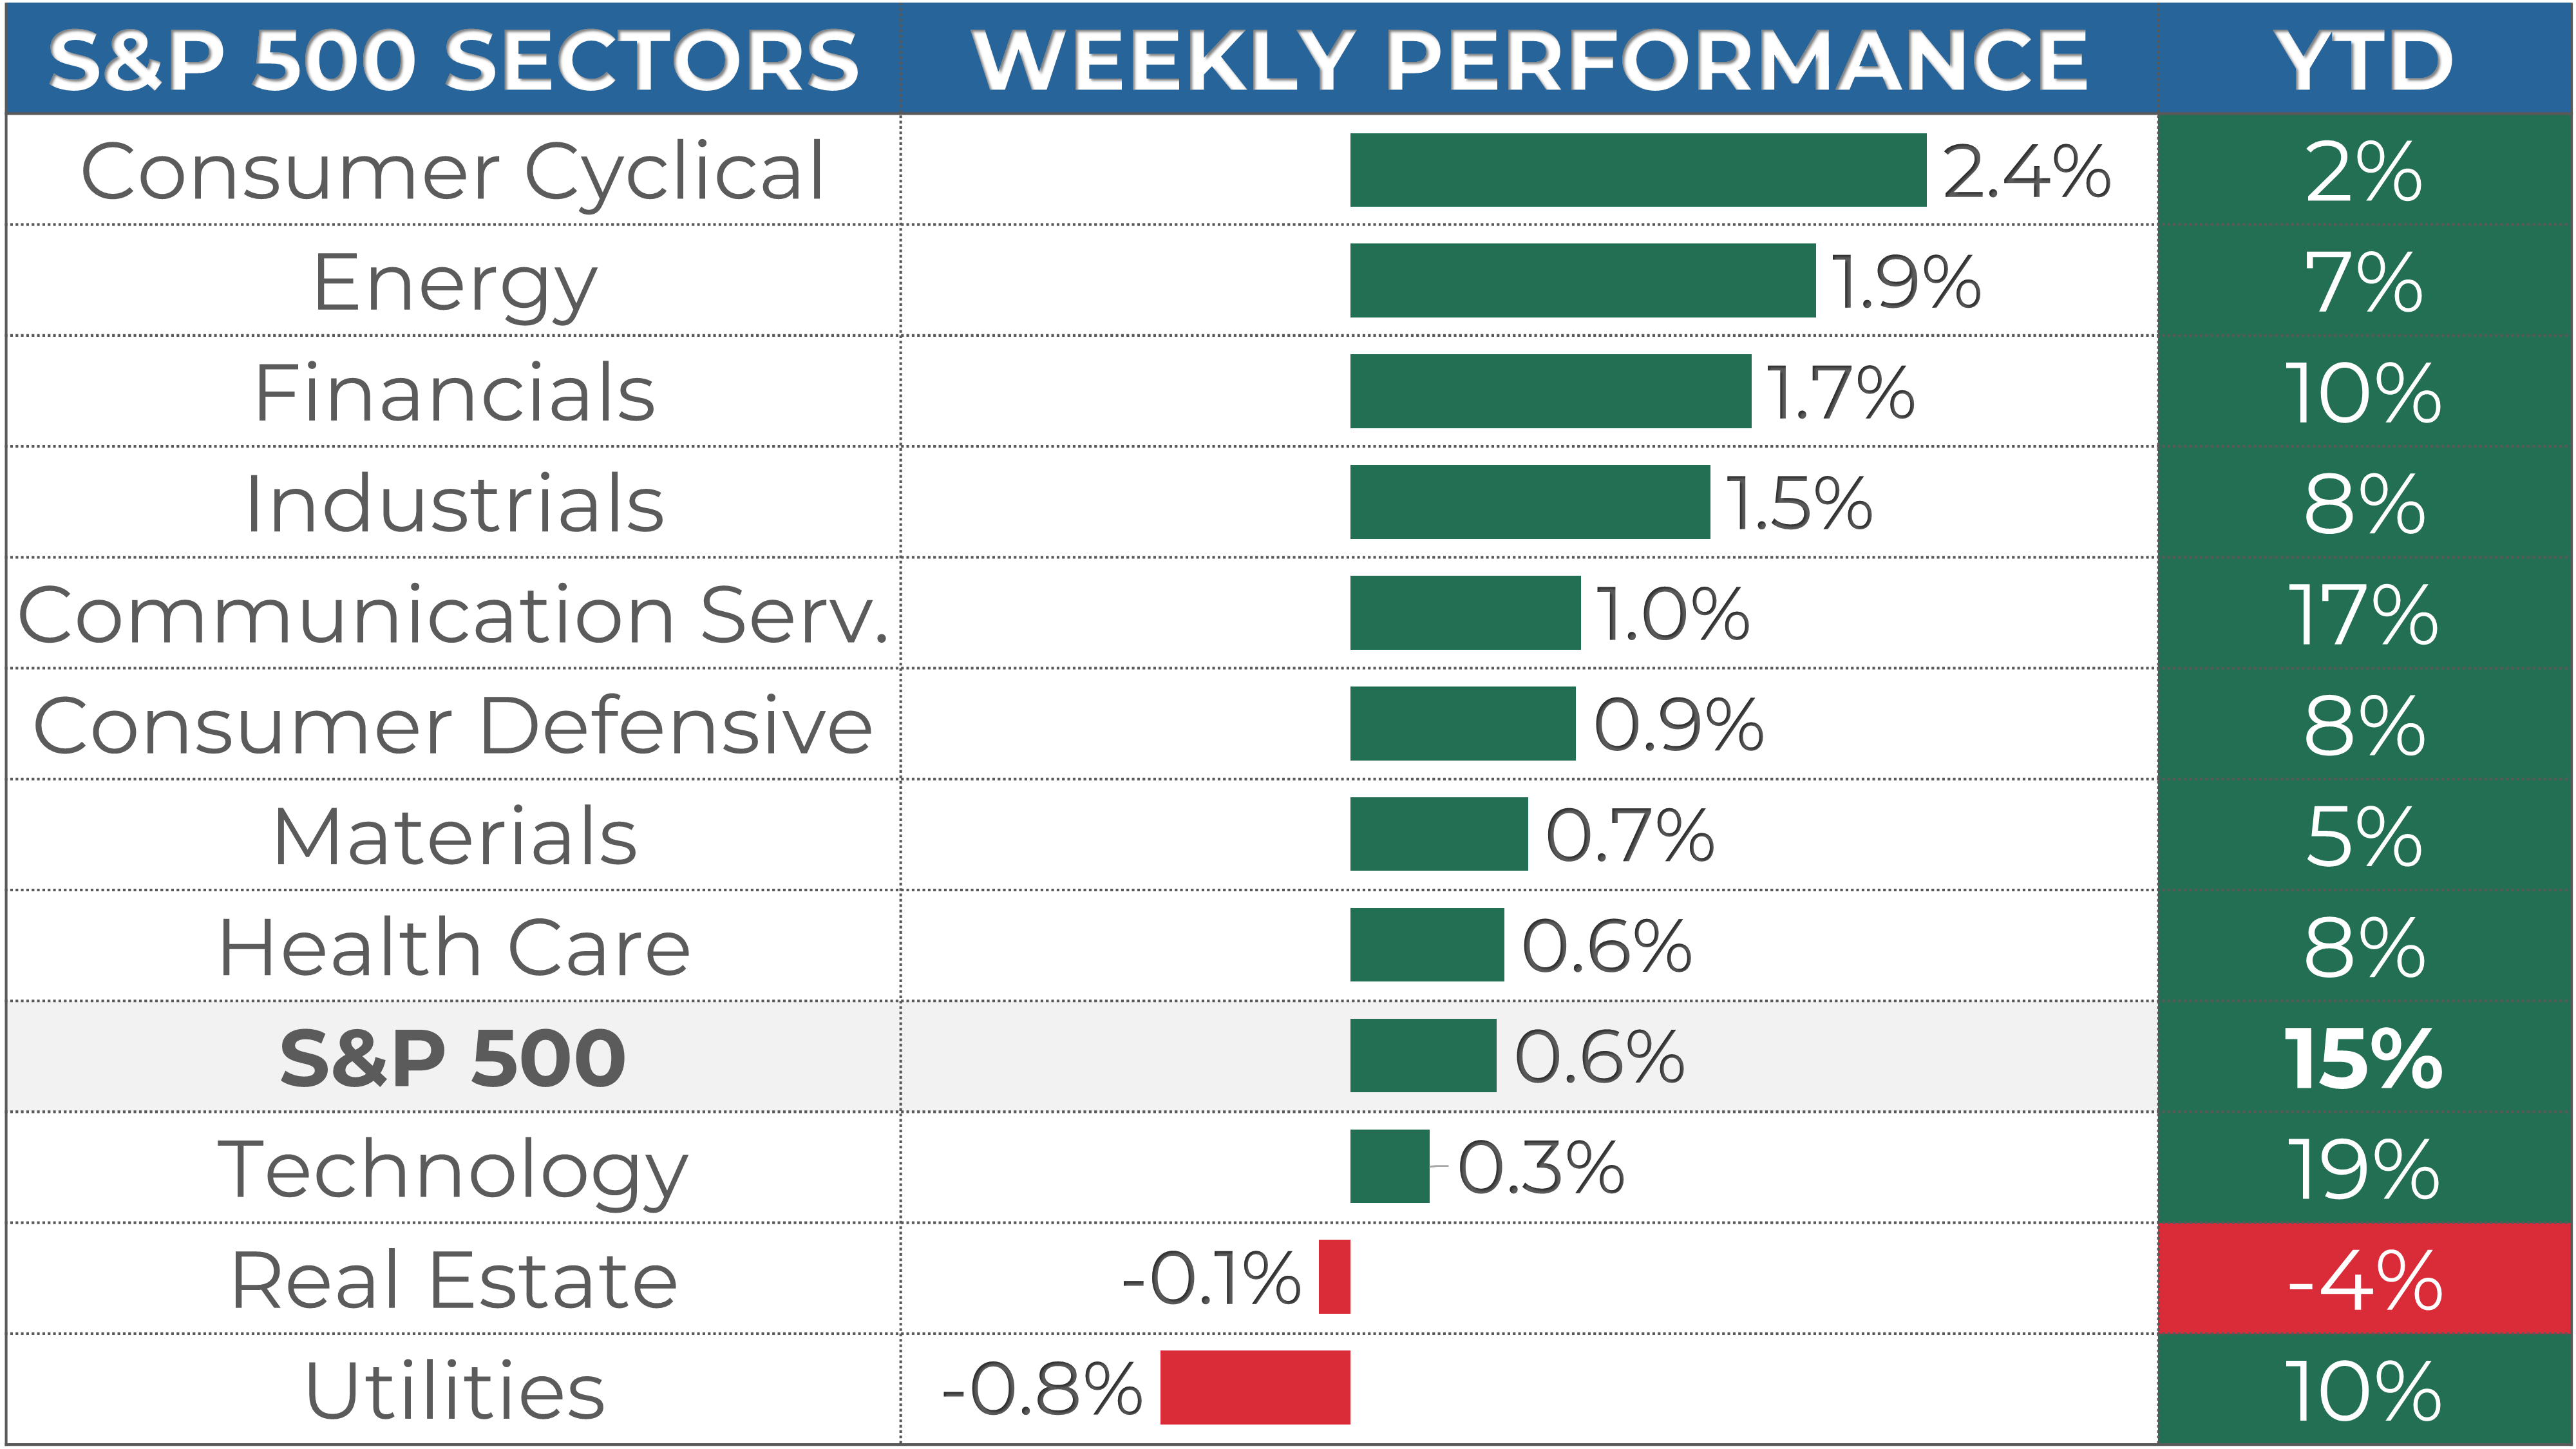
1.The markets were mostly positive for the week, with the S&P 500 up 0.6%, the Nasdaq flat, and the Dow Jones 1.5%. Consumer Cyclical (+2.4%) and Energy (+1.9%) were the best-performing sectors.
2. The S&P 500's long-term trend is positive. 5,500 is the next resistance, while 5,400 is support.
3. The earnings season is almost over, and 499 companies from the S&P 500 index have released their Q1 results, with 79% beating estimates. Earnings are expected to be up 8% in Q1 2024 and 11% in 2024.
4. Market sentiment is at the "Fear" level (41) as measured by CNN’s Fear & Greed indicator, while VIX is at a low value of 13.
5. Earnings reports from Micron and Nike, and the PCE Price Index are scheduled for next week.
My take:
The S&P 500 reached another all-time high this week, marking its third consecutive green week. However, with the index up over 10% since April's low and now nearing a significant threshold at 5,500, it's reasonable to question whether we might see a pullback or at least some consolidation soon.
I've noted previously that mega-cap tech stocks, particularly Nvidia, have largely driven the recent market gains. Meanwhile, the average stock has seen a more challenging performance. Notably, 50% of stocks remain in correction territory, meaning trading more than 10% below their 1-year highs. That's a high figure given the index is sitting at a record high. As mega-caps might see some consolidation next, broader market participation will be more critical than ever to sustain the positive momentum. And while I saw some encouraging signs this week, it is too early to confirm if this rally has further to go.
PERFORMANCE RECAP
1. S&P 500 Sector Performance
Over the week, 9 of the 11 S&P 500 sectors have achieved gains. Consumer Cyclical led the way, rising by 2.4%. By contrast, Utilities was the weakest, falling by -0.8%.
Year-to-date, 10 of the sectors have seen positive results. Technology has been the most successful sector, with a 19% gain. On the other hand, Real Estate has been trailing behind.
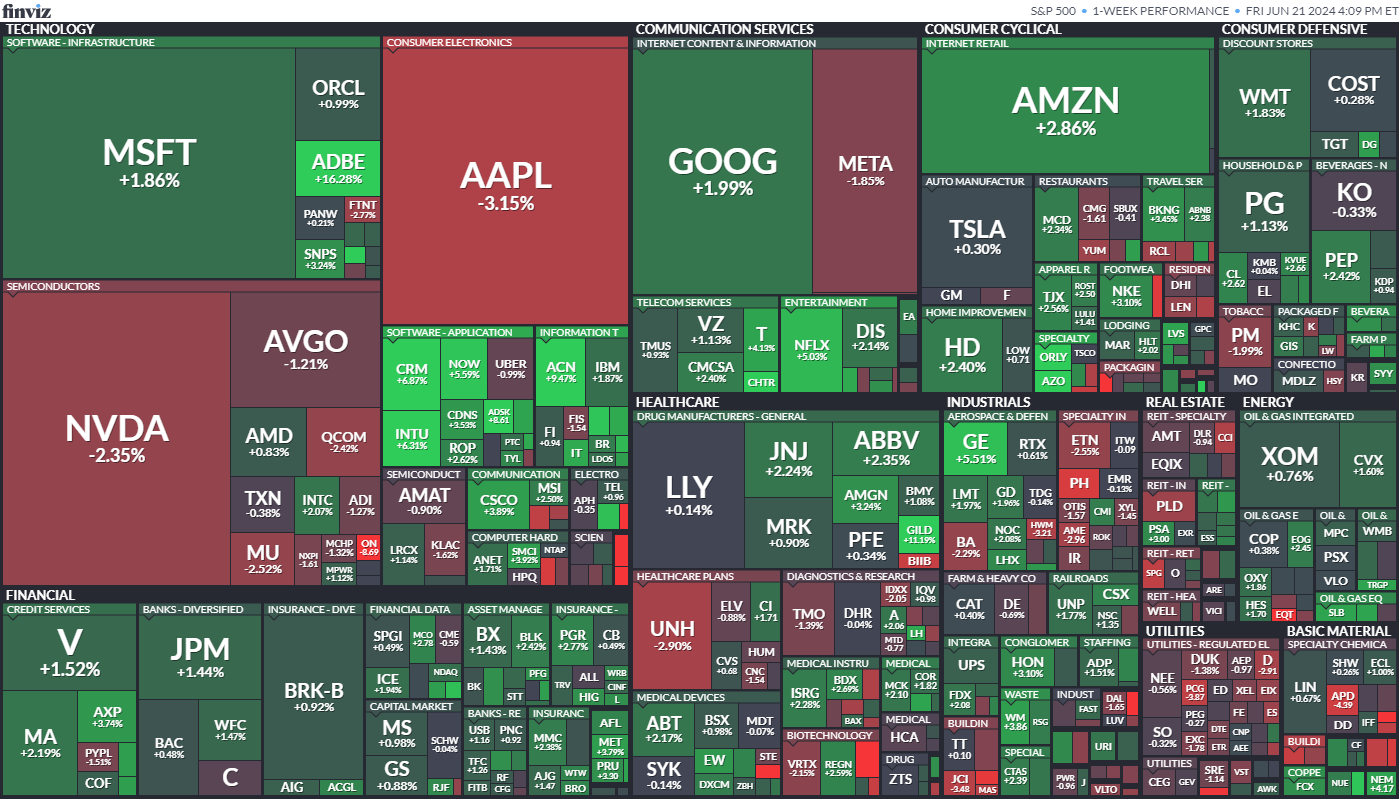
2. S&P 500 Top & Worst Performers
In the last 5 trading days, 61% of the stocks in the S&P 500 index rose in value.
The best-performing stocks were:
Adobe Inc (ADBE, 16%)
Gilead Sciences, Inc. (GILD, 11%)
Accenture plc (ACN, 9%)
Meanwhile, the worst-performing stocks were:
First Solar Inc (FSLR, -11%)
Albemarle Corp. (ALB, -13%)
Enphase Energy Inc (ENPH, -18%)
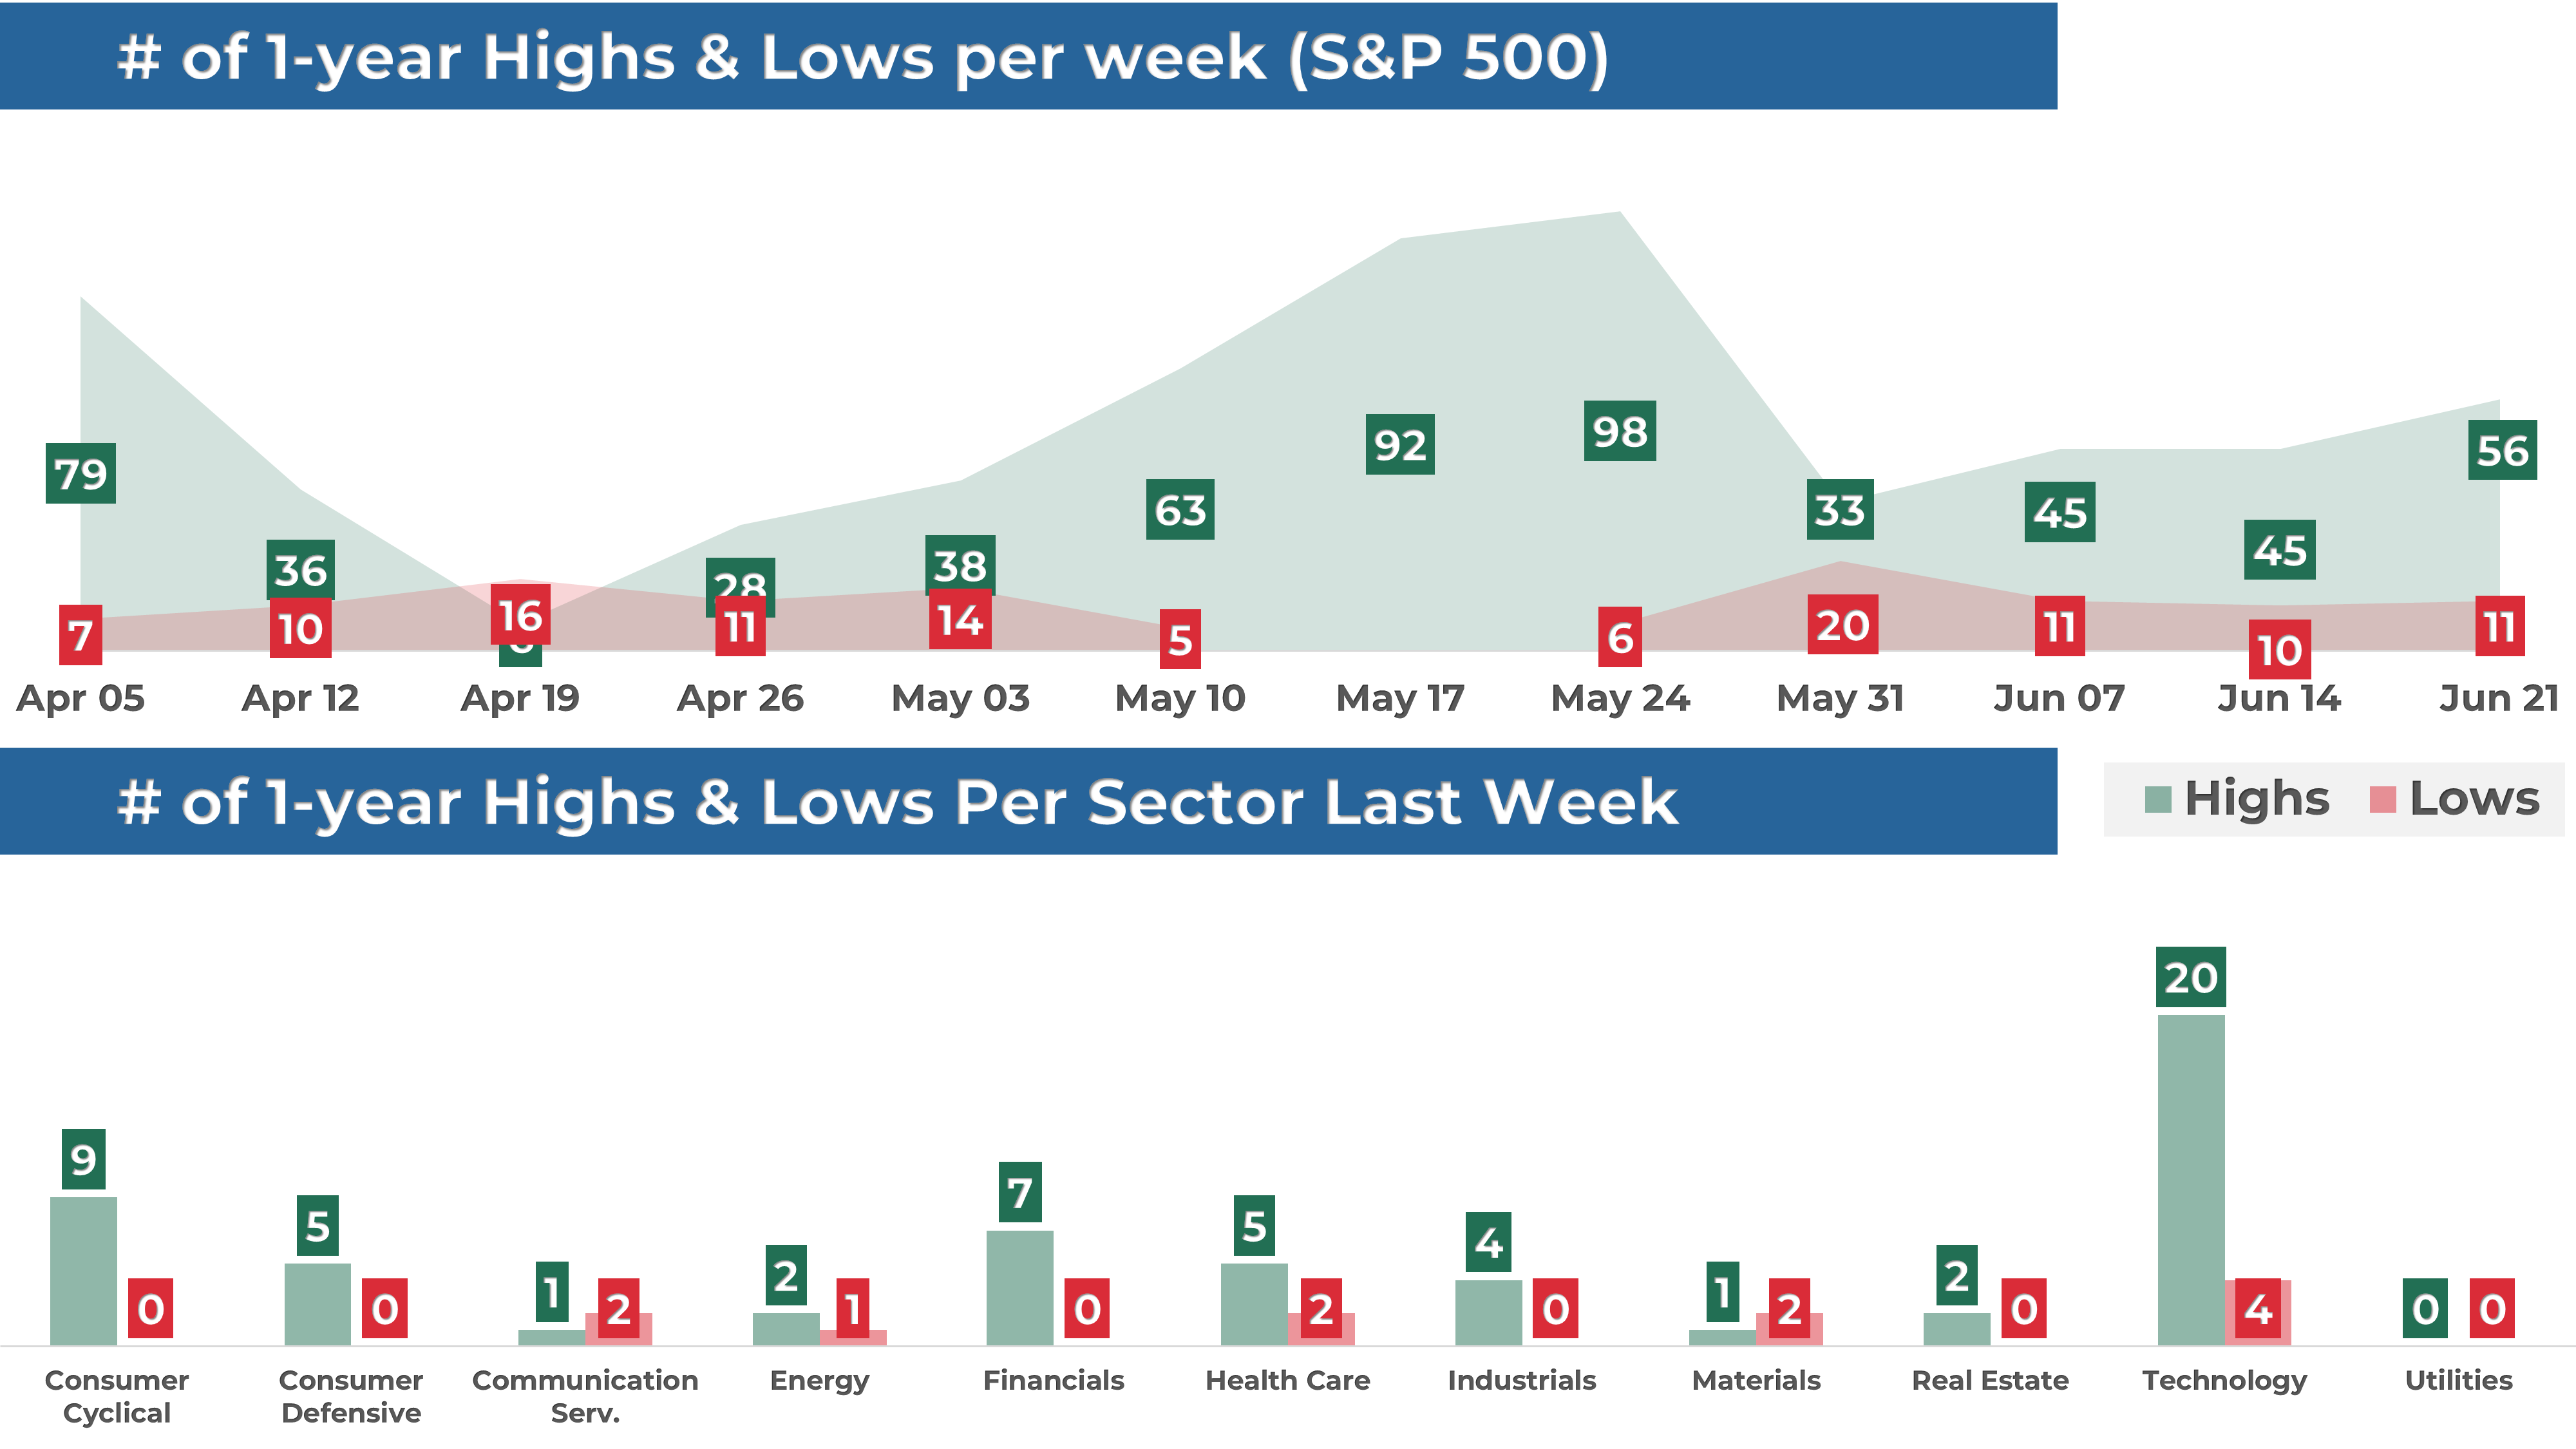
In addition, 56 stocks within the S&P 500 reached a new 52-week high, while 11 set new lows, indicating that the momentum is on the upside. Most of the highs this week came from the Technology sector.
MARKET TRENDS & MOMENTUM
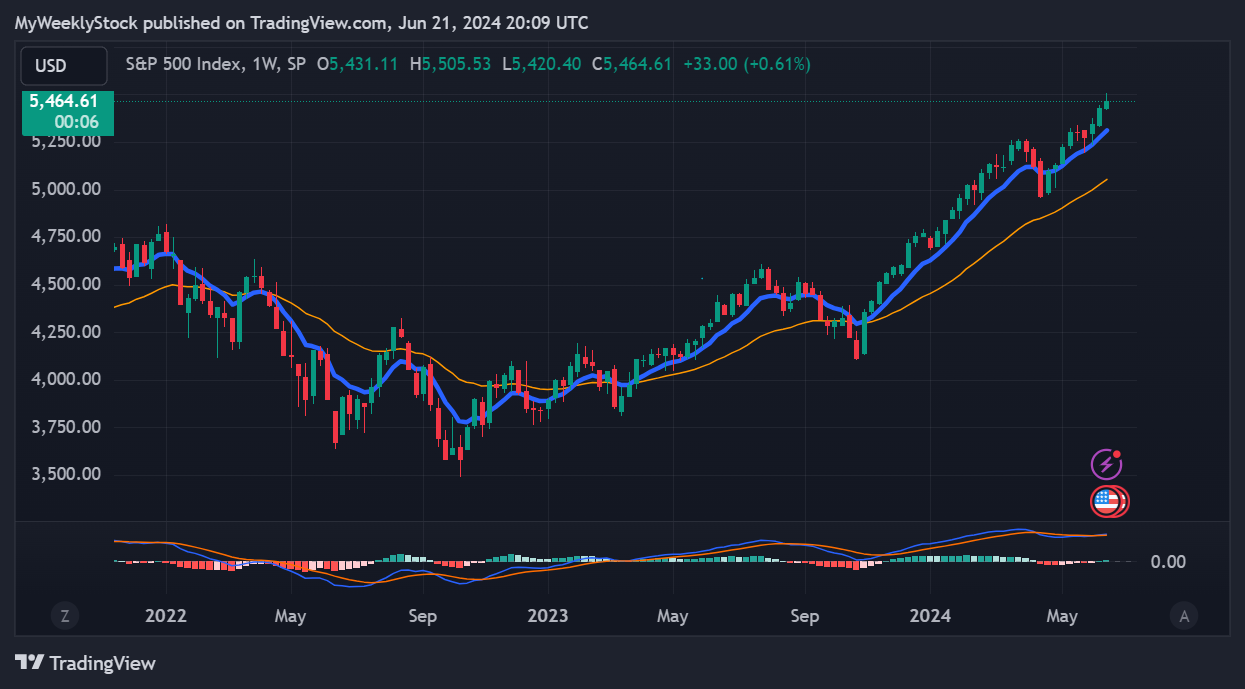
1. S&P 500 Long-Term Trend
The long-term trend for the S&P 500 is positive. I base this evaluation on the 9 and 30-week exponential moving averages (EMAs). To determine if the trend is strongly positive, I look for the following conditions (the 1st is the most important):
9-week EMA is above the 30-week EMA: 🟢
Price is trading above the 9-week EMA: 🟢
Price is trading above the 30-week EMA: 🟢
The 9-week EMA trend line is rising: 🟢
The 30-week EMA trend line is rising: 🟢
I also use the MACD as an additional tool to detect trend changes. The MACD is currently neutral.
2. S&P 500 Technical Analysis
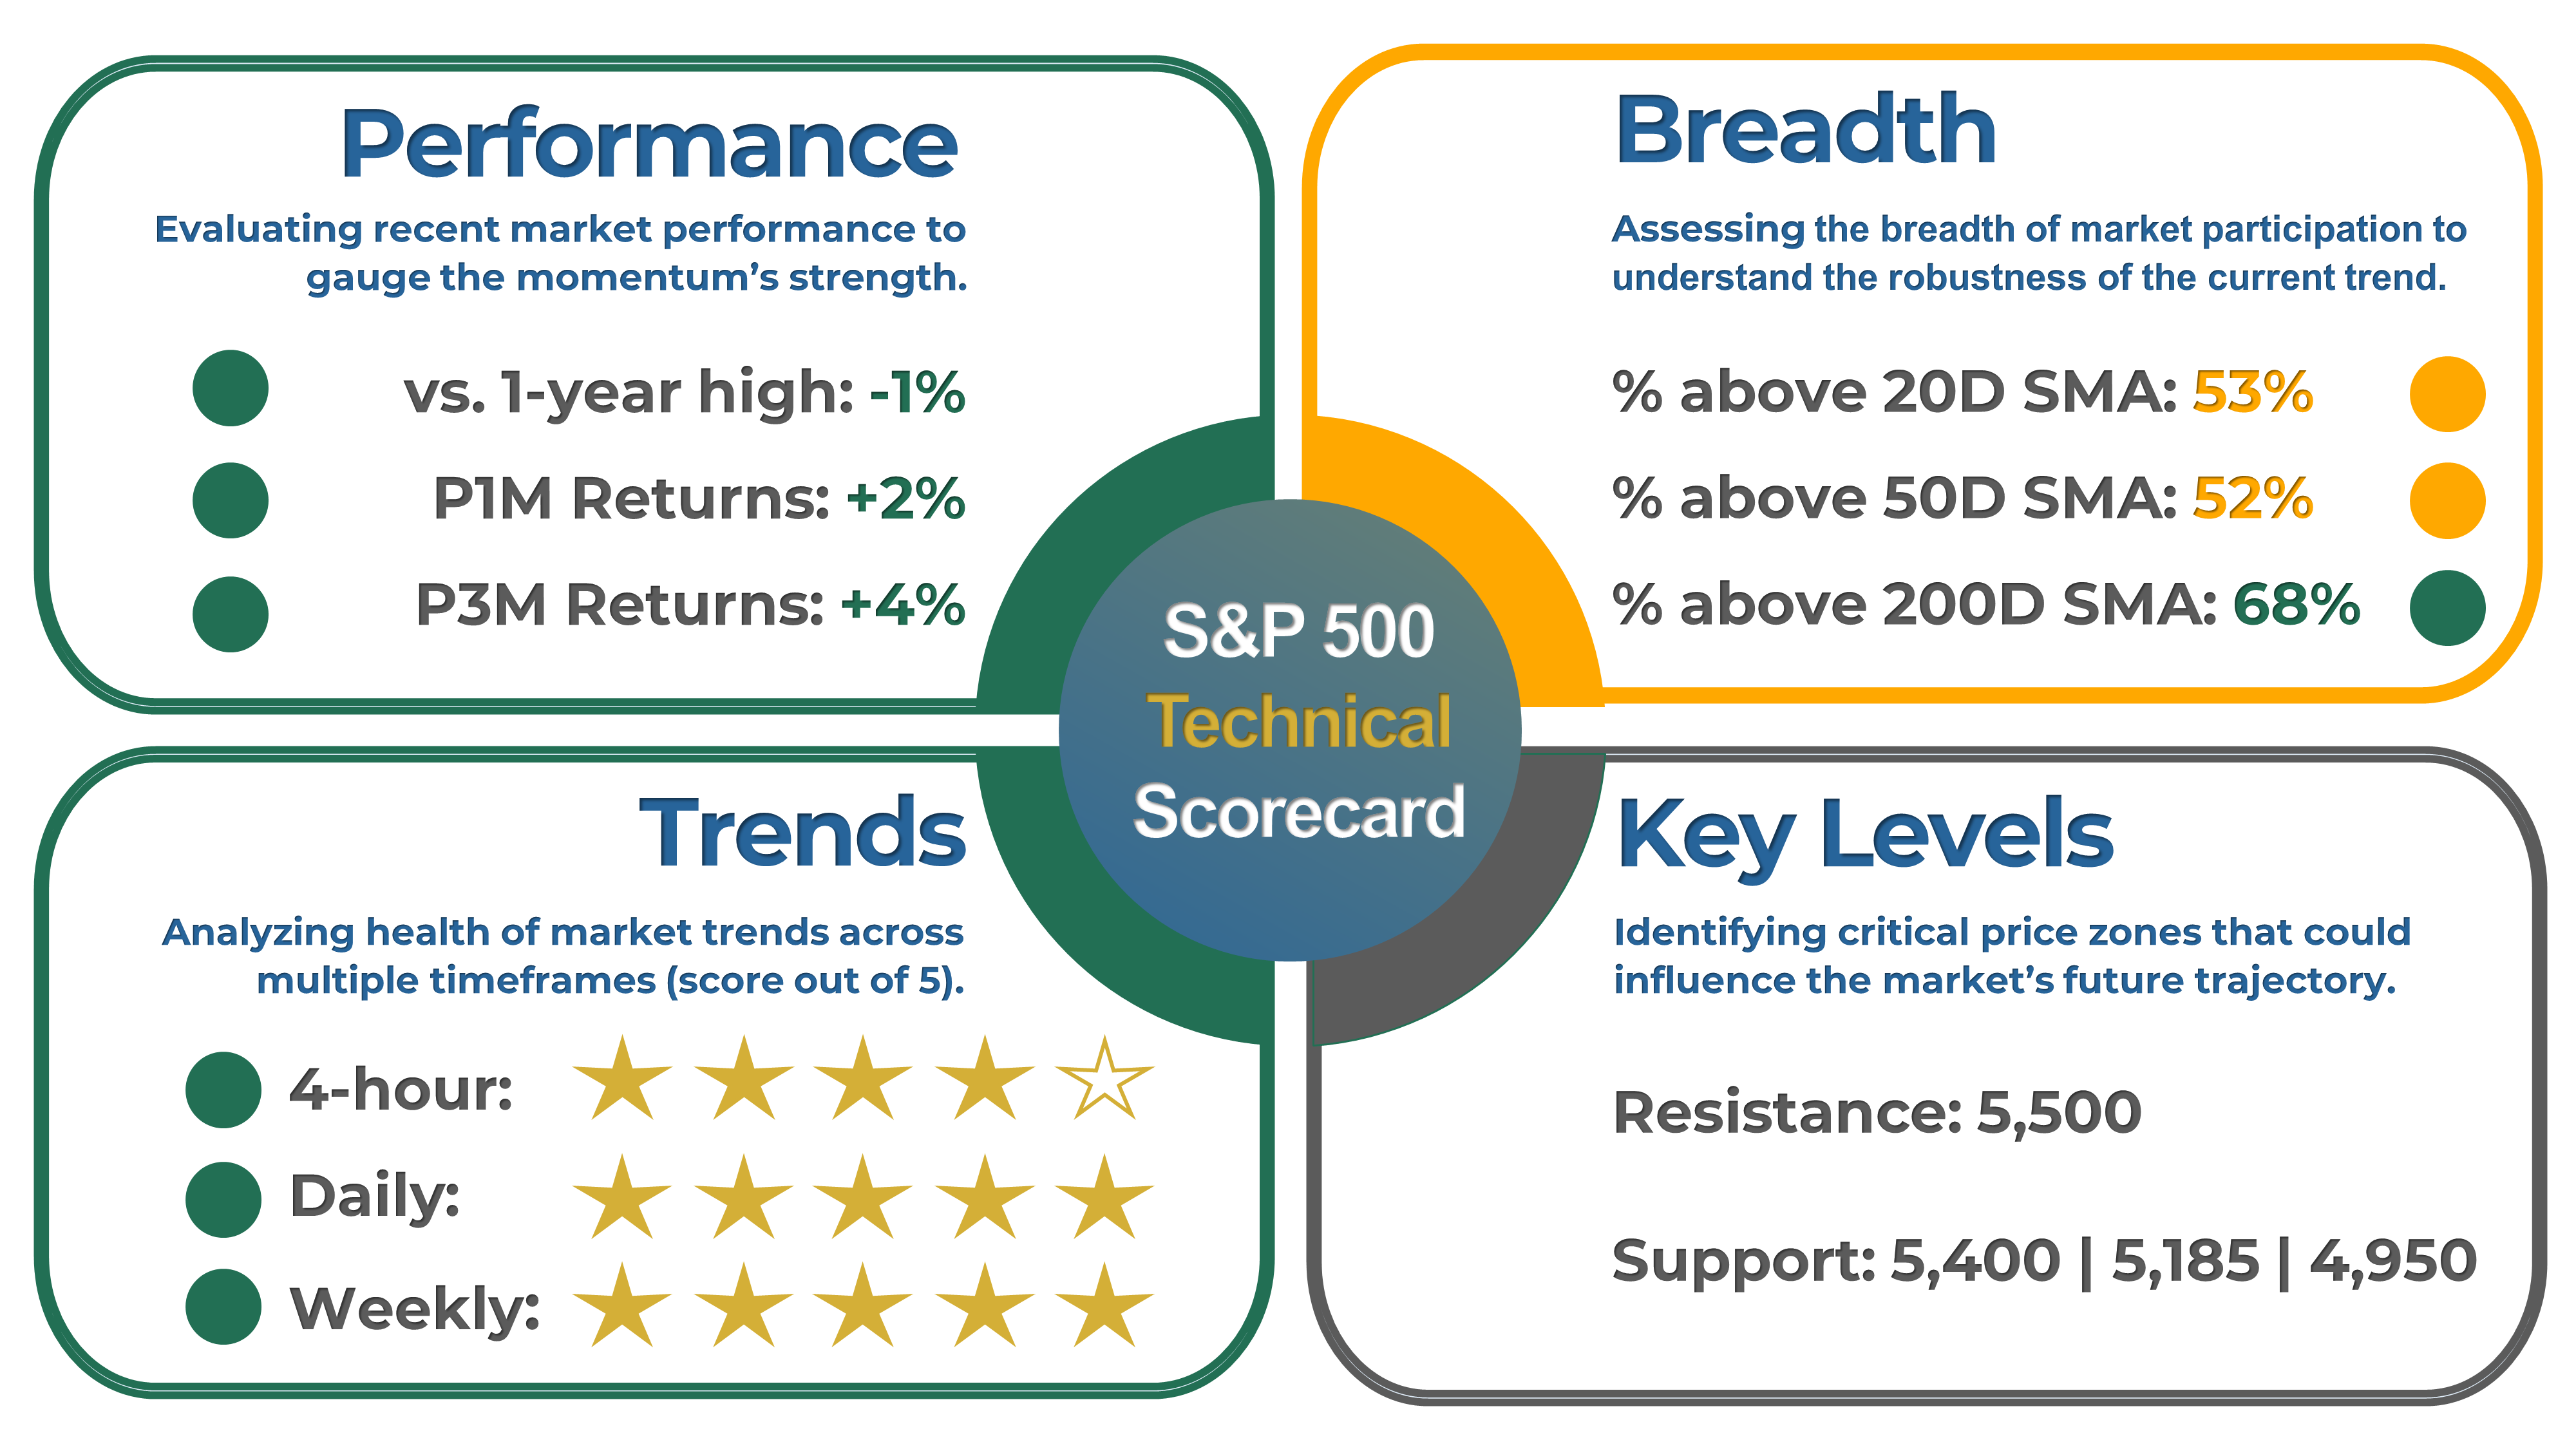
Healthy bull markets typically see the index set several new highs, broad market participation, and ascending trend lines. That's why I've created a four-part scorecard – a straightforward tool to give us a comprehensive view of these essential health indicators.
Momentum: The index is up 2% over the past month, 4% in the last three months, and is trading 1% away from its 52-week high.
Breadth: Market participation remains healthy in the long term, as 68% of S&P 500 stocks are trading above their 200-day moving average (SMA). Meanwhile, 53% of the stocks are trading above their 20-day SMA, up by 21 points compared to the previous week.
Trends: The trend on 4-hour and 1-day charts is positive, with the index trading price above key moving averages and with ascending trend lines.
Key levels: The next resistance level is 5,500. On the other hand, the next support area is at 5,400.
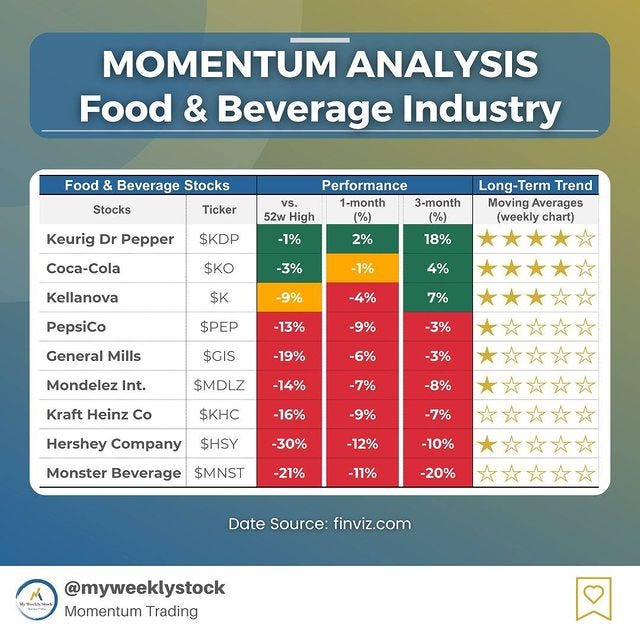
3. Momentum Analysis of the Week
This week's momentum analysis is about the trend within the Food and beverage industry. Using a combination of performance metrics and technical indicators, I've developed a proprietary algorithm to rank 9 stocks from this industry. Based on this approach, I've identified Keurig Dr Pepper (KDP) and Coca-Cola (KO) as having the best relative momentum.
EARNINGS RECAP
1. Q1 and Full Year 2024 Expected EPS & Revenue Growth
Q1 2024 earnings for the S&P 500 are expected to be up 8%. Excluding the energy sector, the figure is +11%.
Earnings are projected to grow by 11% in 2024, higher than the 9% growth seen on average over the last decade. In the past four weeks, 51% of earnings revisions made by analysts were to increase their outlook.
The forward 4-quarter P/E ratio is 21.6, higher than the average over the past five and ten years.
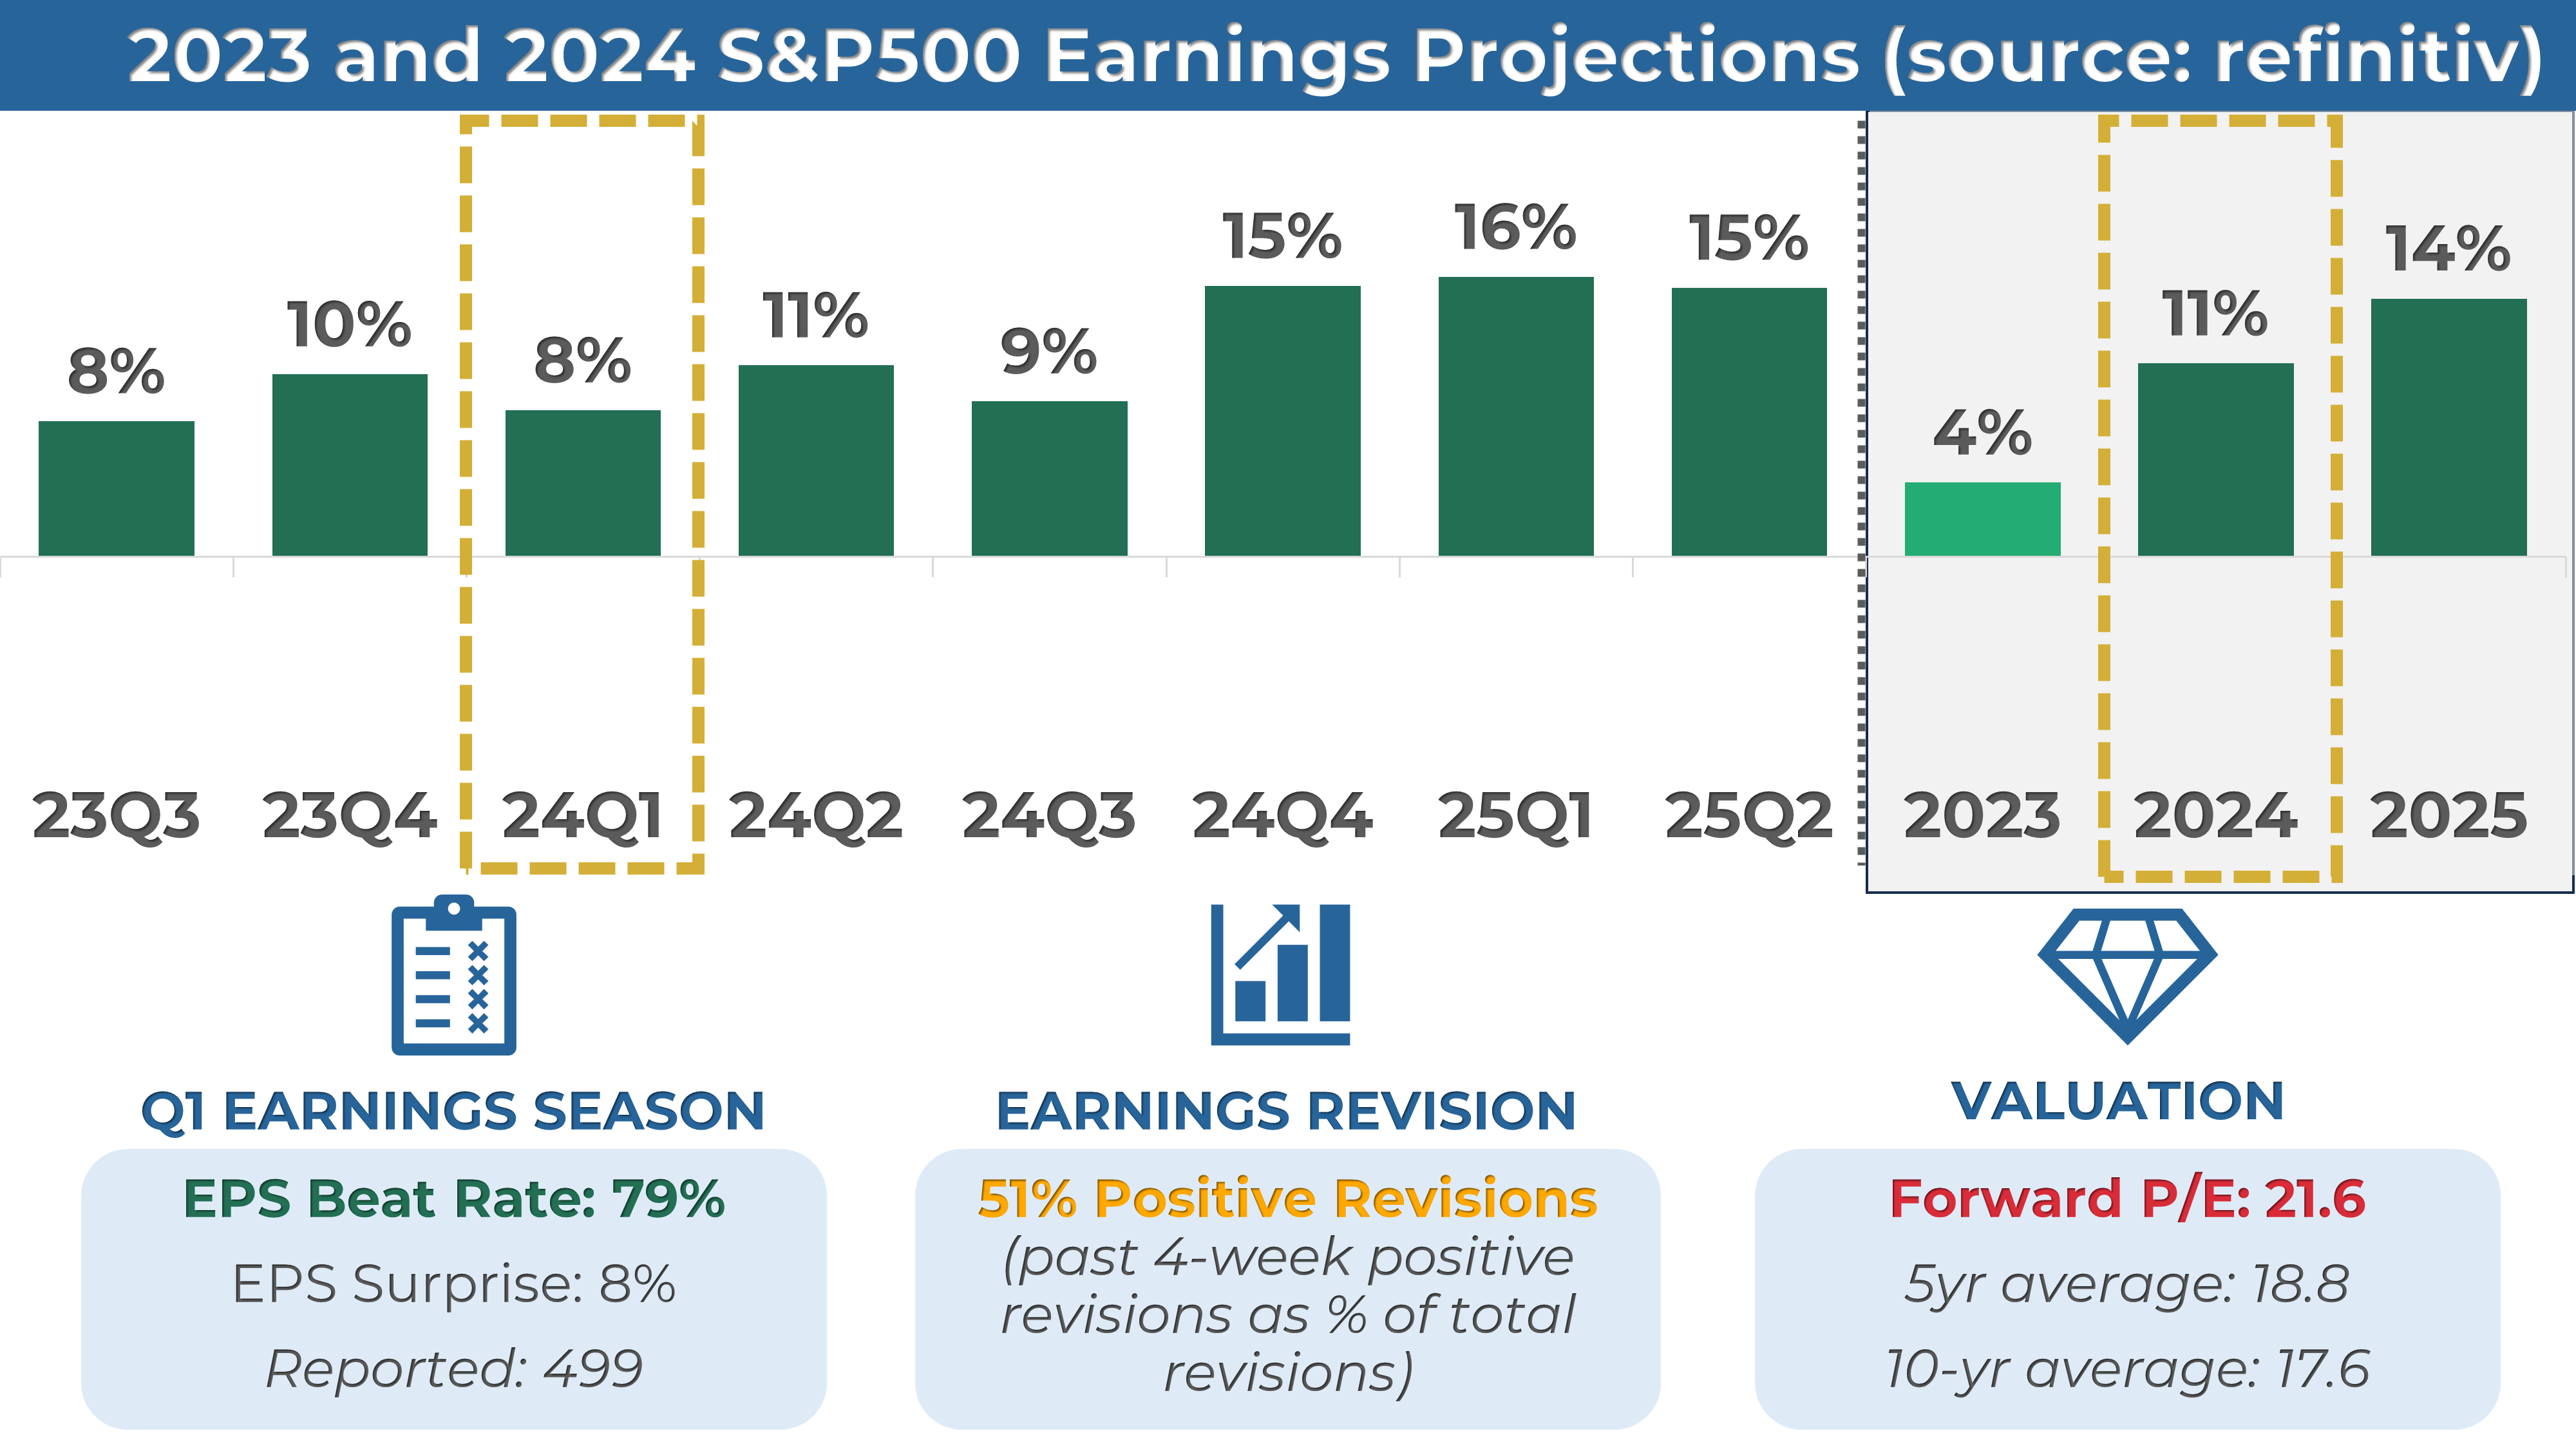
2. Q1 Earnings Season Summary
499 companies from the S&P 500 index have released their Q1 2024 earnings, with 79% posting higher EPS than expectations. This is roughly in line with the previous four-quarter average of 78% and higher than the historical average of 67%.
MARKET SENTIMENT
Measures of investor sentiment can be helpful as they provide insight into the views and opinions of professional or individual investors. However, it's important to note that these measures are not perfect predictors of market movements. They should be combined with other indicators and analysis tools for a complete market picture.
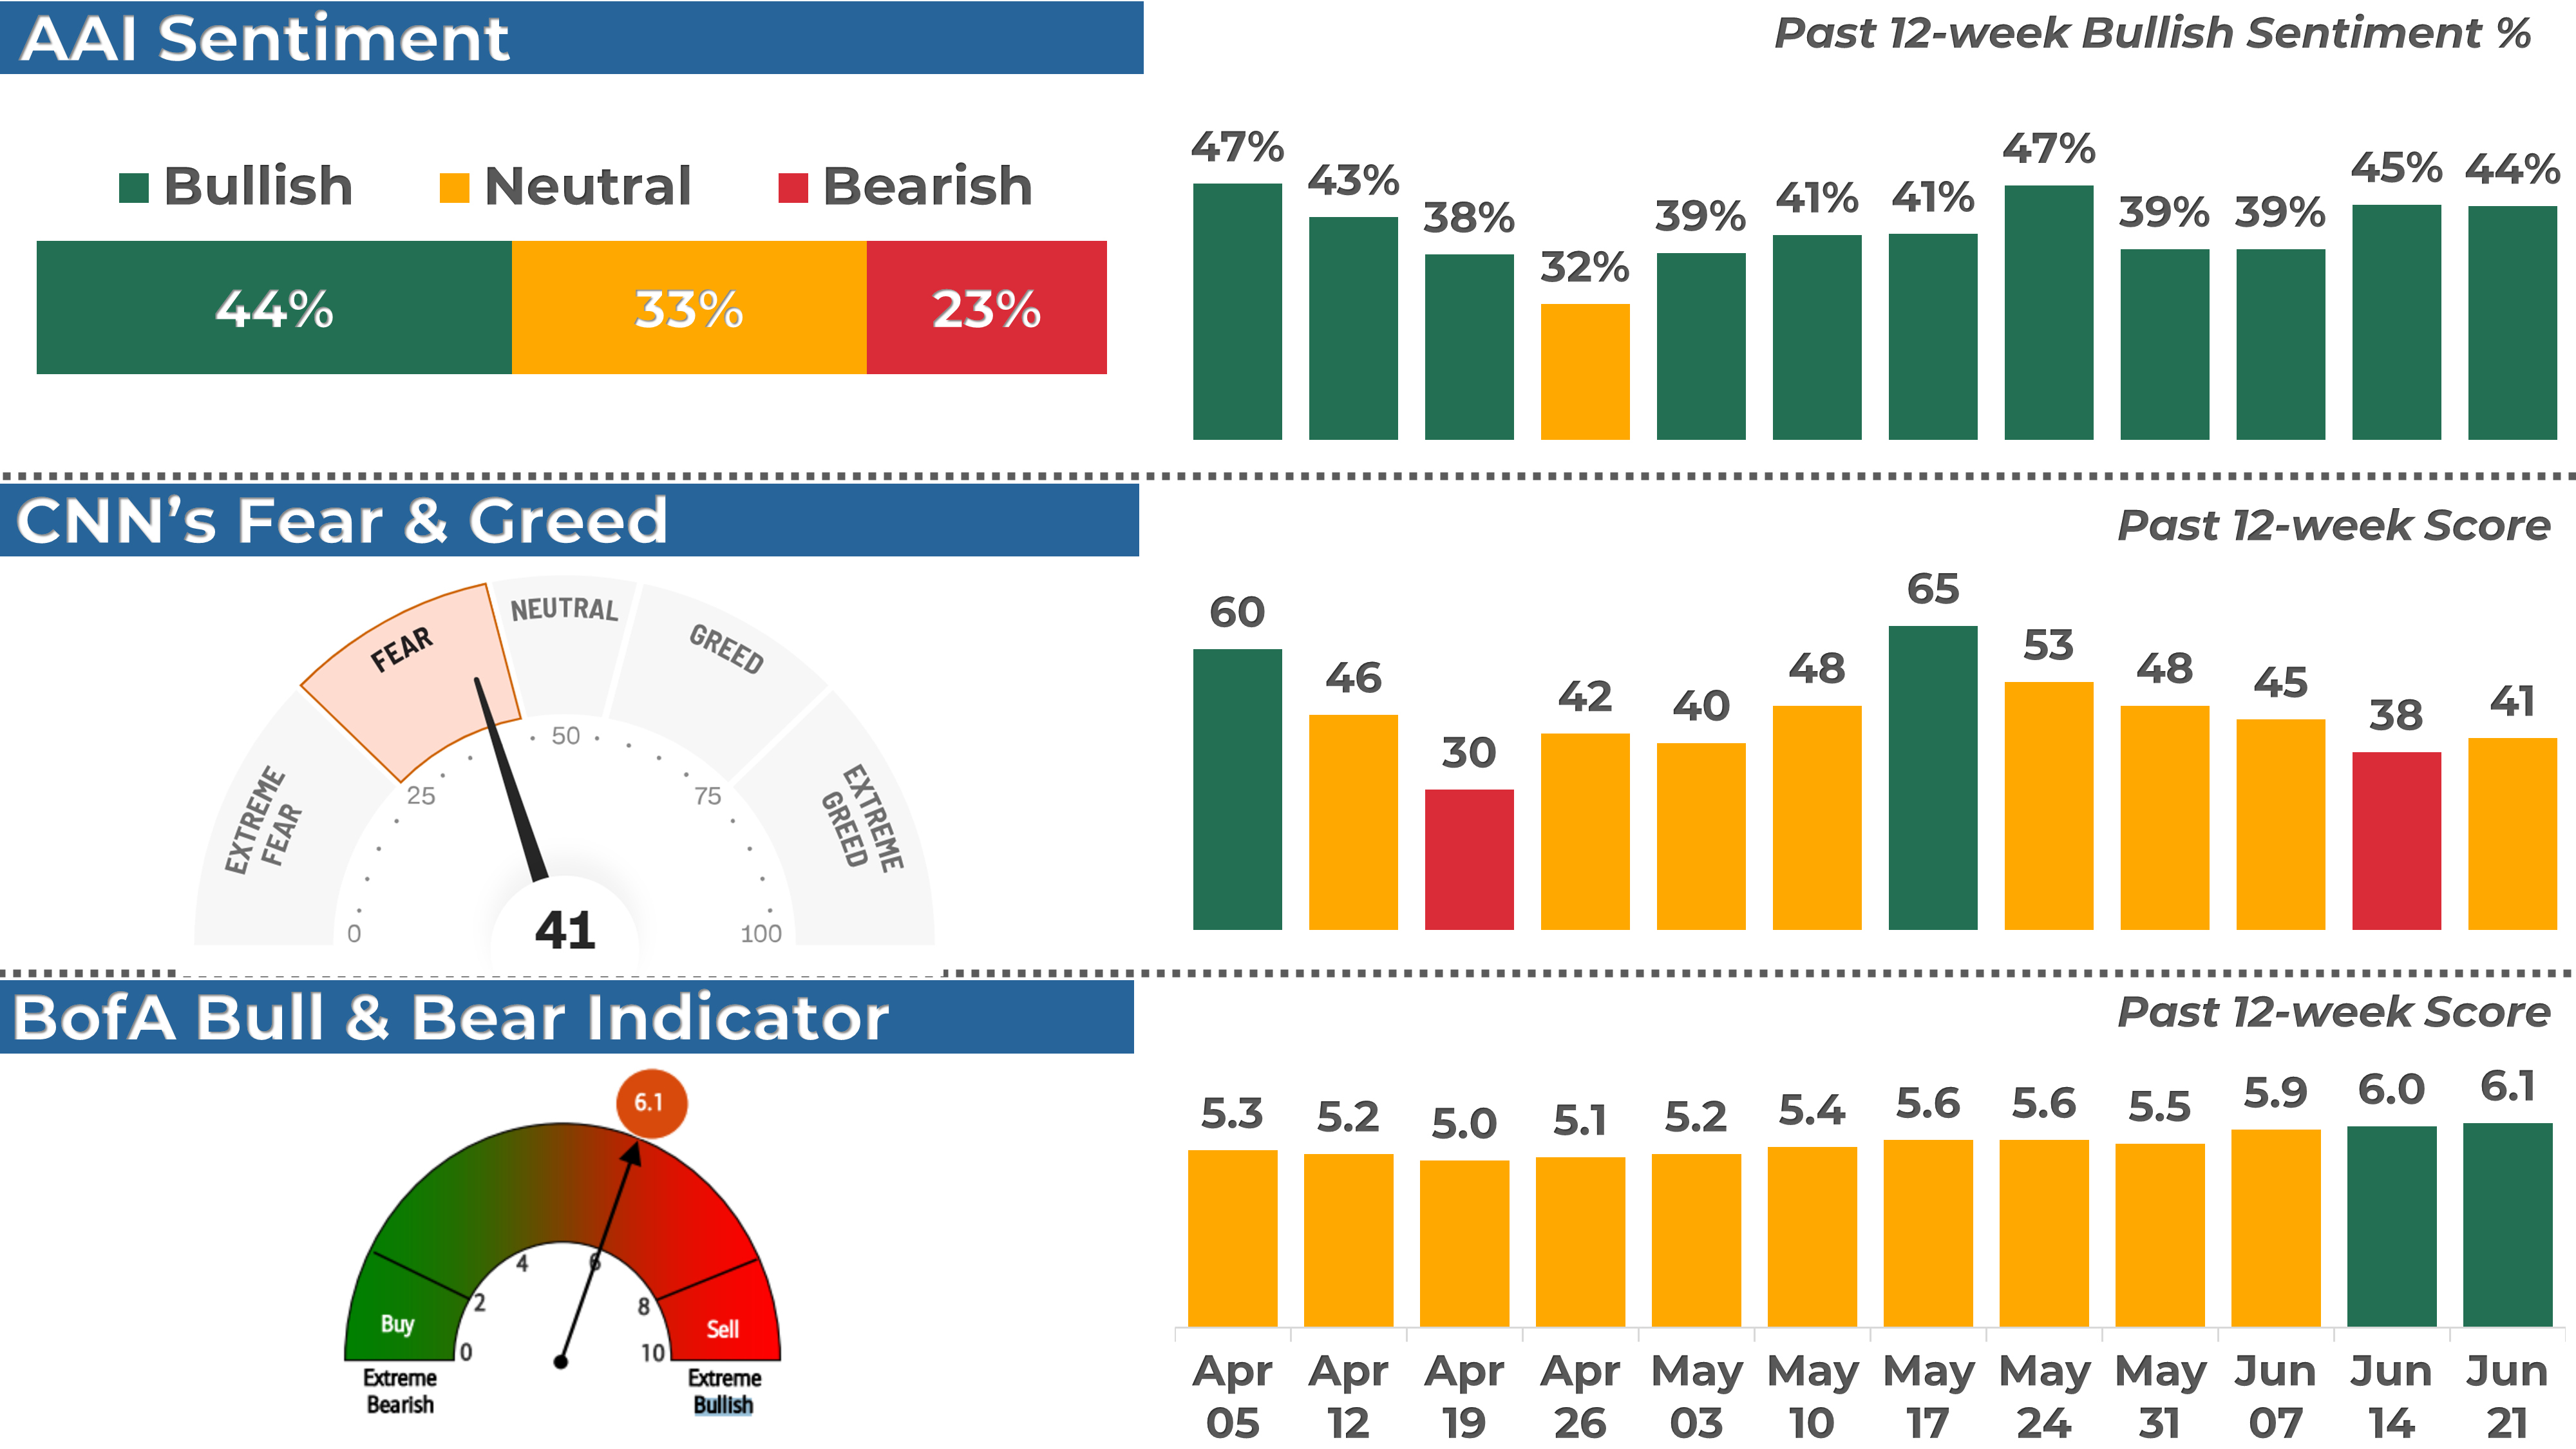
1. AAII Sentiment Survey (Individual Investors)
The American Association of Individual Investors (AAII) conducts a weekly survey among its members to gauge their expectations for the stock market over the next six months. The results are published every Wednesday.
According to the most recent AAII survey, 44% of the respondents had a bullish outlook on the stock market, decreasing by 1 point from the previous week.
2. BofA Bull & Bear Indicator (Institutional Investors)
The Bank of America Bull-Bear Indicator is a proprietary measure of investor sentiment developed by Bank of America. It is based on a survey of fund managers and institutional investors, and it tracks the percentage of respondents who are bullish, bearish, or neutral on the stock market. Results are published in the form of a score ranging from 0 (extremely bearish) to 10 (extremely bullish)
The indicator increased from 6.0 to 6.1, a slightly bullish sentiment reading.
3. CNN Fear & Greed Index (Technical)
The CNN Fear & Greed Index is a daily measure that analyzes seven market indicators to assess how emotions influence investors' decisions. The index is scored out of 100 and categorizes results into five stages: Extreme Fear, Fear, Neutral, Greed, and Extreme Greed.
The index closed at 41 or a “Fear” level, up from 38 last Friday.
THE WEEK AHEAD
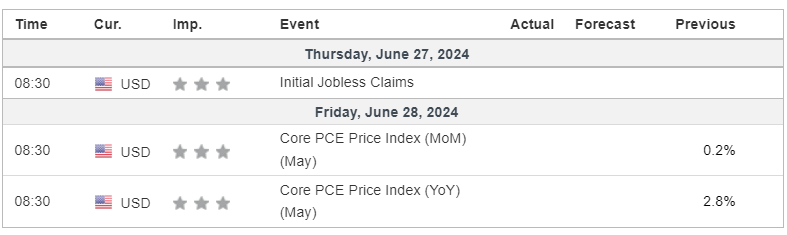
1. Economic Calendar
Next week will bring another inflation update with the Personal Consumption Expenditures (PCE) Price Index. As the Fed's favored measure of inflation, it plays a pivotal role in shaping interest rate decisions.
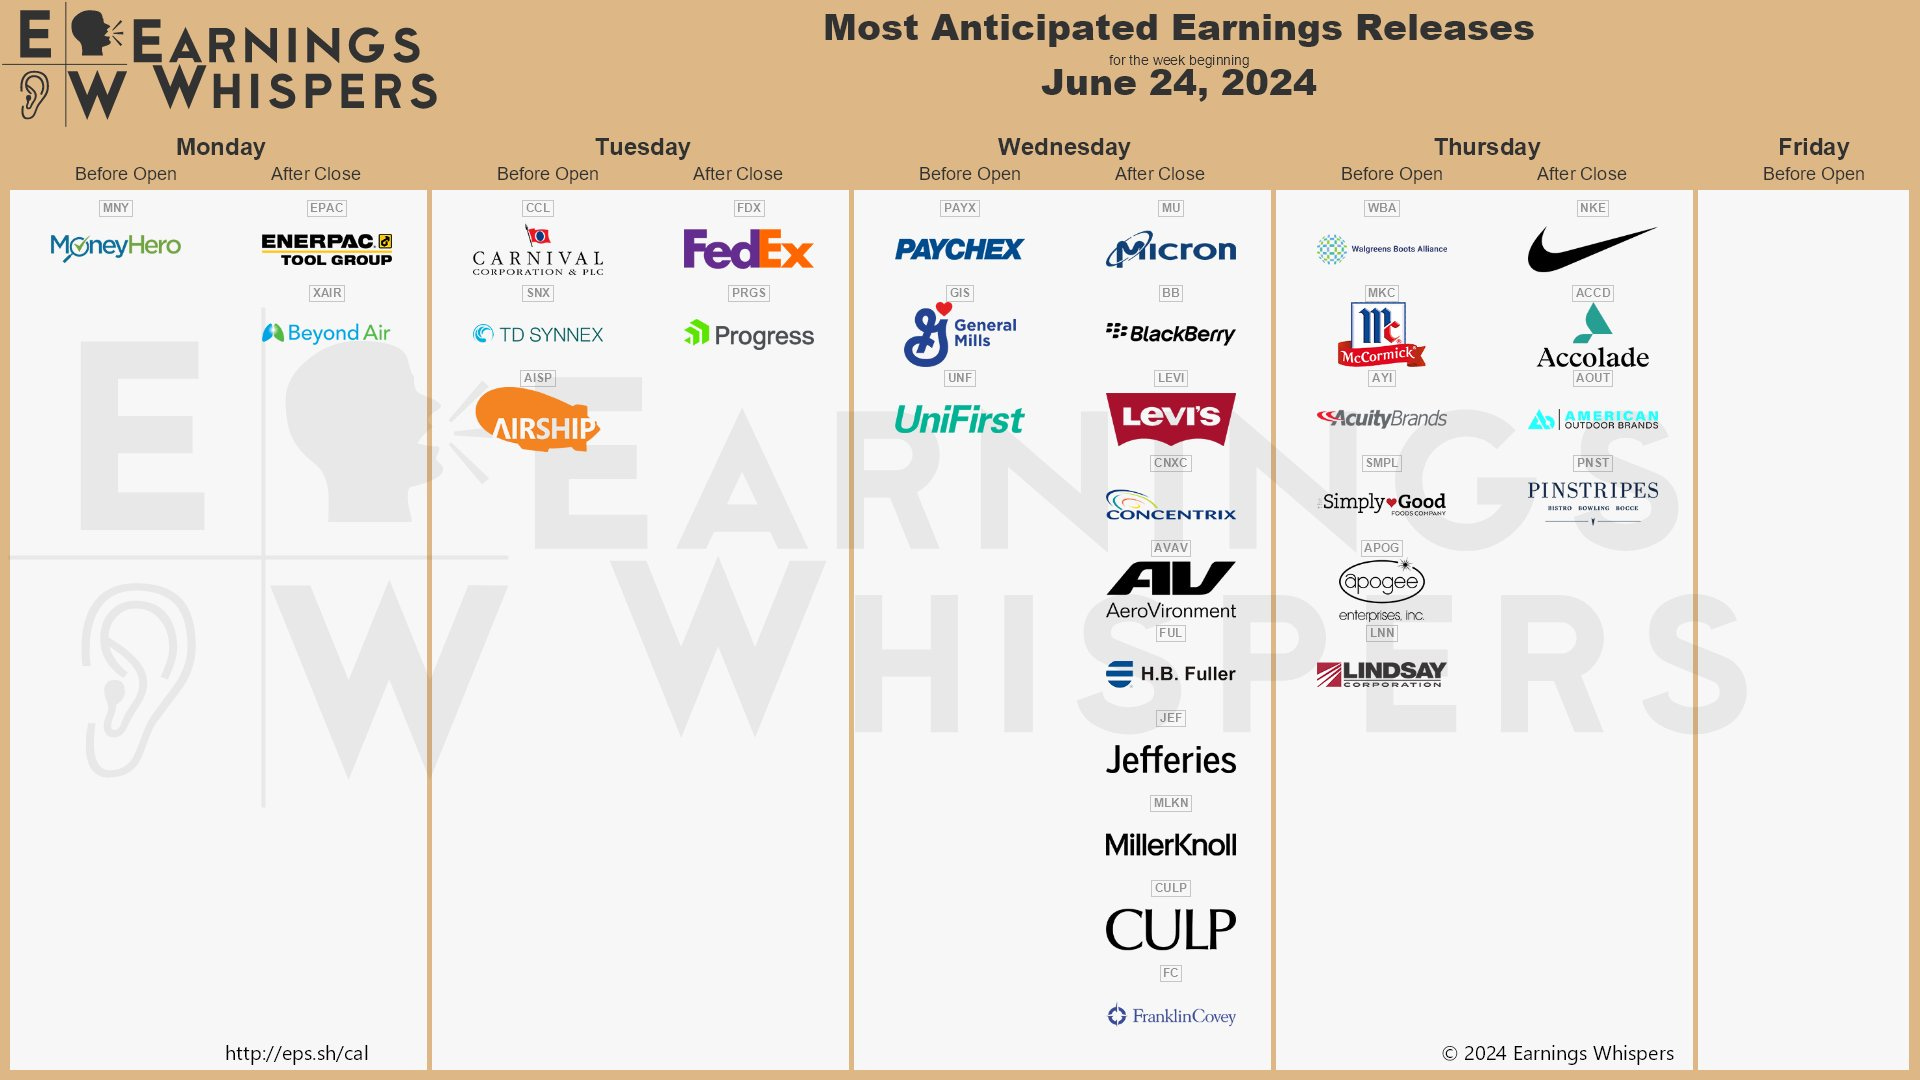
2. Earnings Calendar
Earnings season is almost over, and 9 companies from the S&P 500, including Micron and Nike, are expected to release their quarterly results.
3. Next Week’s Earnings Watchlist
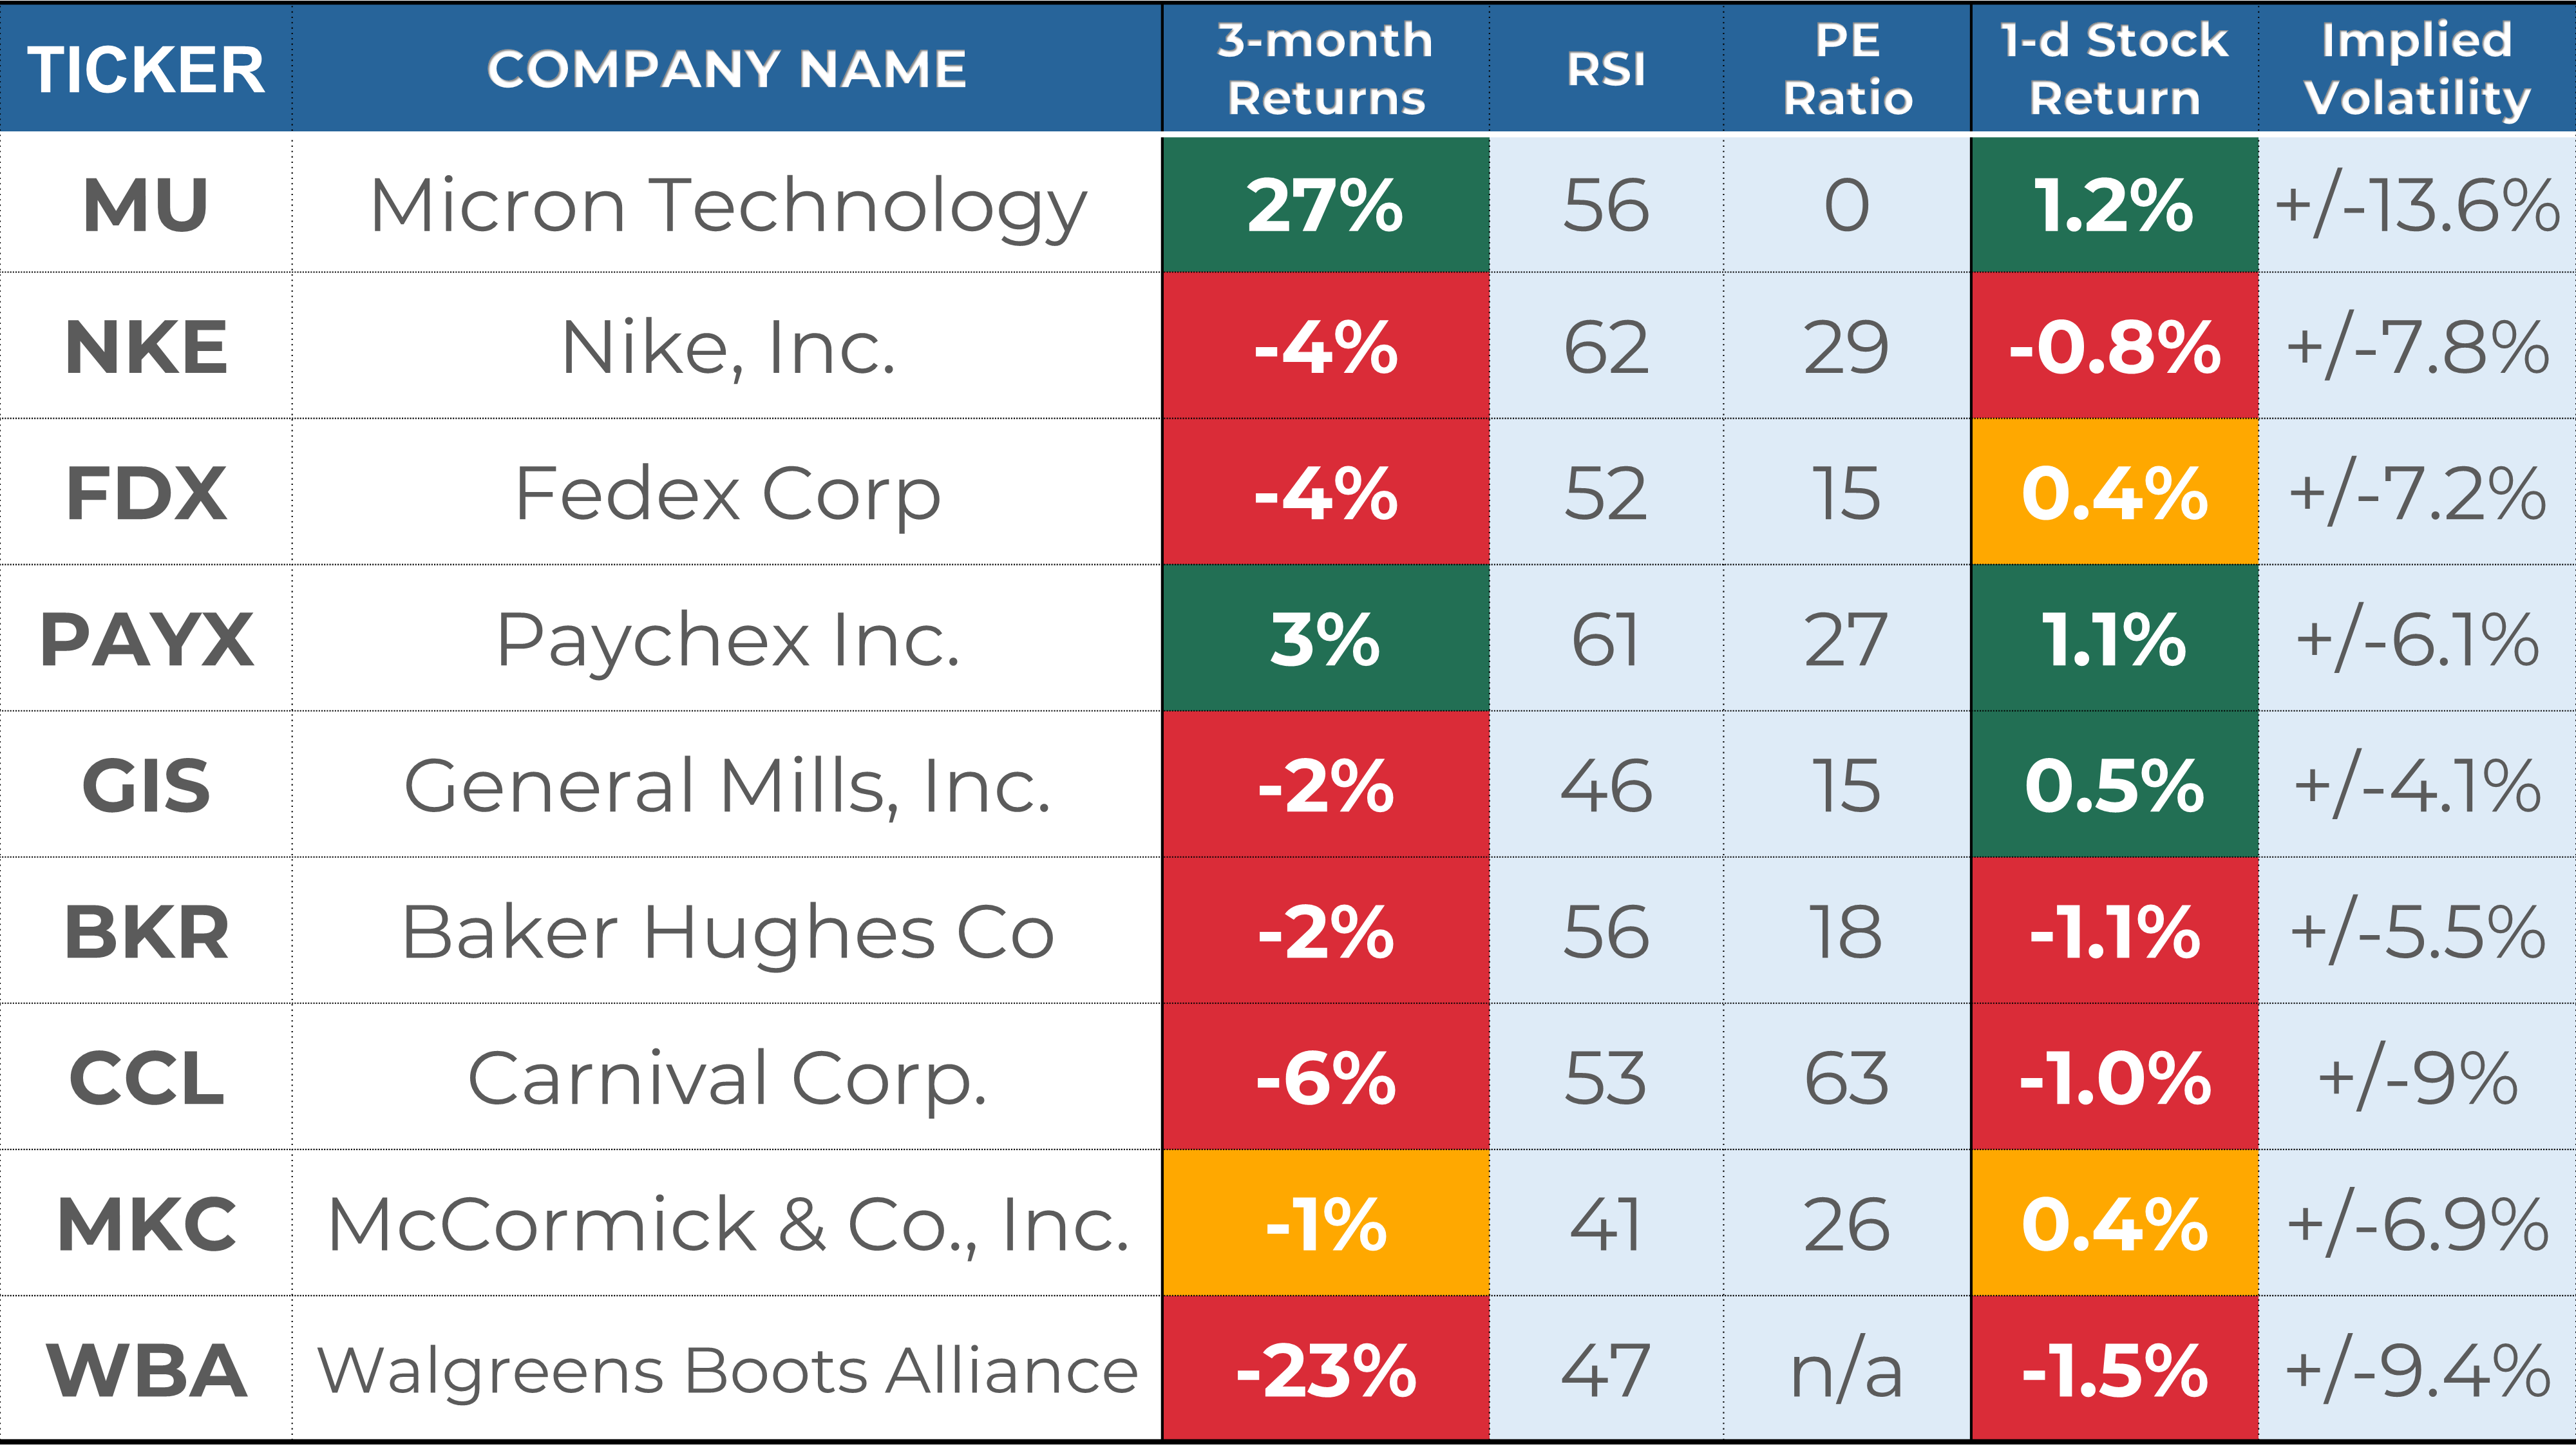
Below is my watchlist of stocks reporting week next week, along with several key indicators I like to review:
Stock Indicators:
Stock performance in the last 3 months.
RSI, where a reading of 70 indicates overbought status and a reading of 30 oversold.
PE ratio, where a reading below 25 indicates a "cheap" valuation and/or low growth expectations.
Stock Price Reactions to Earnings:
1-day Stock Return on Earnings is the stock performance on the earnings release date.
Implied volatility is the expected 1-day stock change after earnings are released, as assessed by the options markets.
Every week, I share a deep dive into 1 stock reporting earnings in the coming days. This week, I prepared an in-depth overview of Micron Technology ($MU). In this post, I break down key data points around $MU’s fundamentals, stock returns, analyst ratings, and past earnings performance to help you make informed investment decisions. Check out the post and learn why I gave a ”HOLD” rating to Micron.

That’s a wrap for this week’s recap! I hope it helped you understand the market better.
If you enjoyed this post, you should explore the premium section: I provide my short-term trading and analysis of over 20 US large caps and share my long-term investing portfolios. Upgrade your subscription to unlock all the exclusive features and insights! The first month is free!
If you have any questions or feedback, please don't hesitate to email me or comment on this post. Your support helps me create high-quality content and is greatly appreciated!
Have a great week!
My Weekly Stock
DISCLAIMER
The information provided in this newsletter is for informational purposes only and should not be taken as financial advice. Any investments or decisions made based on the information provided in this newsletter are the reader's sole responsibility. We recommend that readers conduct their own research and consult a qualified financial professional before making investment decisions. The author does not assume any responsibility for any losses or damages arising from using the information provided in this newsletter.
Hey – the MU link seems not to work… or is it just me?
I feel positive, I think we can expect another green week! Thanks for sharing your thorough analysis!