

Weekly Market Recap (Jun 24-28): S&P 500's Dance Around 5,500 Continues.
Weekly Market Recap (Jun 24-28): S&P 500's Dance Around 5,500 Continues.
Everything you need to know about last week's markets performance and what to expect next.
Dear subscribers,
Welcome to My Weekly Stock, where we blend in-depth market analysis with proven momentum-based trading strategies. My mission? Help you navigate the financial markets with unbiased, data-driven insights you can act on!
Every week, I spend hours curating this market recap, producing insightful analyses with clear visuals and a structured layout so you can easily find what you need, week after week. And because it's easy to get swayed by personal bias, I like to let the data do most of the talking.
To celebrate the first six months of the premium section of My Weekly Stock, you can get your annual subscription at a 30% discount. This offer is valid until the end of July, so don’t miss out!
Let’s get started!
SUMMARY
Here are this week's highlights and what to look out for next:
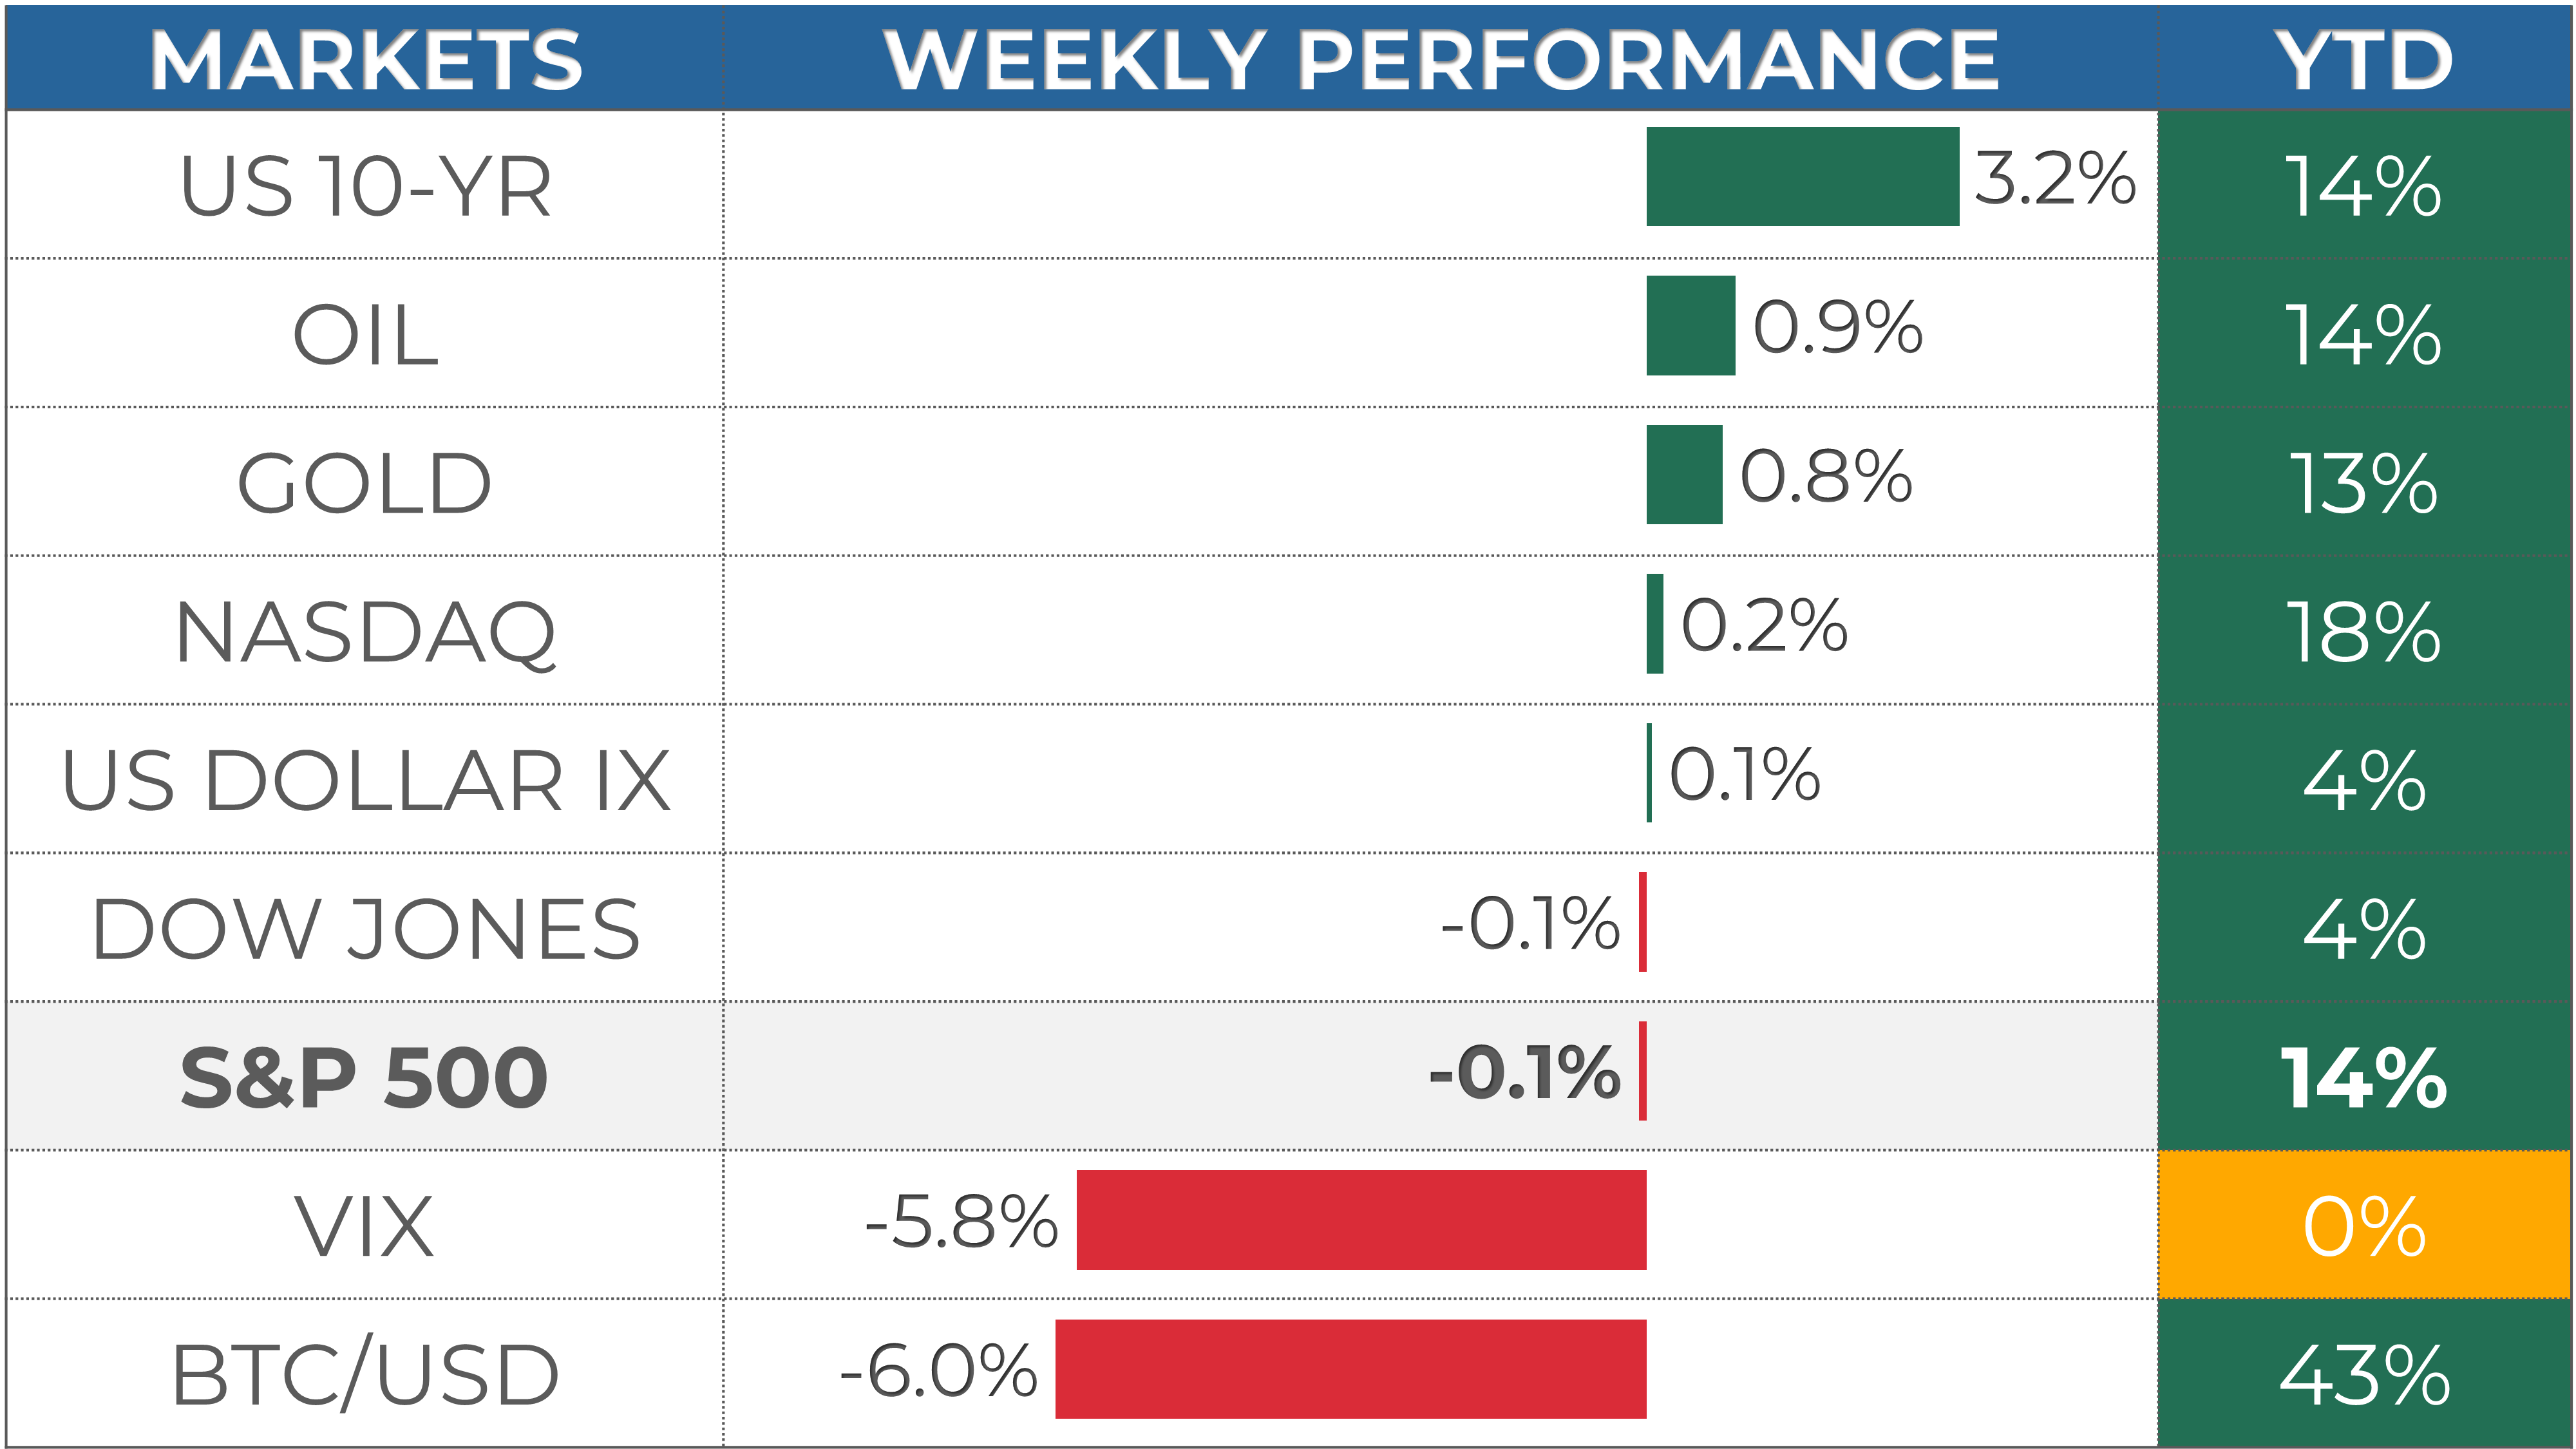
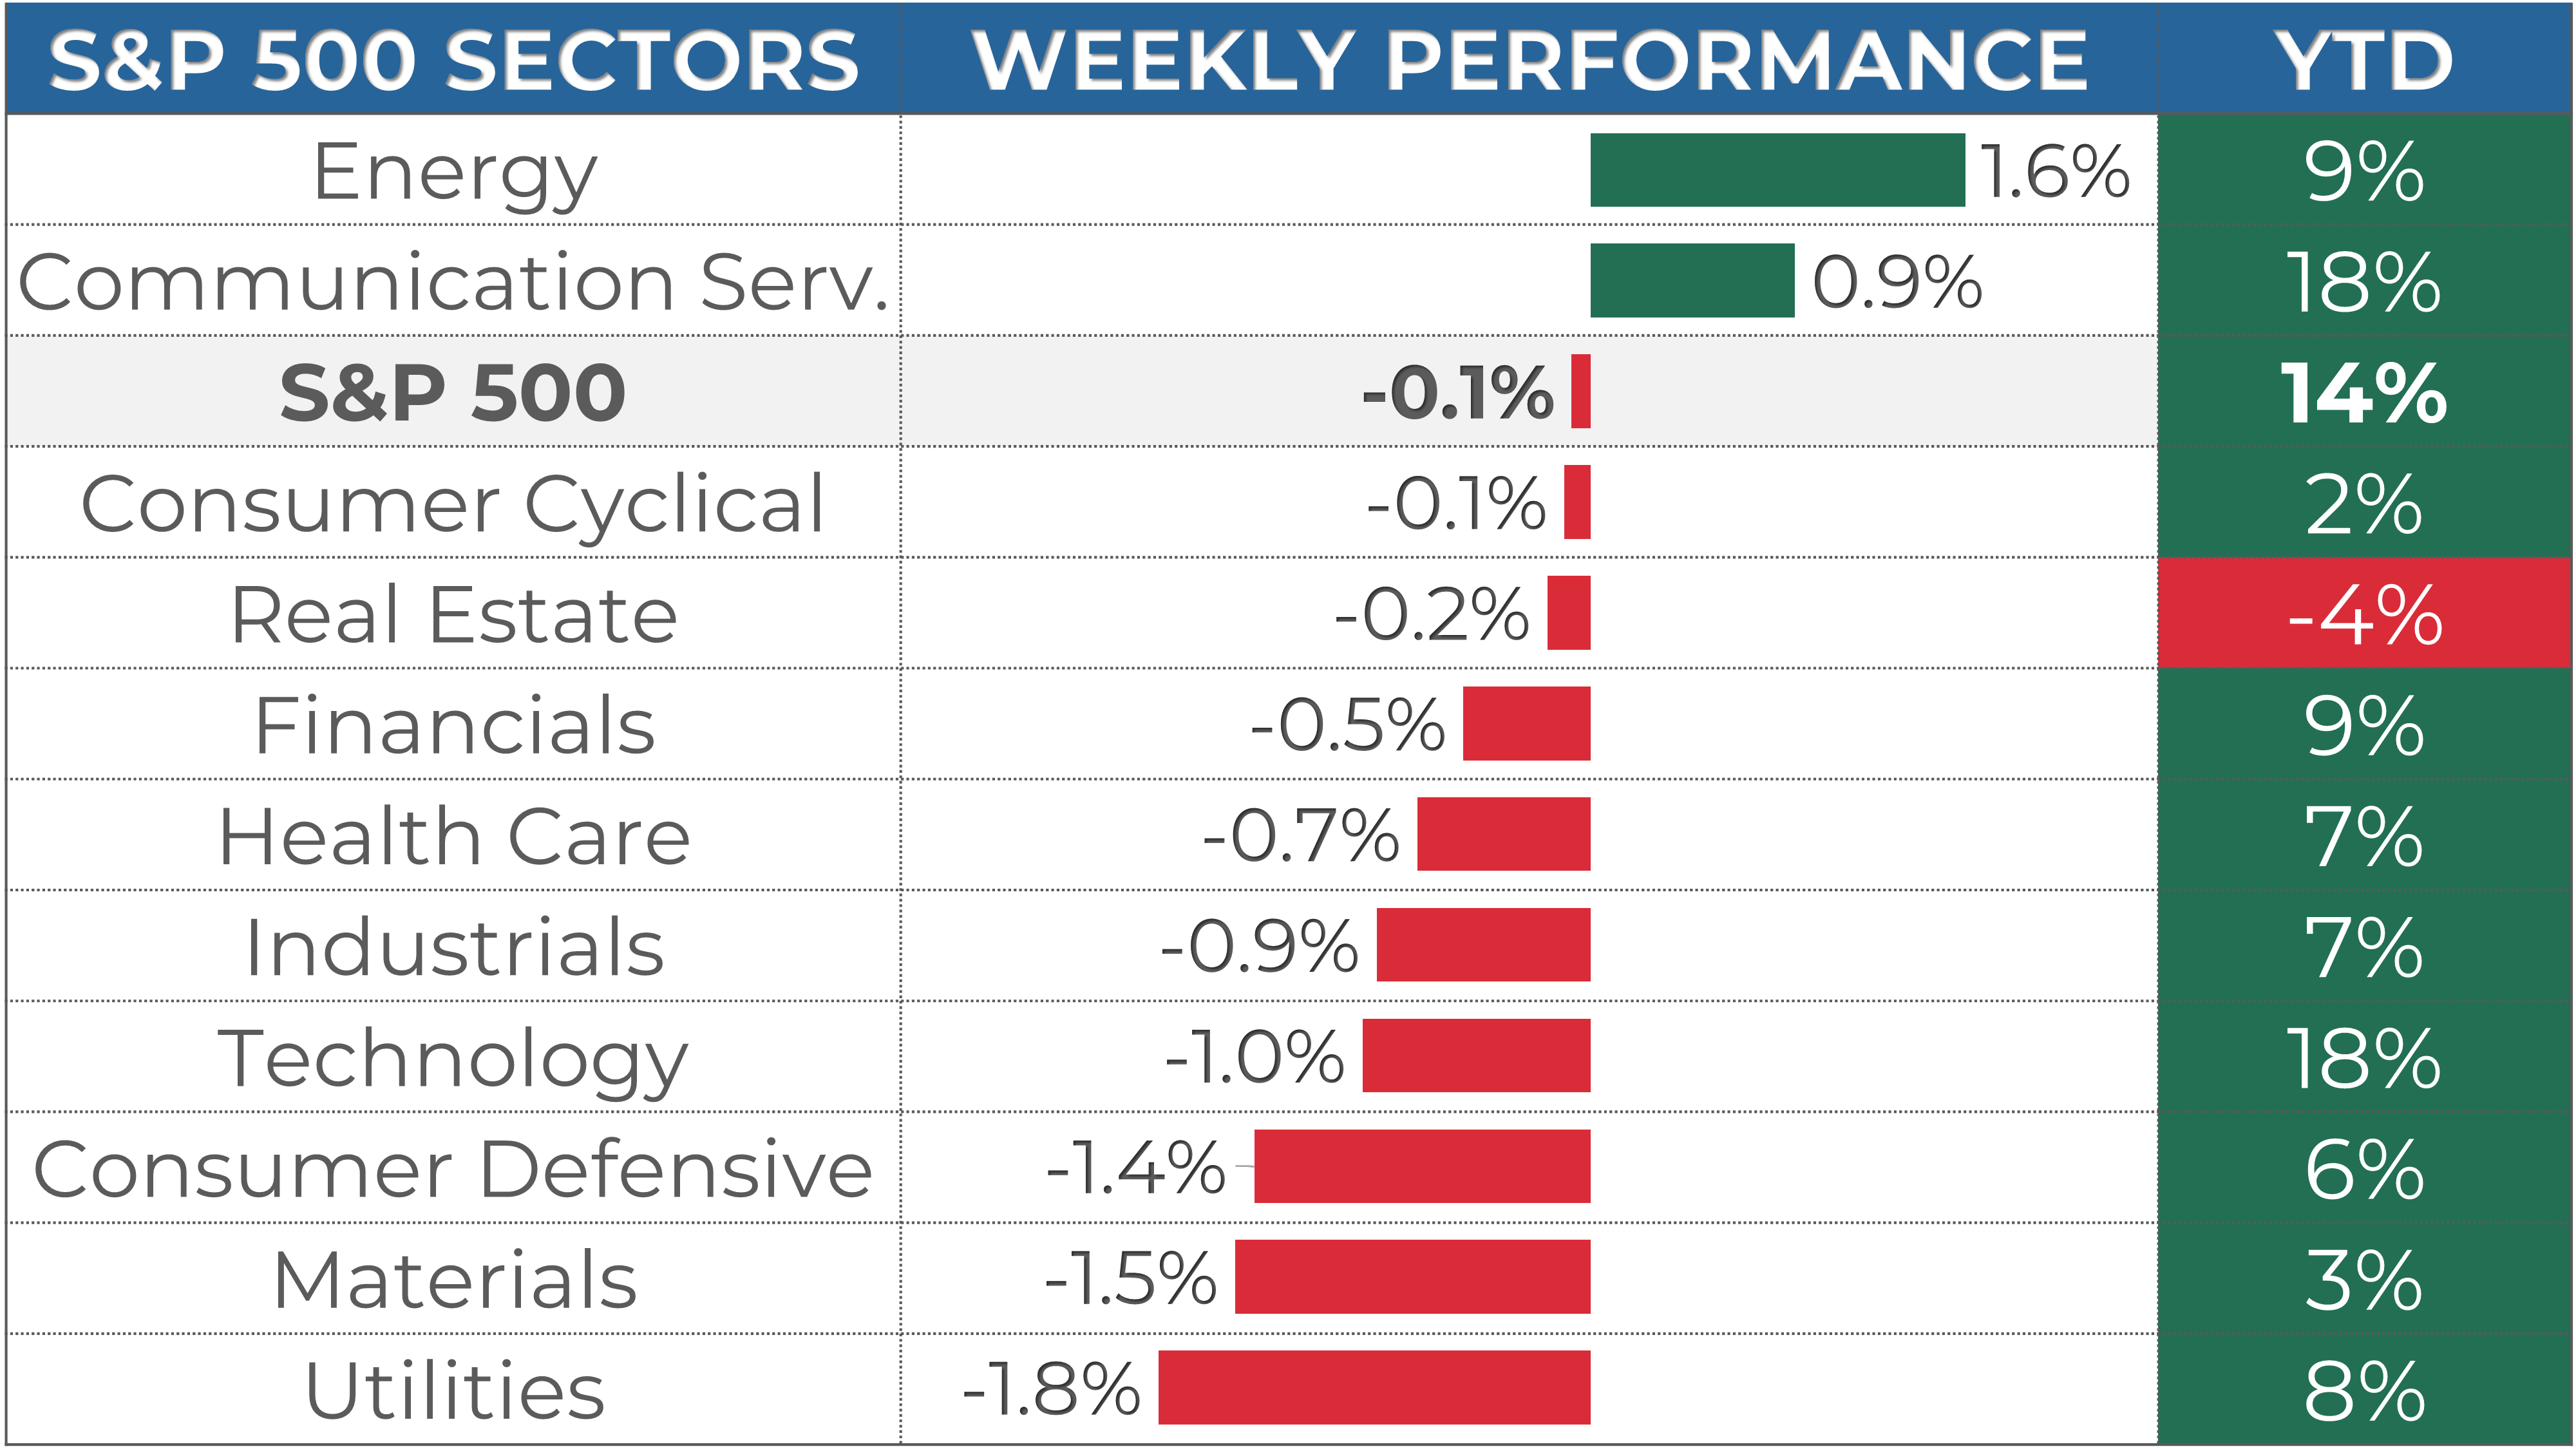
1. The markets were mixed for the week, with the S&P 500 down -0.1%, the Nasdaq up 0.2%, and the Dow Jones down -0.1%.. Energy (+1.6%) and Communication Serv. (+0.9%) were the best-performing sectors.
2. The S&P 500's long-term trend is positive. 5,500 is the next resistance, while 5,400 is support.
3. The earnings season is almost over, and 499 the companies from the S&P 500 index have released their Q1 results, with 79% beating estimates. Earnings are expected to be up 8% in Q1 2024 and 11% in 2024.
4. Market sentiment is at the "Fear" level (44) as measured by CNN’s Fear & Greed indicator, while VIX is at a low value of 12.
5. The Non-Farm Payroll report and last Fed meeting’s minutes are scheduled for next week.
My take:
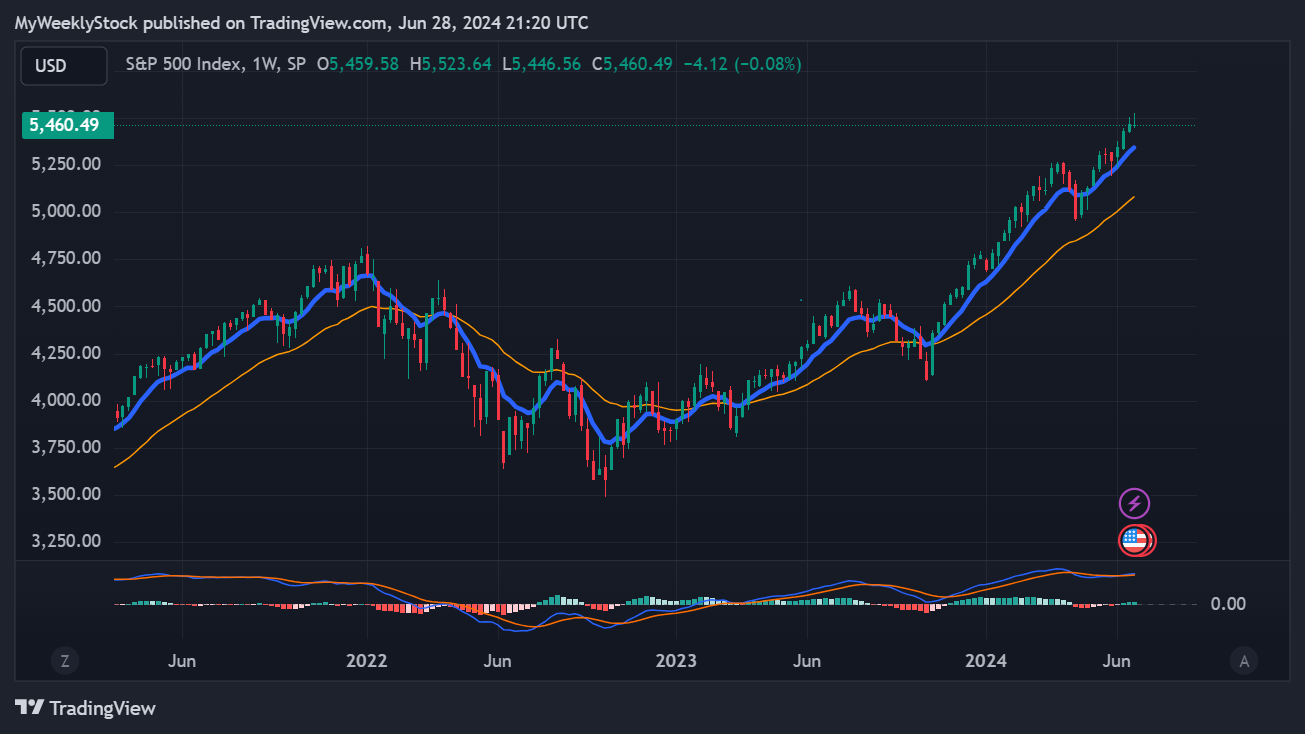
The S&P 500 oscillated within a tight 40-point range throughout the week before attempting a breakout on Friday. However, just like last week, the 5,500 level proved quite the barrier, and the index couldn't sustain its gains.
There's no cause for concern yet, as pullbacks have been mild and quickly bought up. Since the end of April's pullback, the index has consistently stayed above its 21-day exponential moving average—a critical short-term trend line—and has remained above support levels. A break below these would be the first sign of a downturn being in the works. Until then, I will continue to give the bulls the benefit of the doubt.
PERFORMANCE RECAP
1. S&P 500 Sector Performance
Over the week, 2 of the 11 S&P 500 sectors have achieved gains. Energy led the way, rising by 1.6%. By contrast, Utilities was the weakest, falling by -1.8%.
Year-to-date, 10 of the sectors have seen positive results. Technology has been the most successful sector, with a 18% gain. On the other hand, Real Estate has been trailing behind.
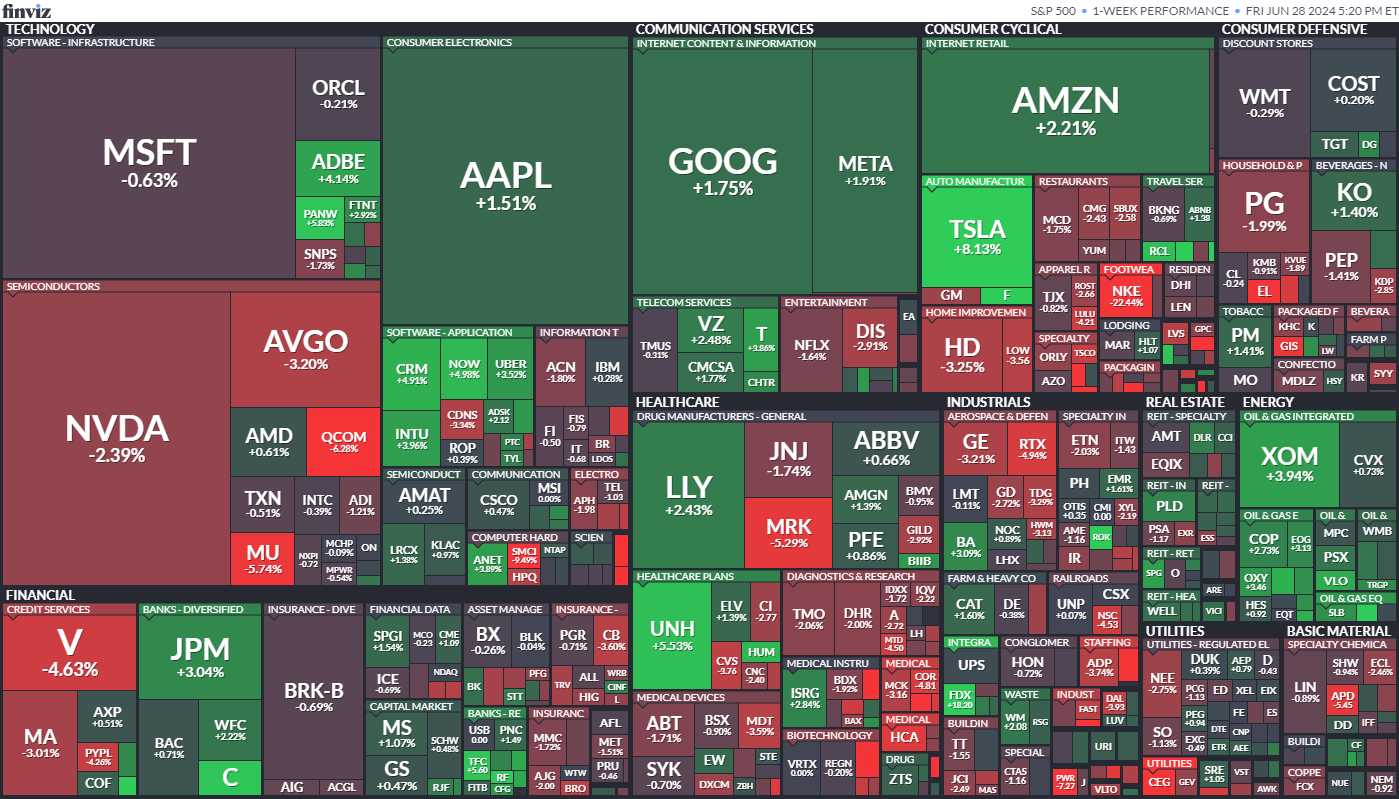
2. S&P 500 Top & Worst Performers
In the last 5 trading days, 44% of the stocks in the S&P 500 index rose in value.
The best-performing stocks were:
Fedex Corp (FDX, 18%)
Carnival Corp. (CCL, 16%)
Norwegian Cruise Line Holdings Ltd (NCLH, 9%)
Meanwhile, the worst-performing stocks were:
Walgreens Boots Alliance Inc (WBA, -24%)
Nike, Inc. (NKE, -22%)
First Solar Inc (FSLR, -13%)
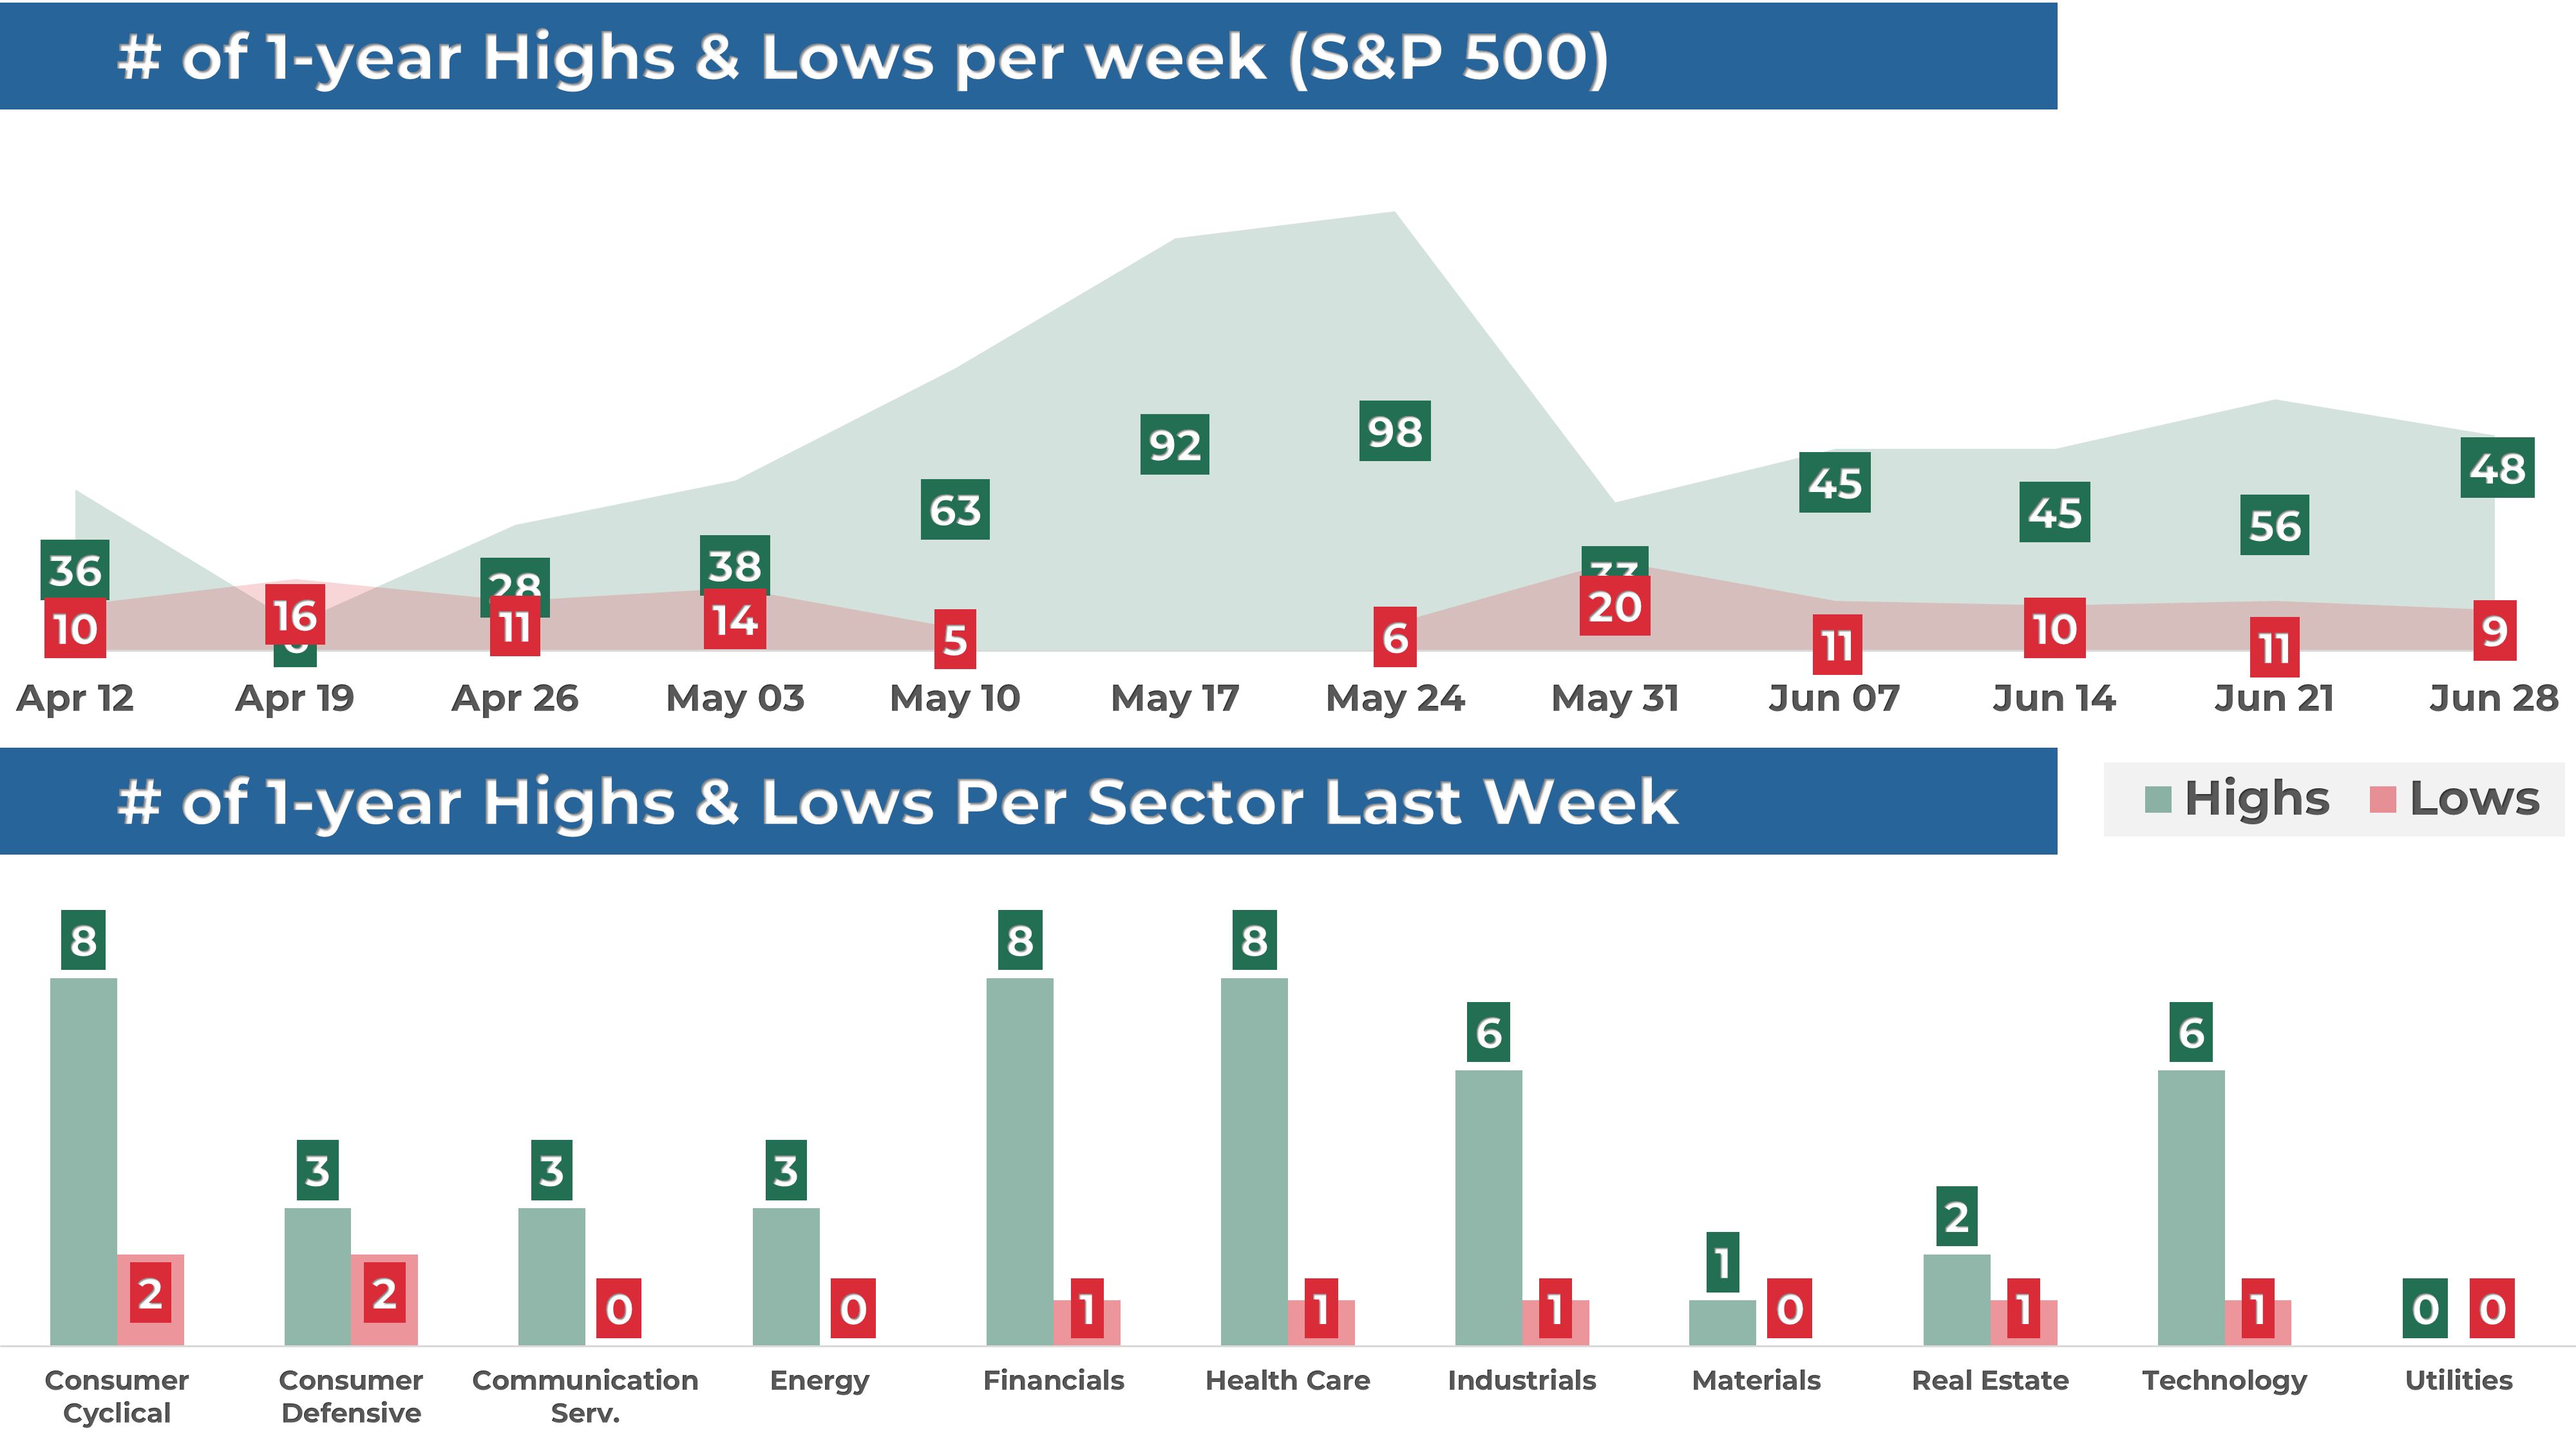
In addition, 48 stocks within the S&P 500 reached a new 52-week high, while 9 set new lows, indicating that the momentum is on the upside. Most of the highs this week came from the Technology sector.
MARKET TRENDS & MOMENTUM
1. S&P 500 Long-Term Trend
The long-term trend for the S&P 500 is positive. I base this evaluation on the 9 and 30-week exponential moving averages (EMAs). To determine if the trend is strongly positive, I look for the following conditions (the 1st is the most important):
9-week EMA is above the 30-week EMA: 🟢
Price is trading above the 9-week EMA: 🟢
Price is trading above the 30-week EMA: 🟢
The 9-week EMA trend line is rising: 🟢
The 30-week EMA trend line is rising: 🟢
I also use the MACD as an additional tool to detect trend changes. The MACD is currently neutral.
2. S&P 500 Technical Analysis
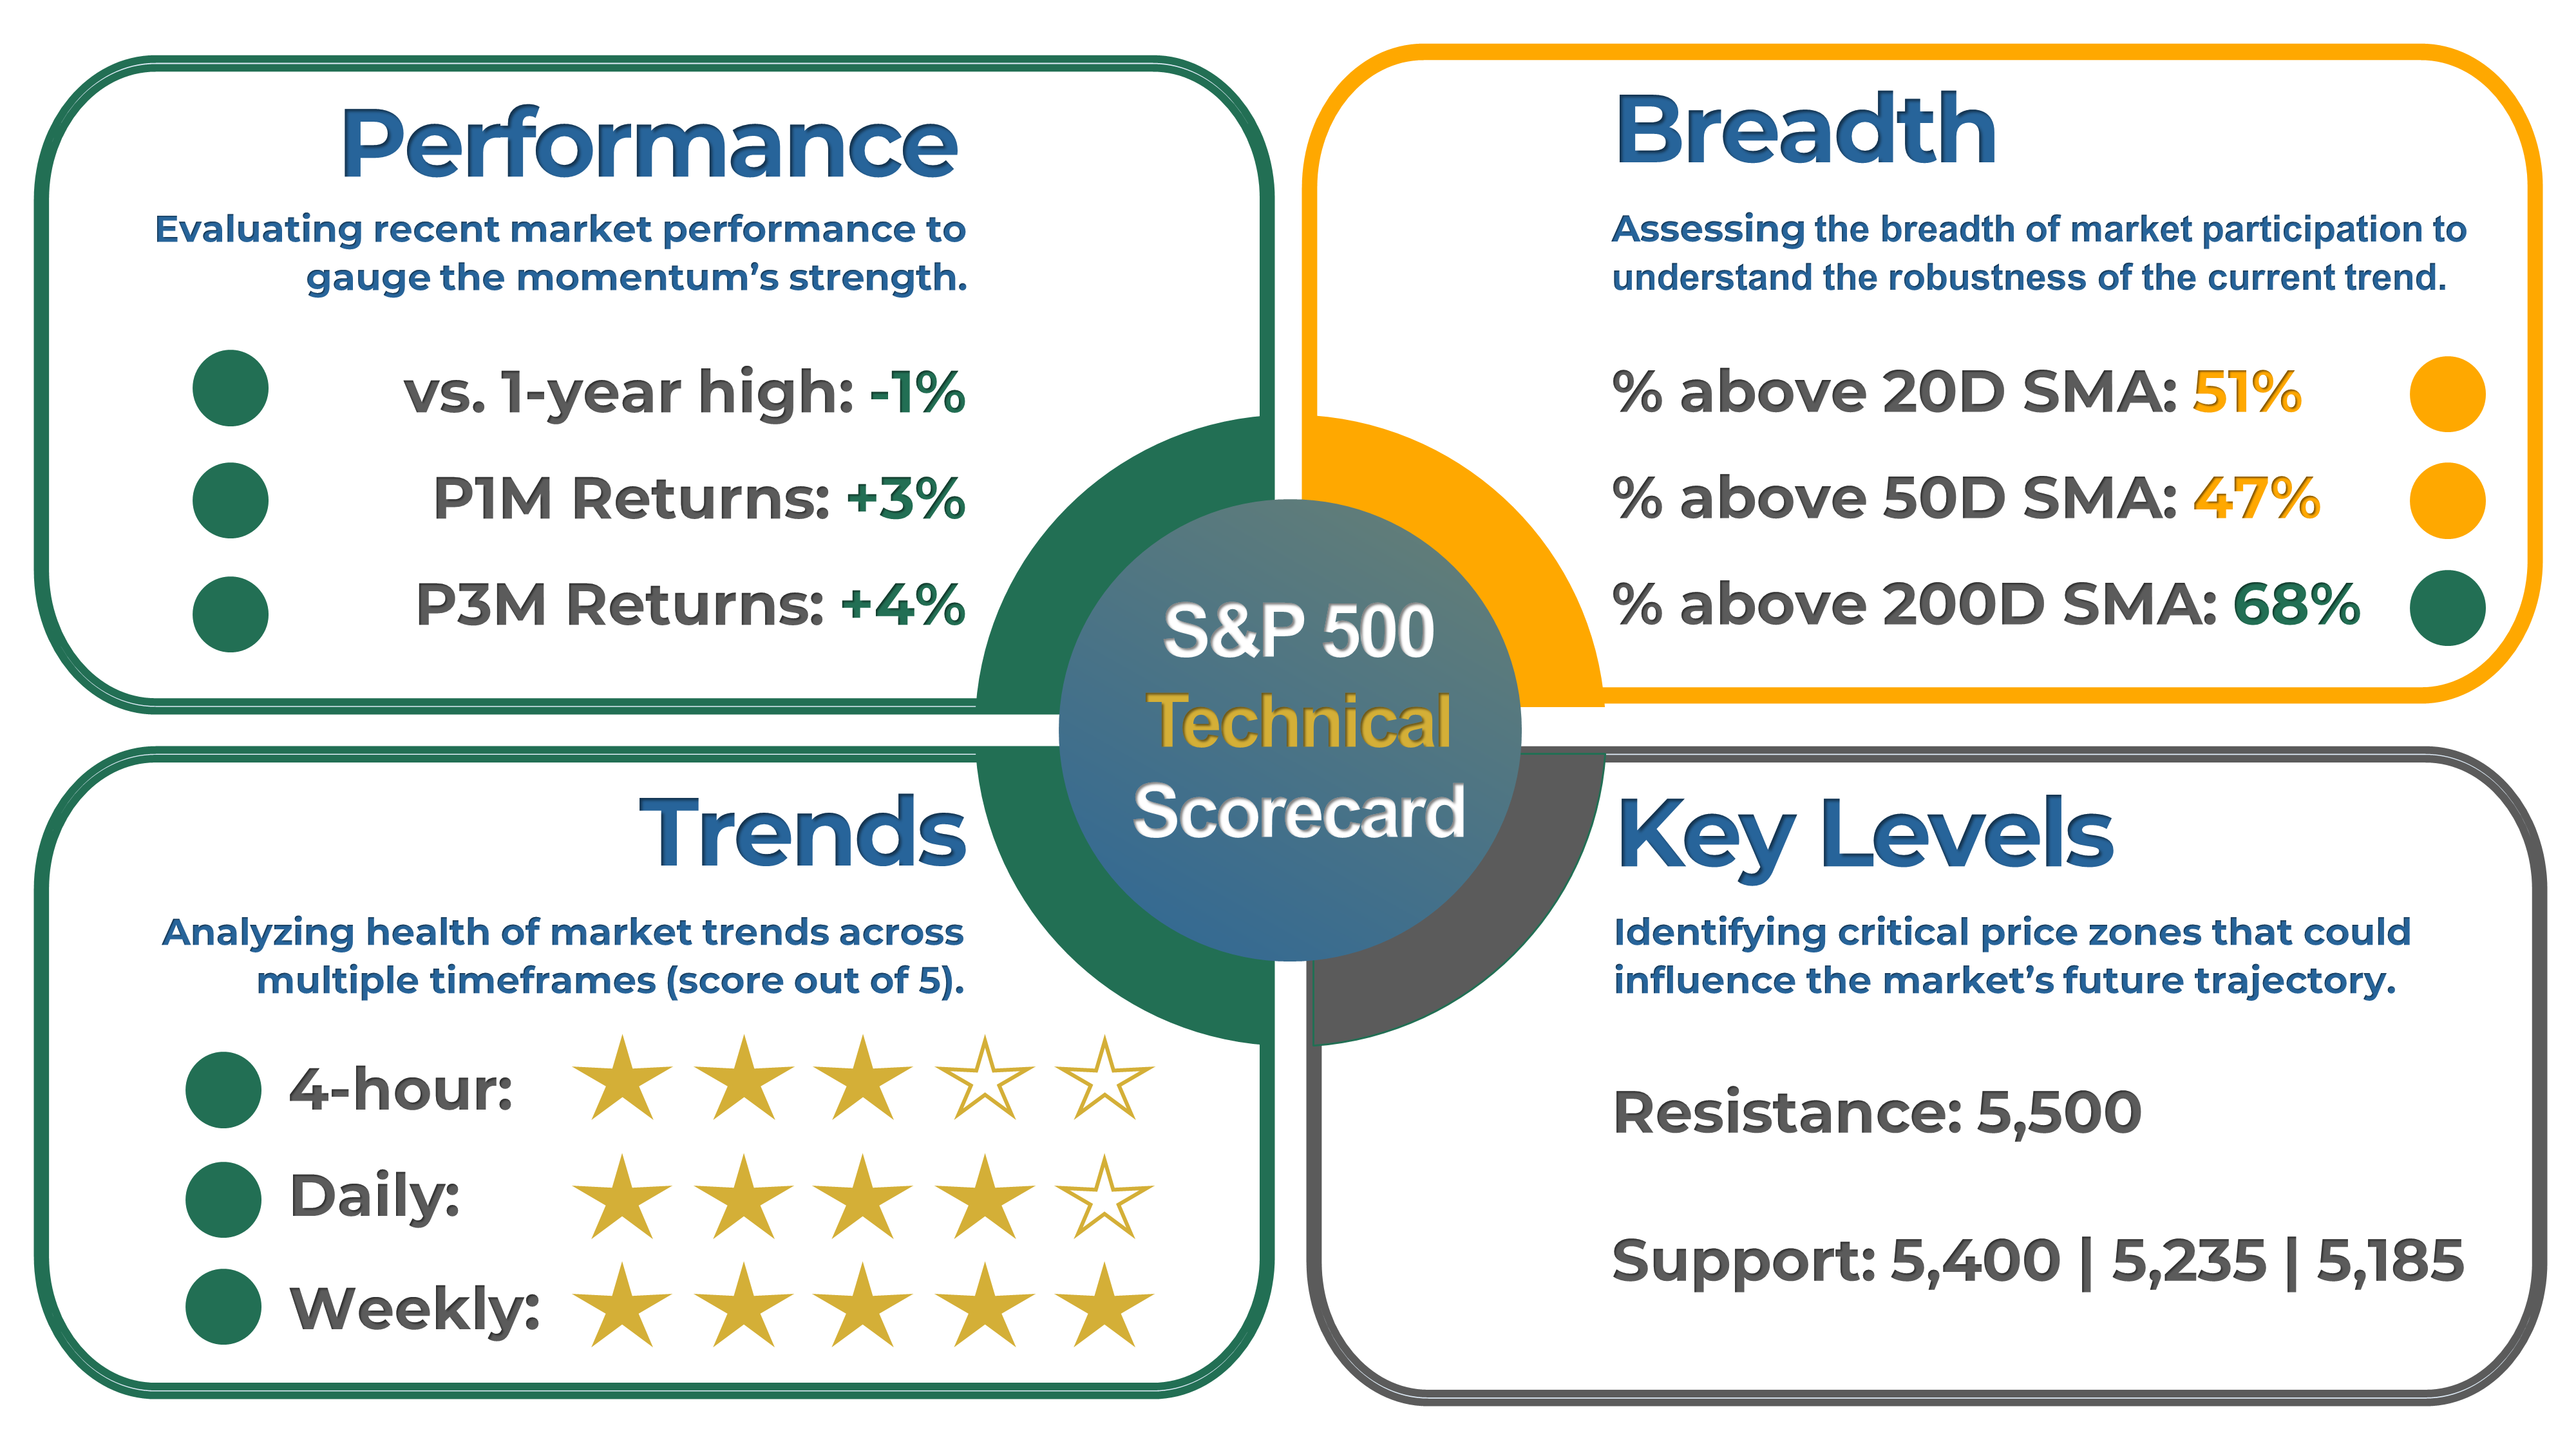
Healthy bull markets typically see the index set several new highs, broad market participation, and ascending trend lines. That's why I've created a four-part scorecard – a straightforward tool to give us a comprehensive view of these essential health indicators.
Momentum: The index is up 3% over the past month, 4% in the last three months, and is trading 1% away from its 52-week high.
Breadth: Market participation remains healthy in the long term, as 68% of S&P 500 stocks are trading above their 200-day moving average (SMA). Meanwhile, 51% of the stocks are trading above their 20-day SMA, down by 2 points compared to the previous week.
Trends: The trend on 4-hour and 1-day charts remains mostly positive, with the index trading price above the 21-period exponential moving averages.
Key levels: The next resistance level is 5,500. On the other hand, the next support area is at 5,400.
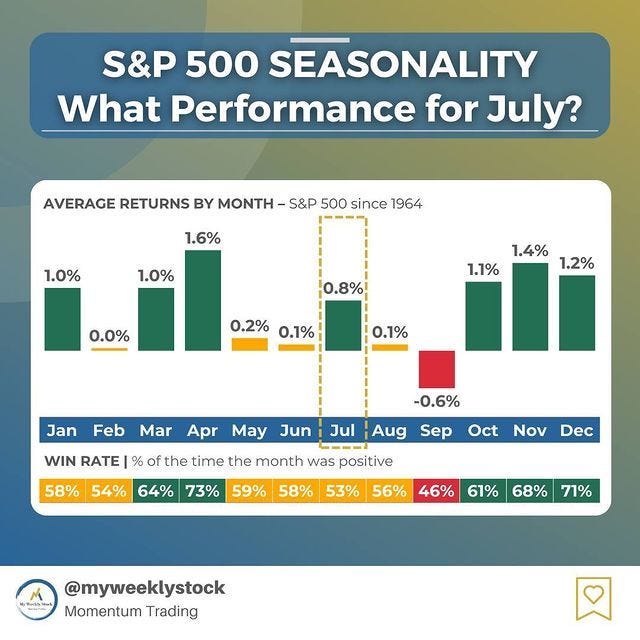
3. Momentum Analysis of the Week
This week's momentum analysis is about seasonality, as we just started the month of July. Since 1964, the S&P500 has been up 53% of the time in July, averaging a 0.8% return.
EARNINGS RECAP
1. Q1 and Full Year 2024 Expected EPS & Revenue Growth
Q1 2024 earnings for the S&P 500 are expected to be up 8%. Excluding the energy sector, the figure is +11%.
Earnings are projected to grow by 11% in 2024, higher than the 9% growth seen on average over the last decade. In the past four weeks, 48% of earnings revisions made by analysts were to increase their outlook.
The forward 4-quarter P/E ratio is 21.7, higher than the average over the past five and ten years.
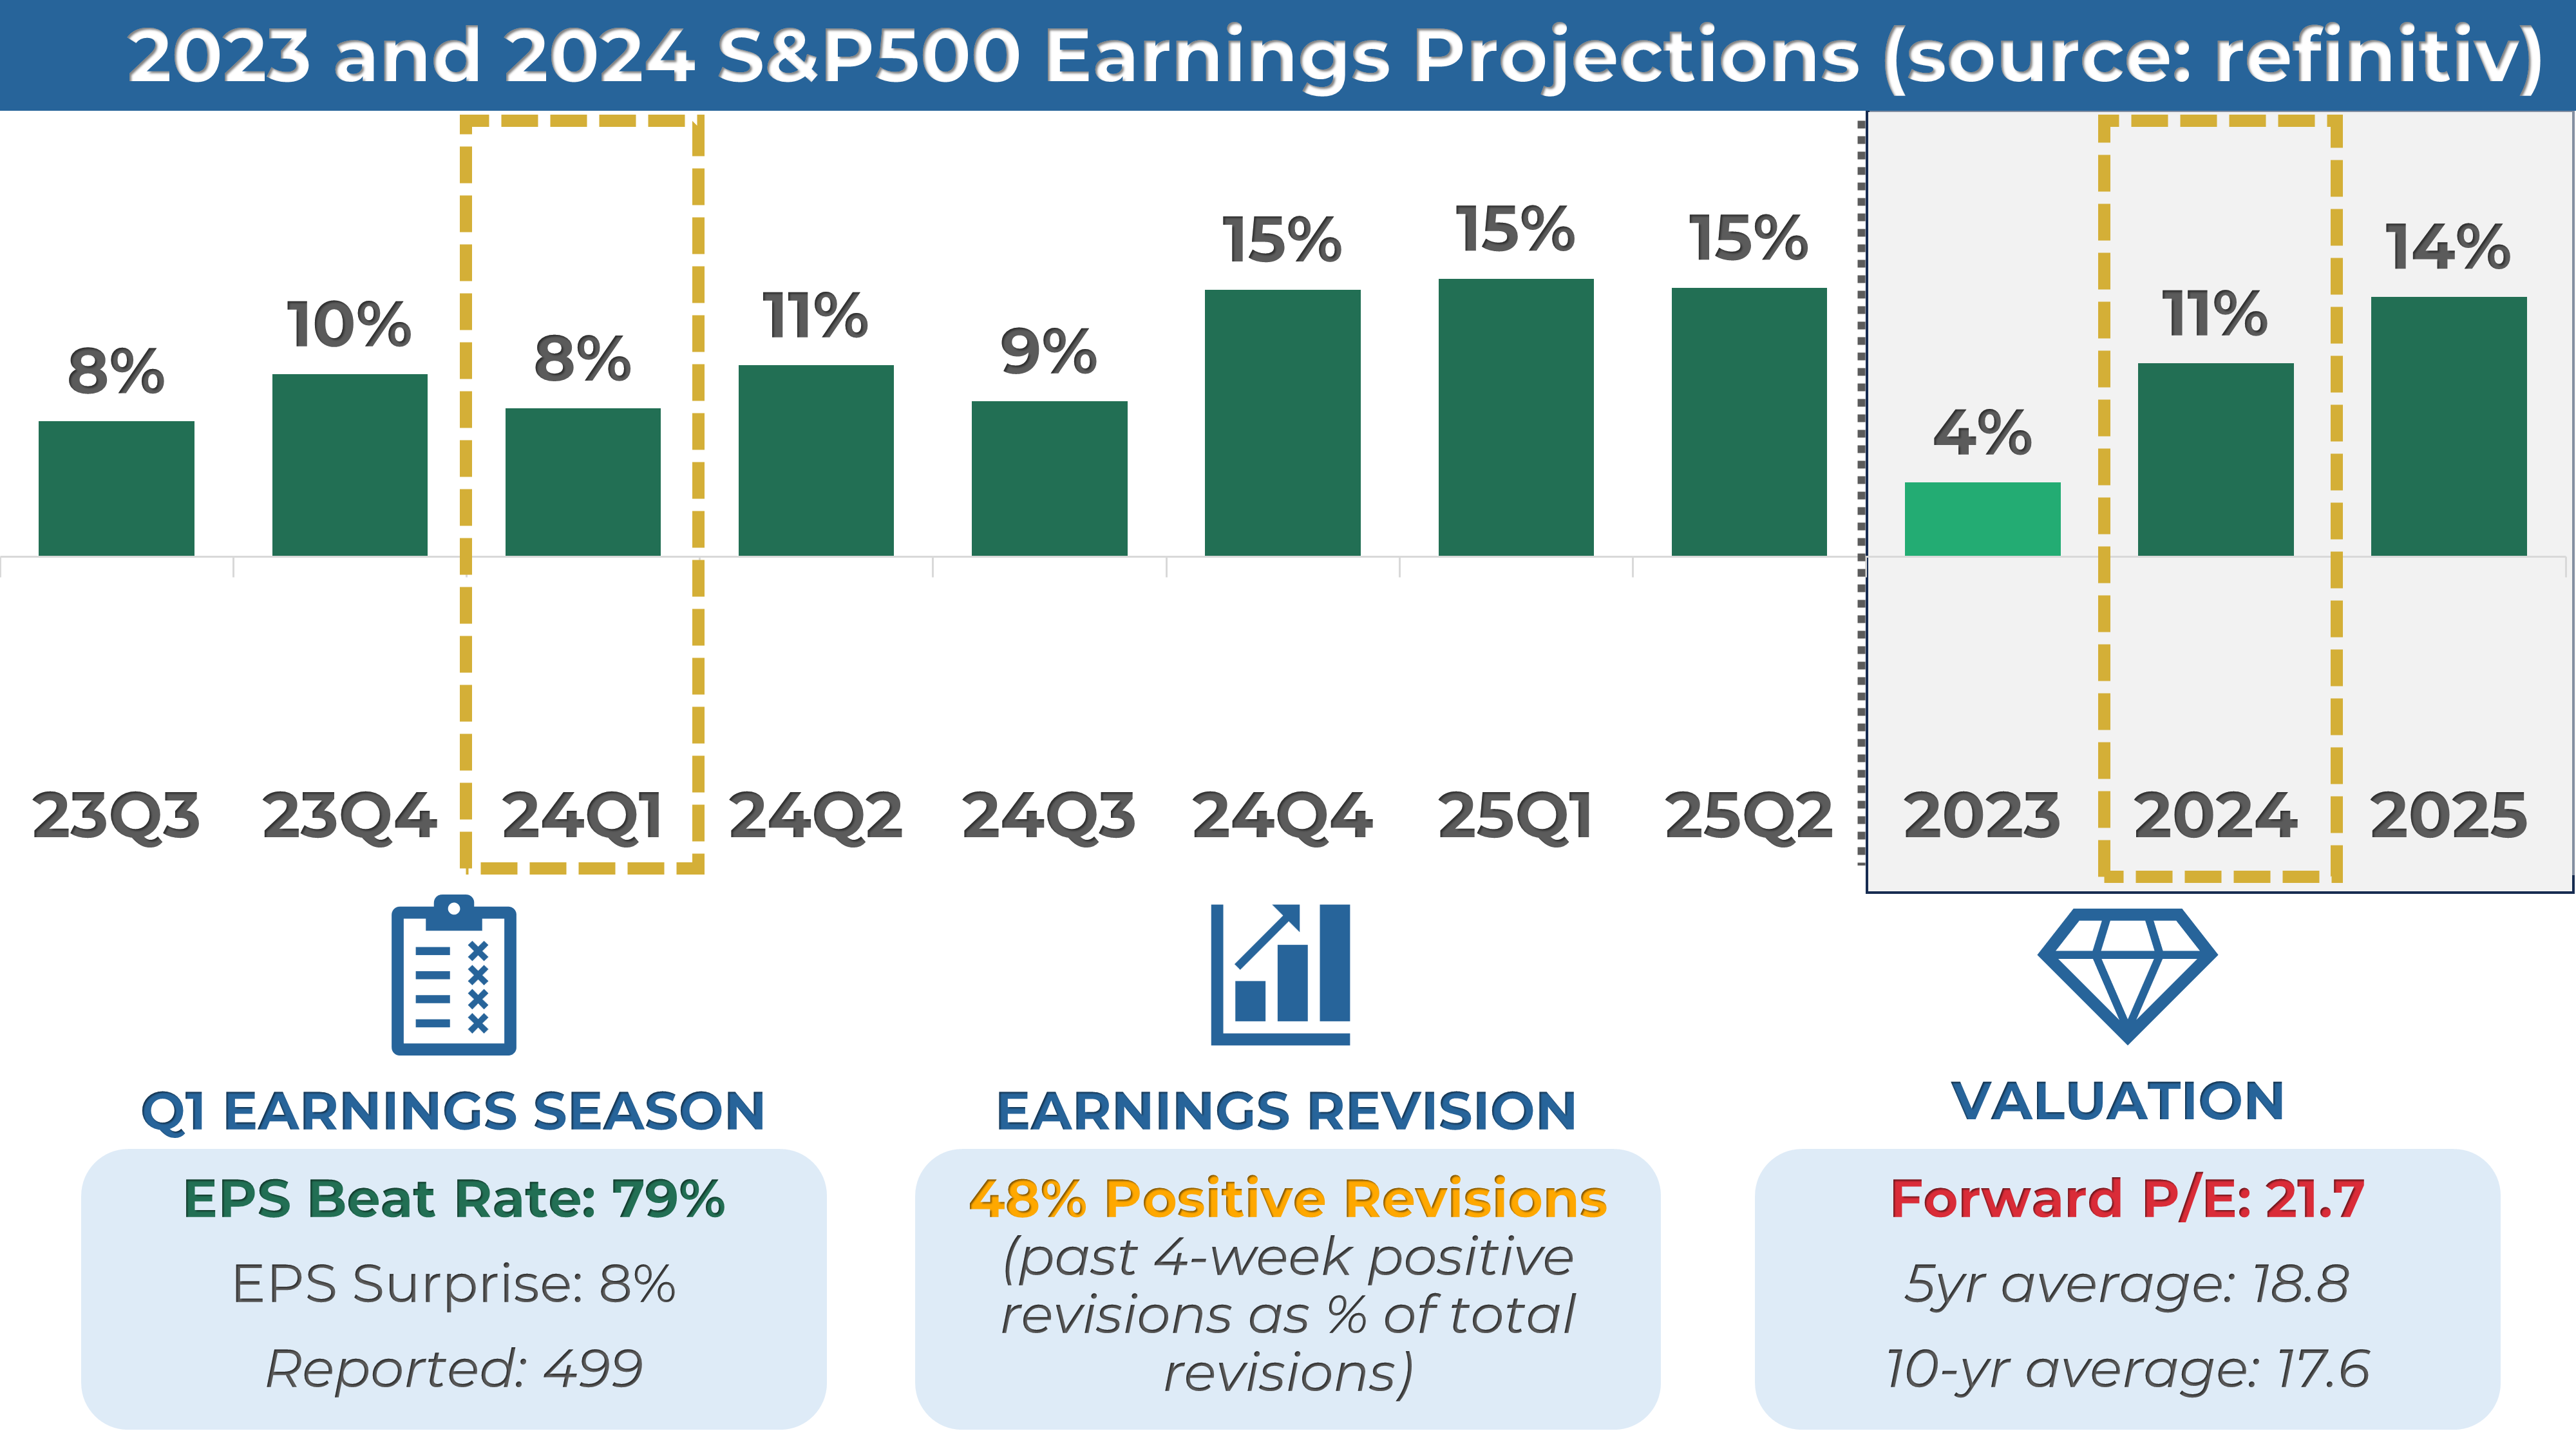
2. Q1 Earnings Season Summary
499 companies from the S&P 500 index have released their Q1 2024 earnings, with 79% posting higher EPS than expectations. This is roughly in line with the previous four-quarter average of 78% and higher than the historical average of 67%.
MARKET SENTIMENT
Measures of investor sentiment can be helpful as they provide insight into the views and opinions of professional or individual investors. However, it's important to note that these measures are not perfect predictors of market movements. They should be combined with other indicators and analysis tools for a complete market picture.
1. AAII Sentiment Survey (Individual Investors)
The American Association of Individual Investors (AAII) conducts a weekly survey among its members to gauge their expectations for the stock market over the next six months. The results are published every Wednesday.
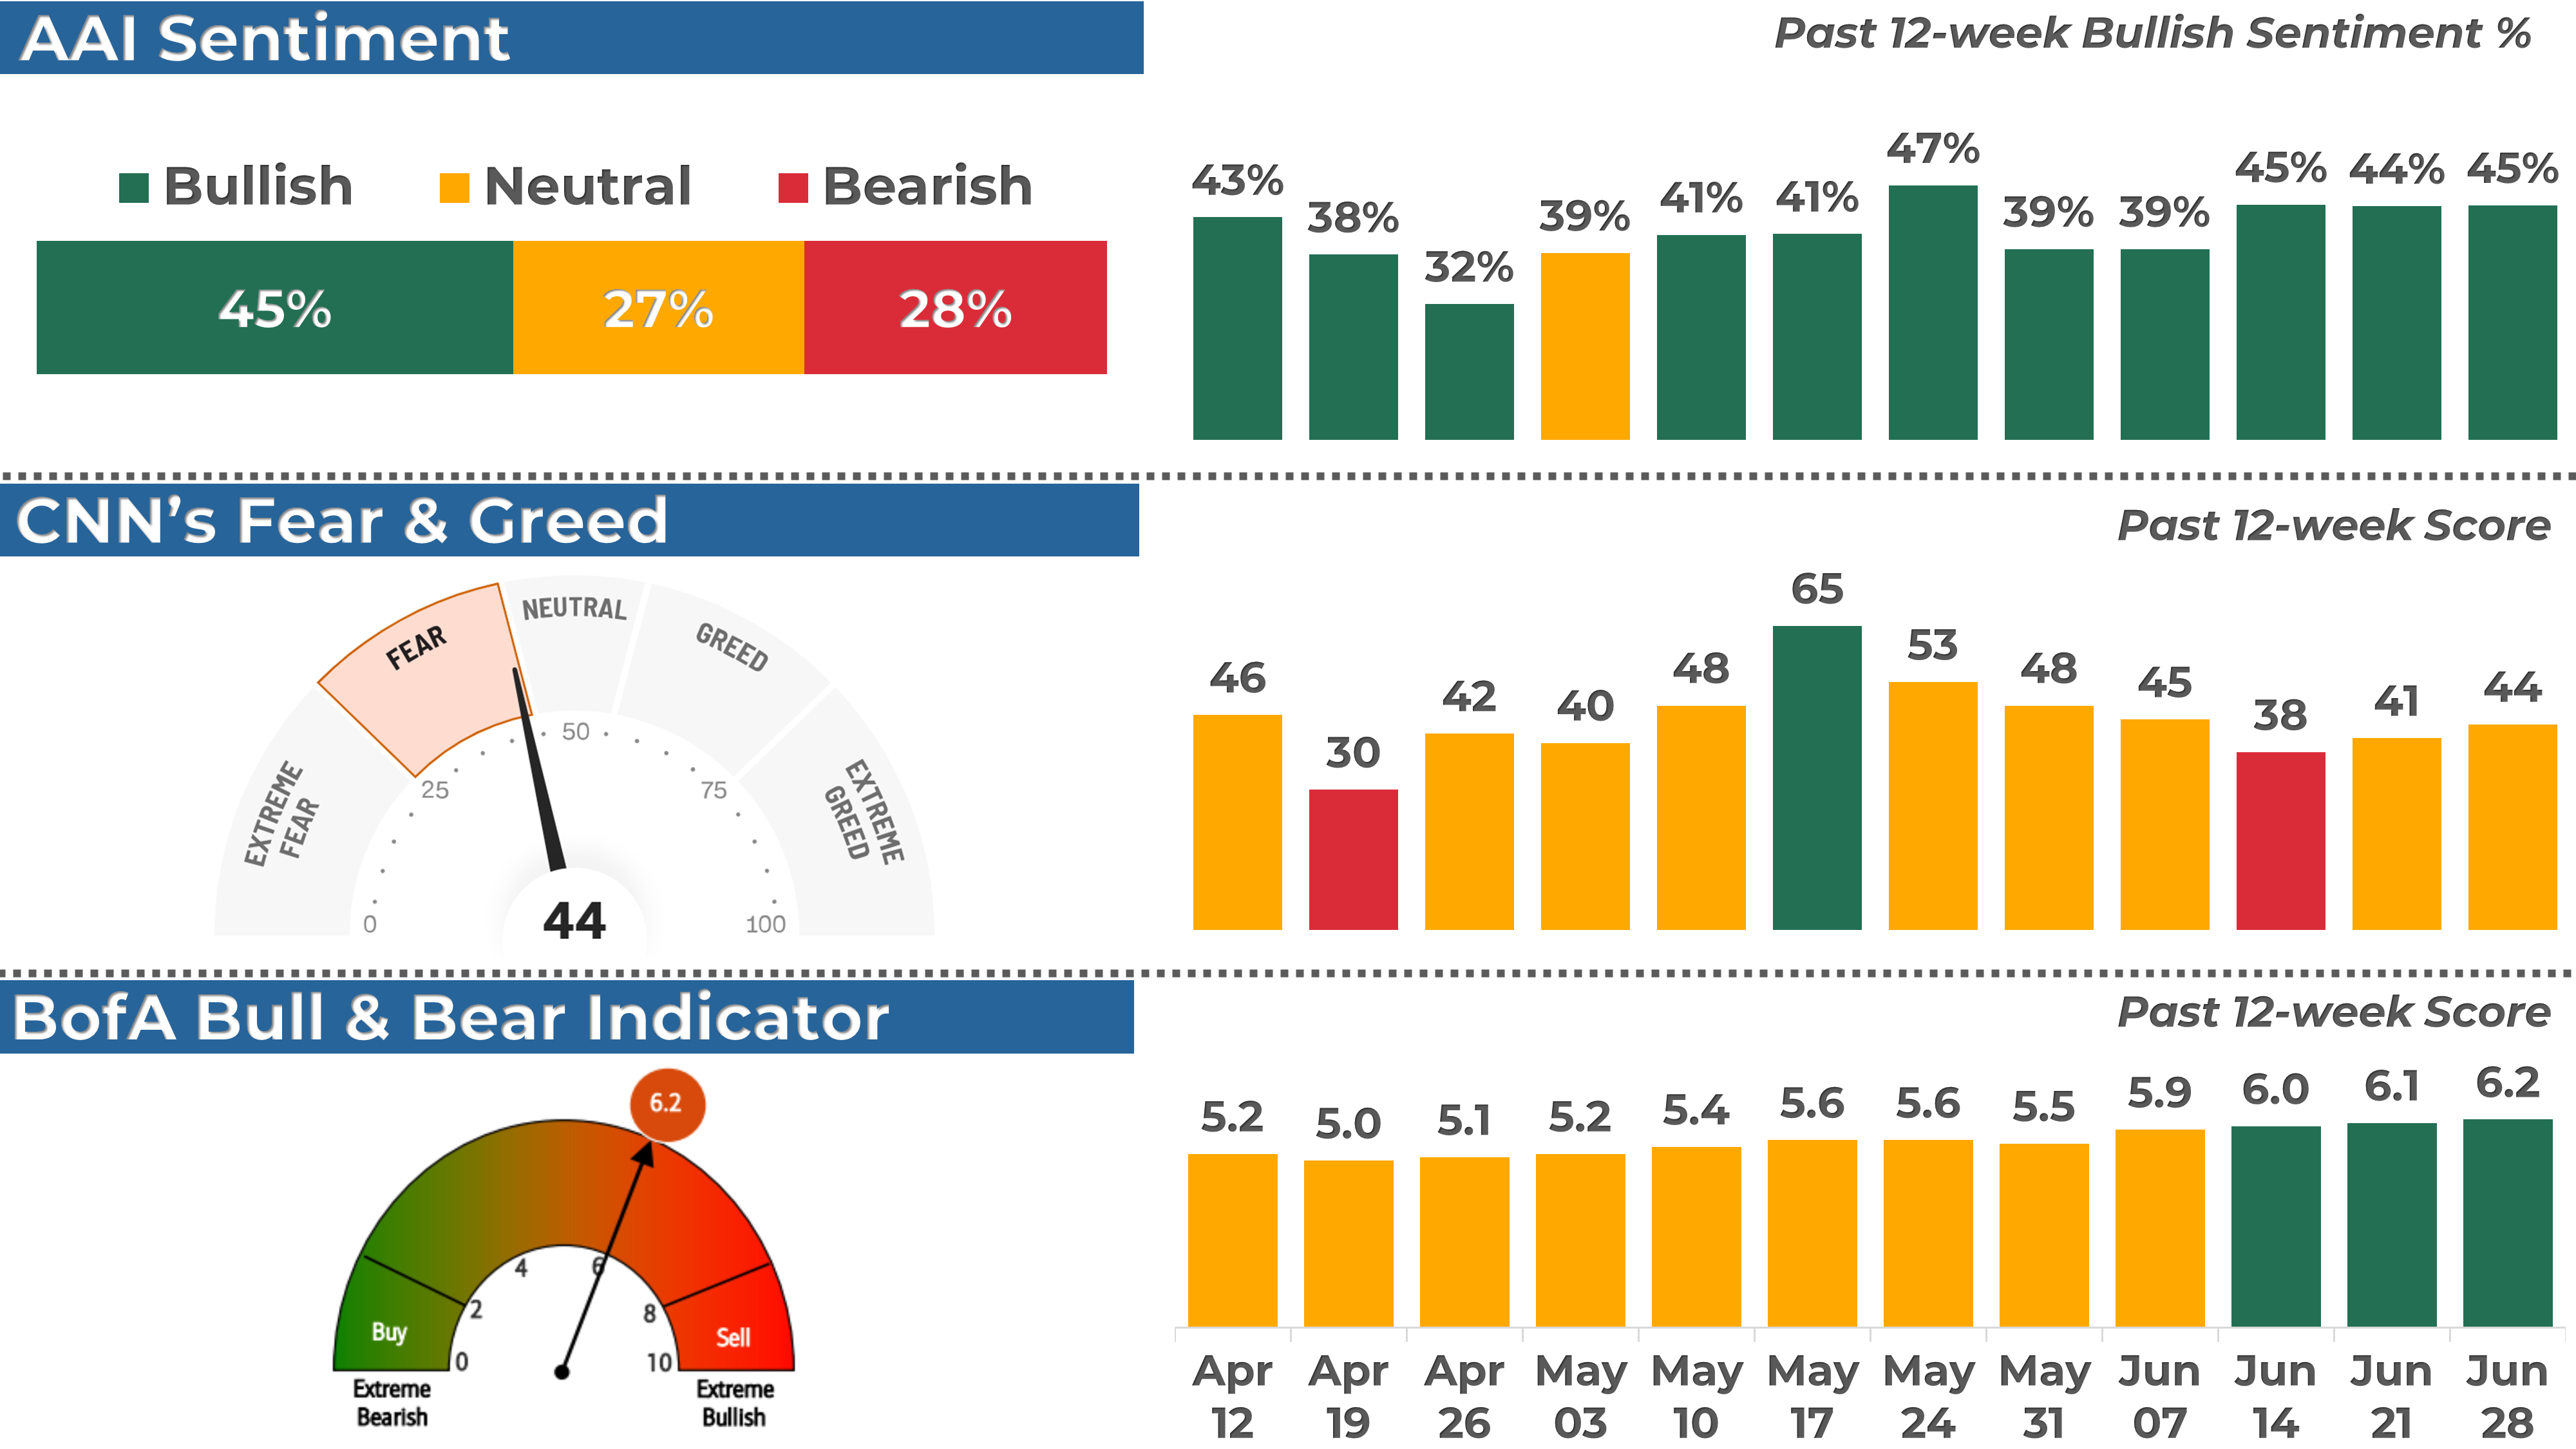
According to the most recent AAII survey, 45% of the respondents had a bullish outlook on the stock market, increasing by 1 point from the previous week.
2. BofA Bull & Bear Indicator (Institutional Investors)
The Bank of America Bull-Bear Indicator is a proprietary measure of investor sentiment developed by Bank of America. It is based on a survey of fund managers and institutional investors, and it tracks the percentage of respondents who are bullish, bearish, or neutral on the stock market. Results are published in the form of a score ranging from 0 (extremely bearish) to 10 (extremely bullish)
The indicator increased from 6.1 to 6.2, a slightly bullish sentiment reading.
3. CNN Fear & Greed Index (Technical)
The CNN Fear & Greed Index is a daily measure that analyzes seven market indicators to assess how emotions influence investors' decisions. The index is scored out of 100 and categorizes results into five stages: Extreme Fear, Fear, Neutral, Greed, and Extreme Greed.
The index closed at 44 or a “Fear” level, up from 41 last Friday.
THE WEEK AHEAD
1. Economic Calendar
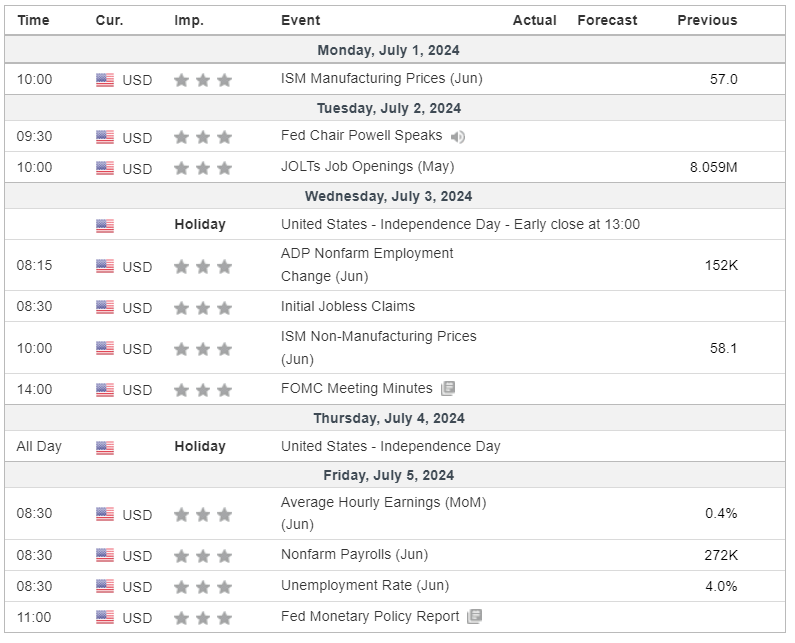
Although it's a short trading week due to the Independence Day holiday, we will have important updates on the agenda. The Fed Chair is scheduled to speak, and the minutes from the last central bank meeting will be released. Both will shed more light on the future path of monetary policy. Friday will bring the release of the Non-Farm Payroll report, a valuable indicator of employment trends.
2. Earnings Calendar
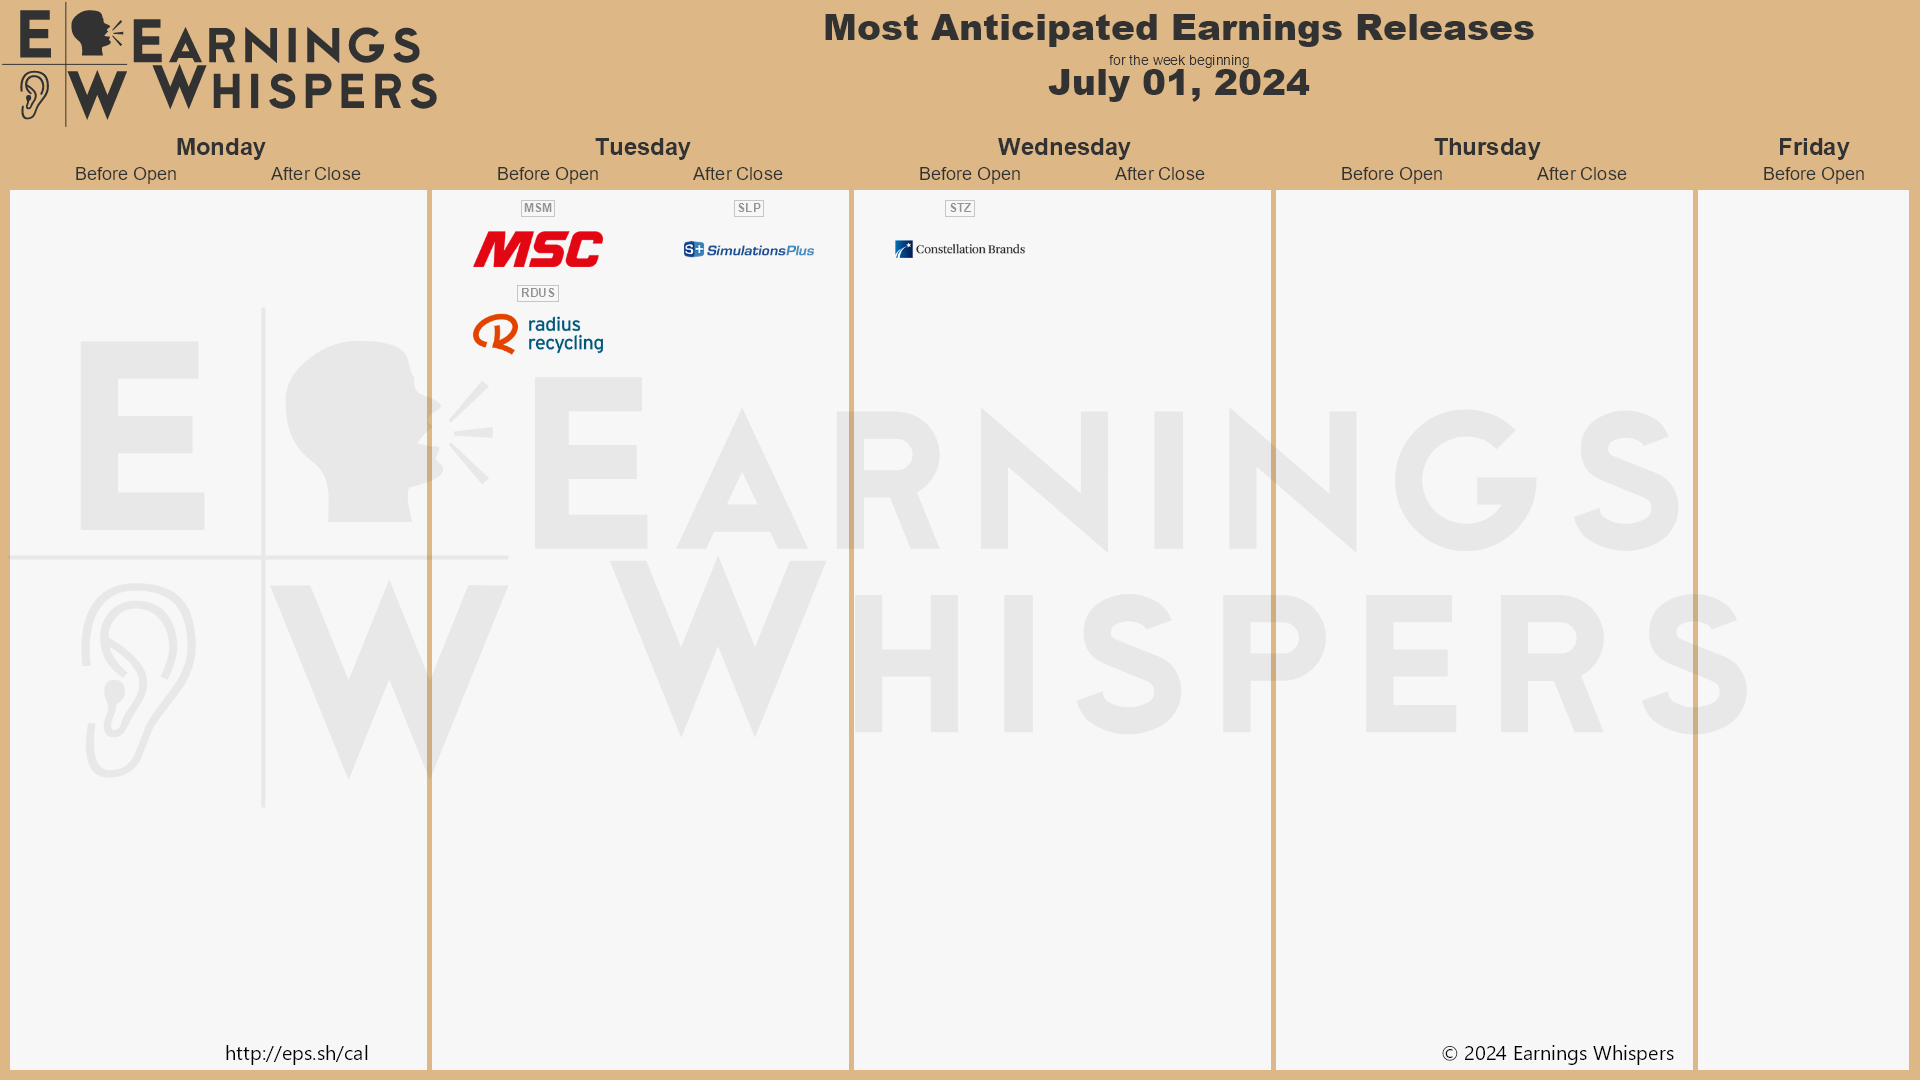
Earnings season is almost over, and 1 company from the S&P 500, Constellation Brands, is expected to release its quarterly results.
That’s a wrap for this week’s recap! I hope it helped you understand the market better.
If you enjoyed this post, you should explore the premium section: I provide my short-term trading and analysis of over 20 US large caps and share my long-term investing portfolios. Upgrade your subscription to unlock all the exclusive features and insights. Remember you can get your annual subscription at a 30% discount until the end of July!
If you have any questions or feedback, please don't hesitate to email me or comment on this post. Your support helps me create high-quality content and is greatly appreciated!
Have a great week!
My Weekly Stock
DISCLAIMER
The information provided in this newsletter is for informational purposes only and should not be taken as financial advice. Any investments or decisions made based on the information provided in this newsletter are the reader's sole responsibility. We recommend that readers conduct their own research and consult a qualified financial professional before making investment decisions. The author does not assume any responsibility for any losses or damages arising from using the information provided in this newsletter.
Nice summary per usual! Amazing how we're 1% of All Time Highs yet the Fear & Greed index is showing fear. Seems like a sign that the market is still climbing the wall of worry as the most hated bull market of all time!