

Weekly Market Recap (Sep 16-20): The Fed Propels The S&P500 To Record Highs - More To Come?
Weekly Market Recap (Sep 16-20): The Fed Propels The S&P500 To Record Highs - More To Come?
Everything you need to know about last week's markets performance and what to expect next.
Dear subscribers,
Welcome to My Weekly Stock, where we blend in-depth market analysis with proven momentum-based trading strategies. My mission? Help you navigate the financial markets with unbiased, data-driven insights you can act on!
Every week, I spend hours curating this market recap, producing insightful analyses with clear visuals and a structured layout so you can easily find what you need, week after week. And because it's easy to get swayed by personal bias, I like to let the data do most of the talking.
Remember to upgrade your subscription to access all my trading and investing portfolios, and see how I protect my gains in these turbulent times!
Let’s get started!
SUMMARY
Here are this week's highlights and what to look out for next:
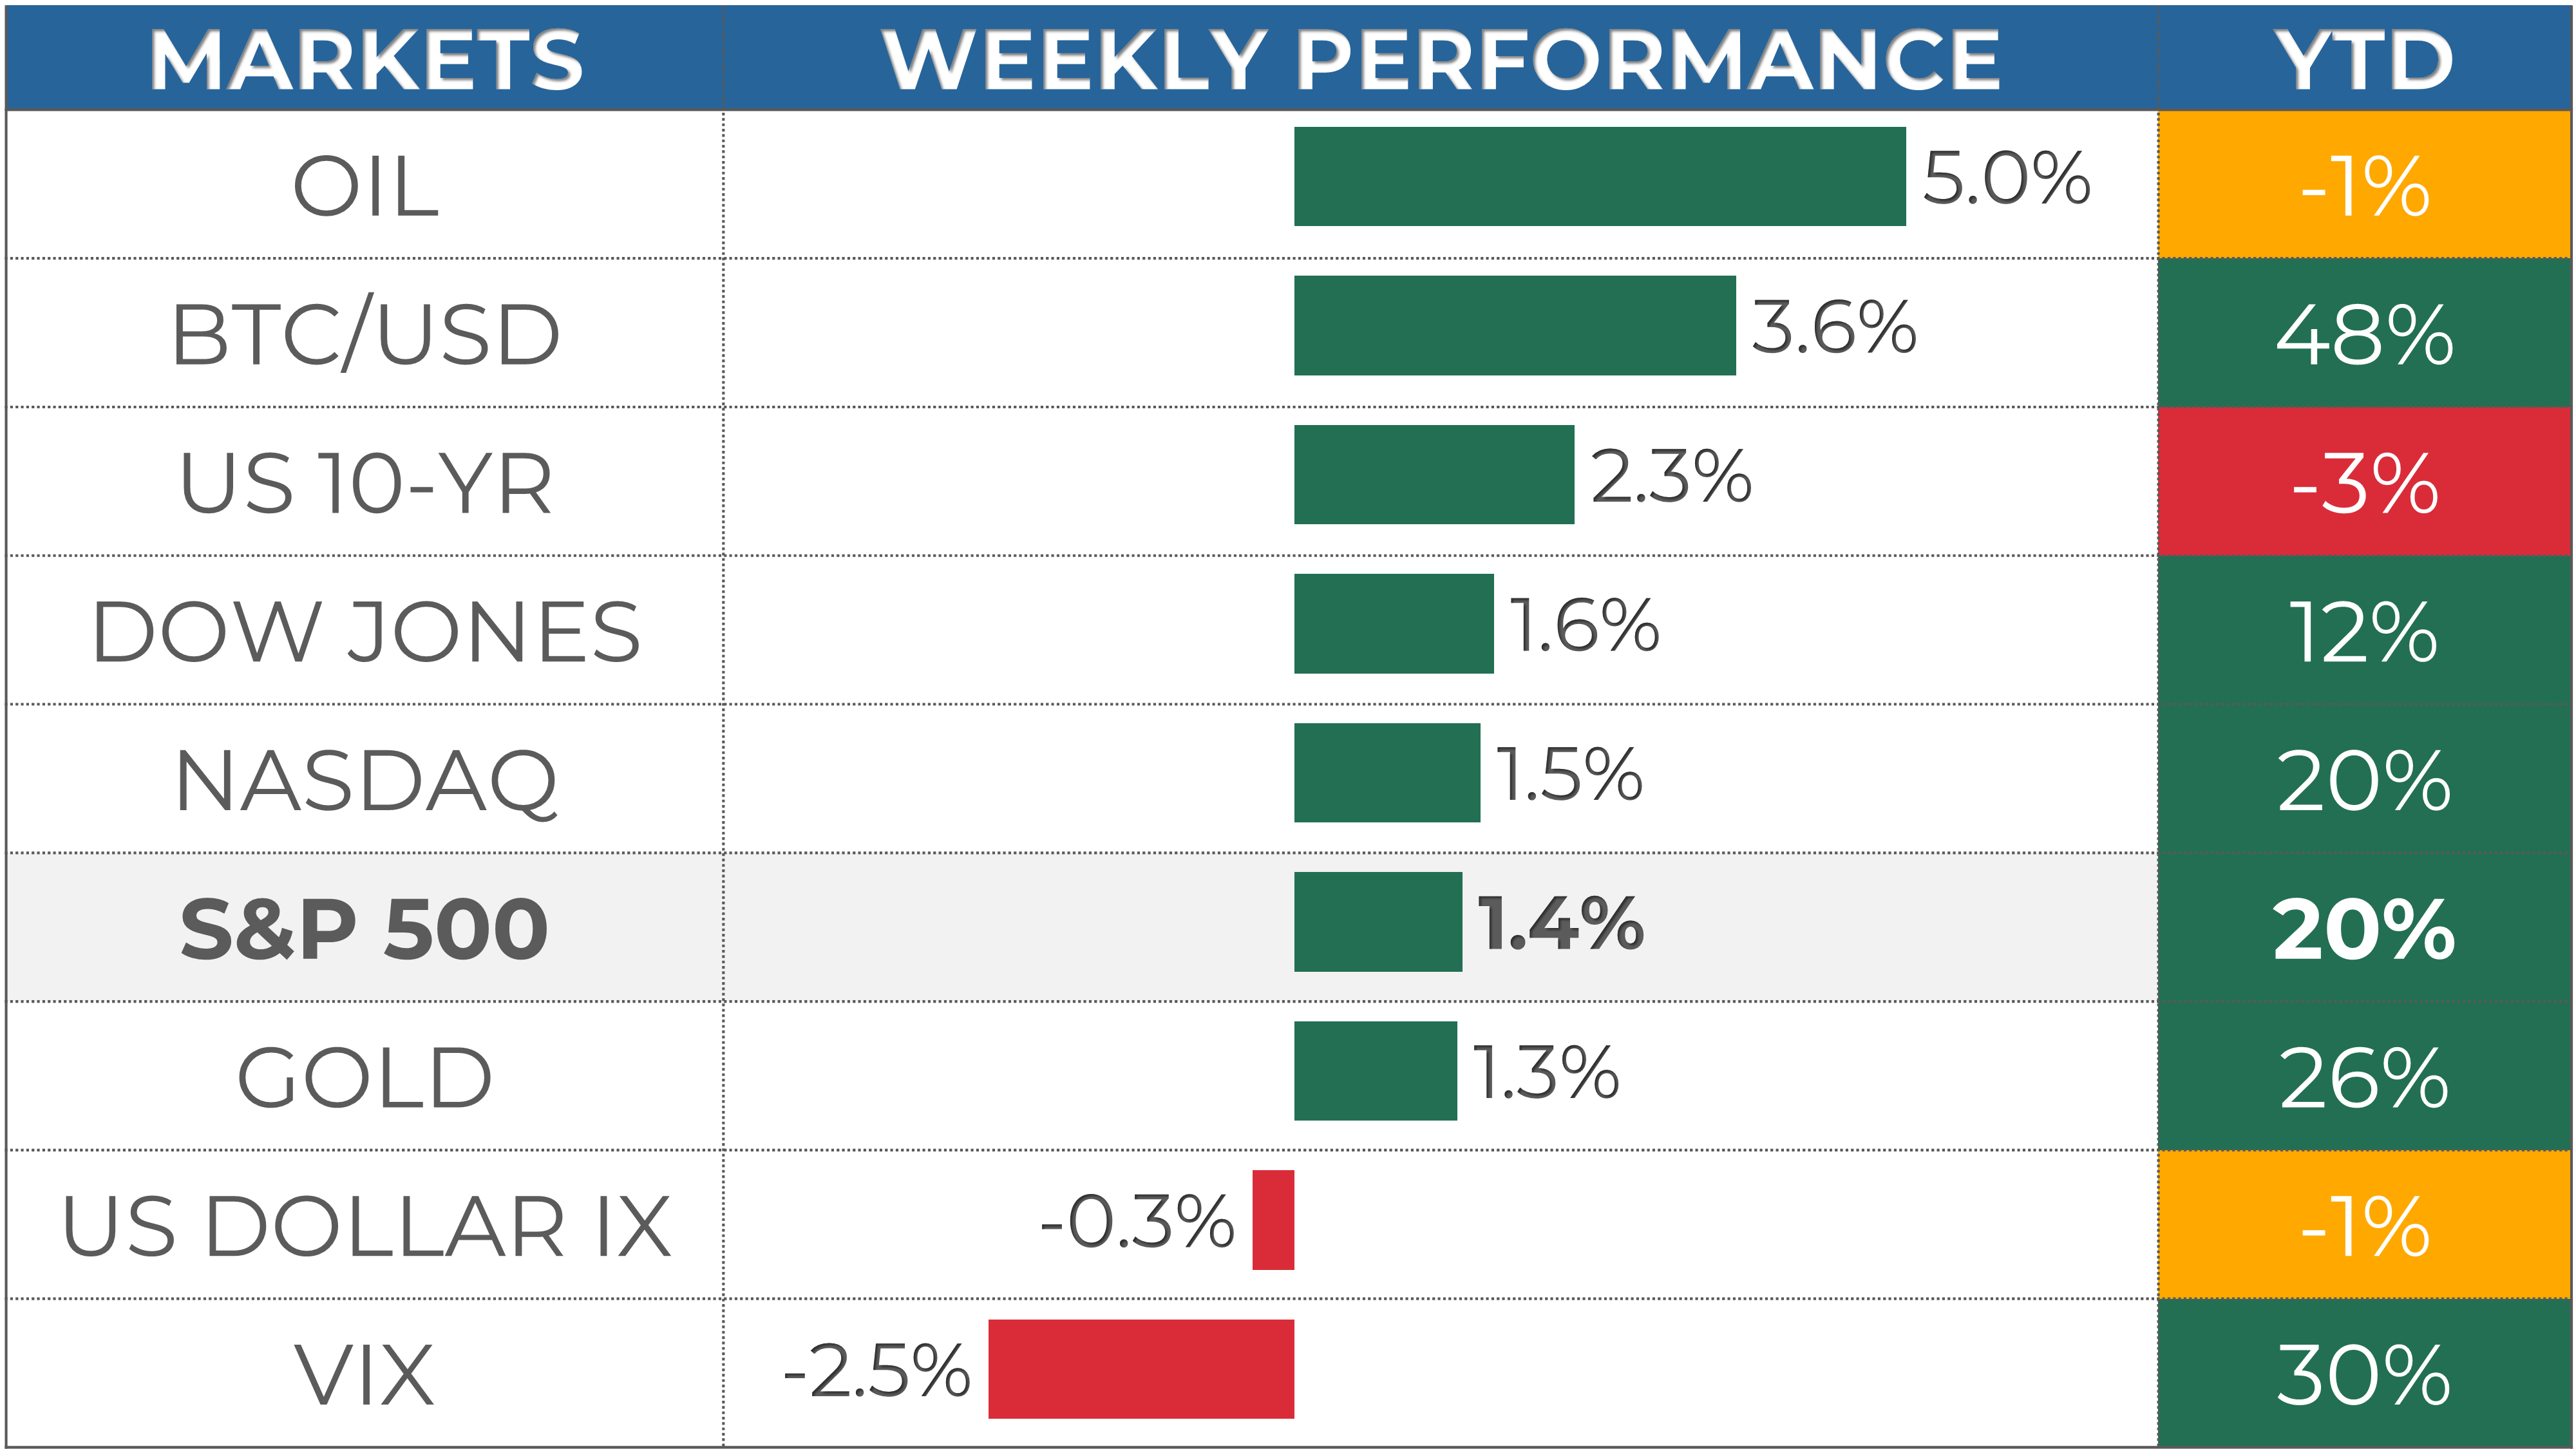
1. The markets were up this week, with the S&P 500 up 1.4%, the Nasdaq 1.5%, and the Dow Jones 1.6%. Energy (+3.7%) and Financials (+2.4%) were the best-performing sectors.
2. The S&P 500's long-term trend is positive, and so is the short-term momentum. 5,730 is the next resistance, while 5,670 is support.
3. The earnings season is almost over and 499 companies from the S&P 500 index have released their Q2 results, with 79% beating estimates. Earnings are expected to be up 13% in Q2 2024 and 10% in 2024.
4. Market sentiment is at the "Greed" level (63) as measured by CNN’s Fear & Greed indicator, while VIX is at a medium value of 16.
5. Earnings reports from Micron and Costco, as well as a Q2 GDP update and the PCE price index are scheduled for next week.
My take:
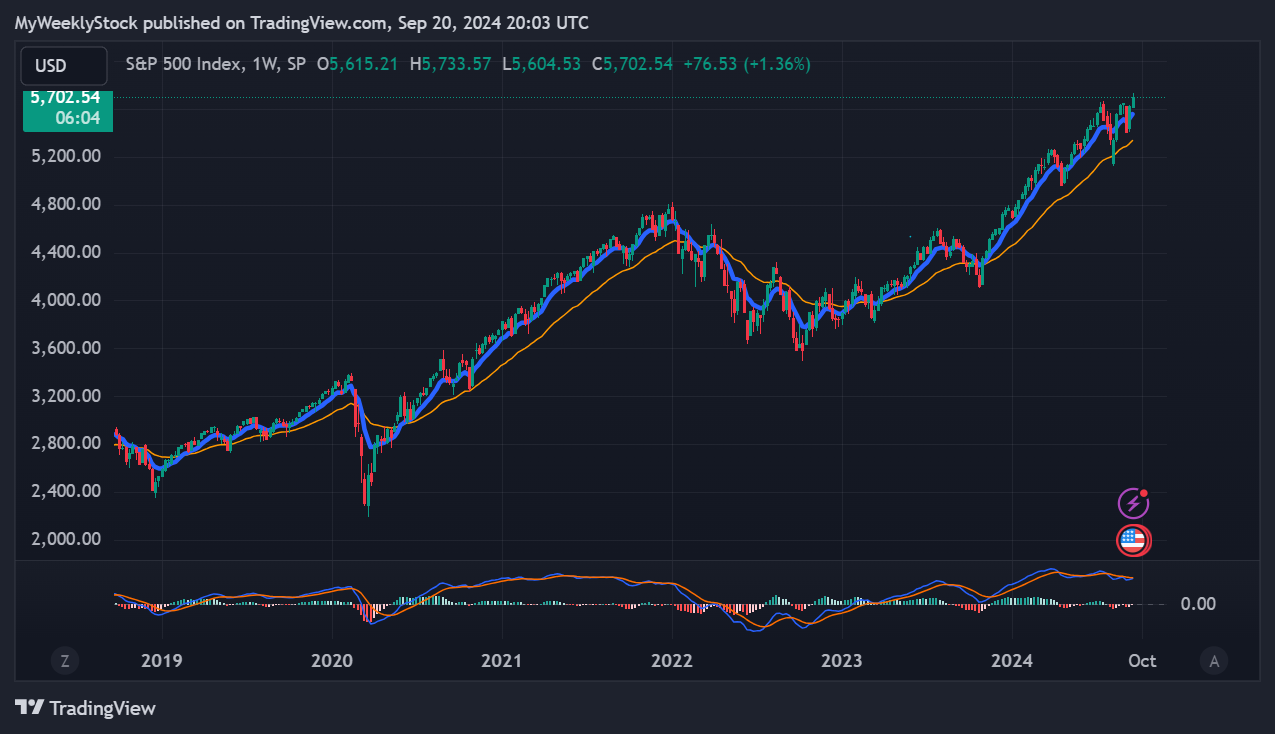
As often the case during weeks with a major catalyst, the market went sideways and made little progress until the FOMC meeting on Wednesday. The Fed surprised the markets with a large 50 bps rate cut, initially sending the index higher before it pared its gains. But this proved to be just another trap, as the next day, the S&P 500 surged to hit a new all-time high, closing the week above 5,700. Looking ahead to the upcoming week, some consolidation to digest the recent gains wouldn't be out of the ordinary, but short and long-term trend point to more upside.
The sequence of events over the past two months is a great reminder of the importance of zooming out and developing a broader view of where we are in the cycle, whether you're a short-term trader or a long-term investor. Despite the volatility spikes and multiple sell-offs this summer, the S&P 500 remained well anchored to its long-term uptrend. Yes, markets will eventually turn sour, but there's far more money to be made, in my view, by riding the uptrend and reacting appropriately when it indeed turns, rather than seeing a bear market at every corner.
PERFORMANCE RECAP
1. S&P 500 Sector Performance
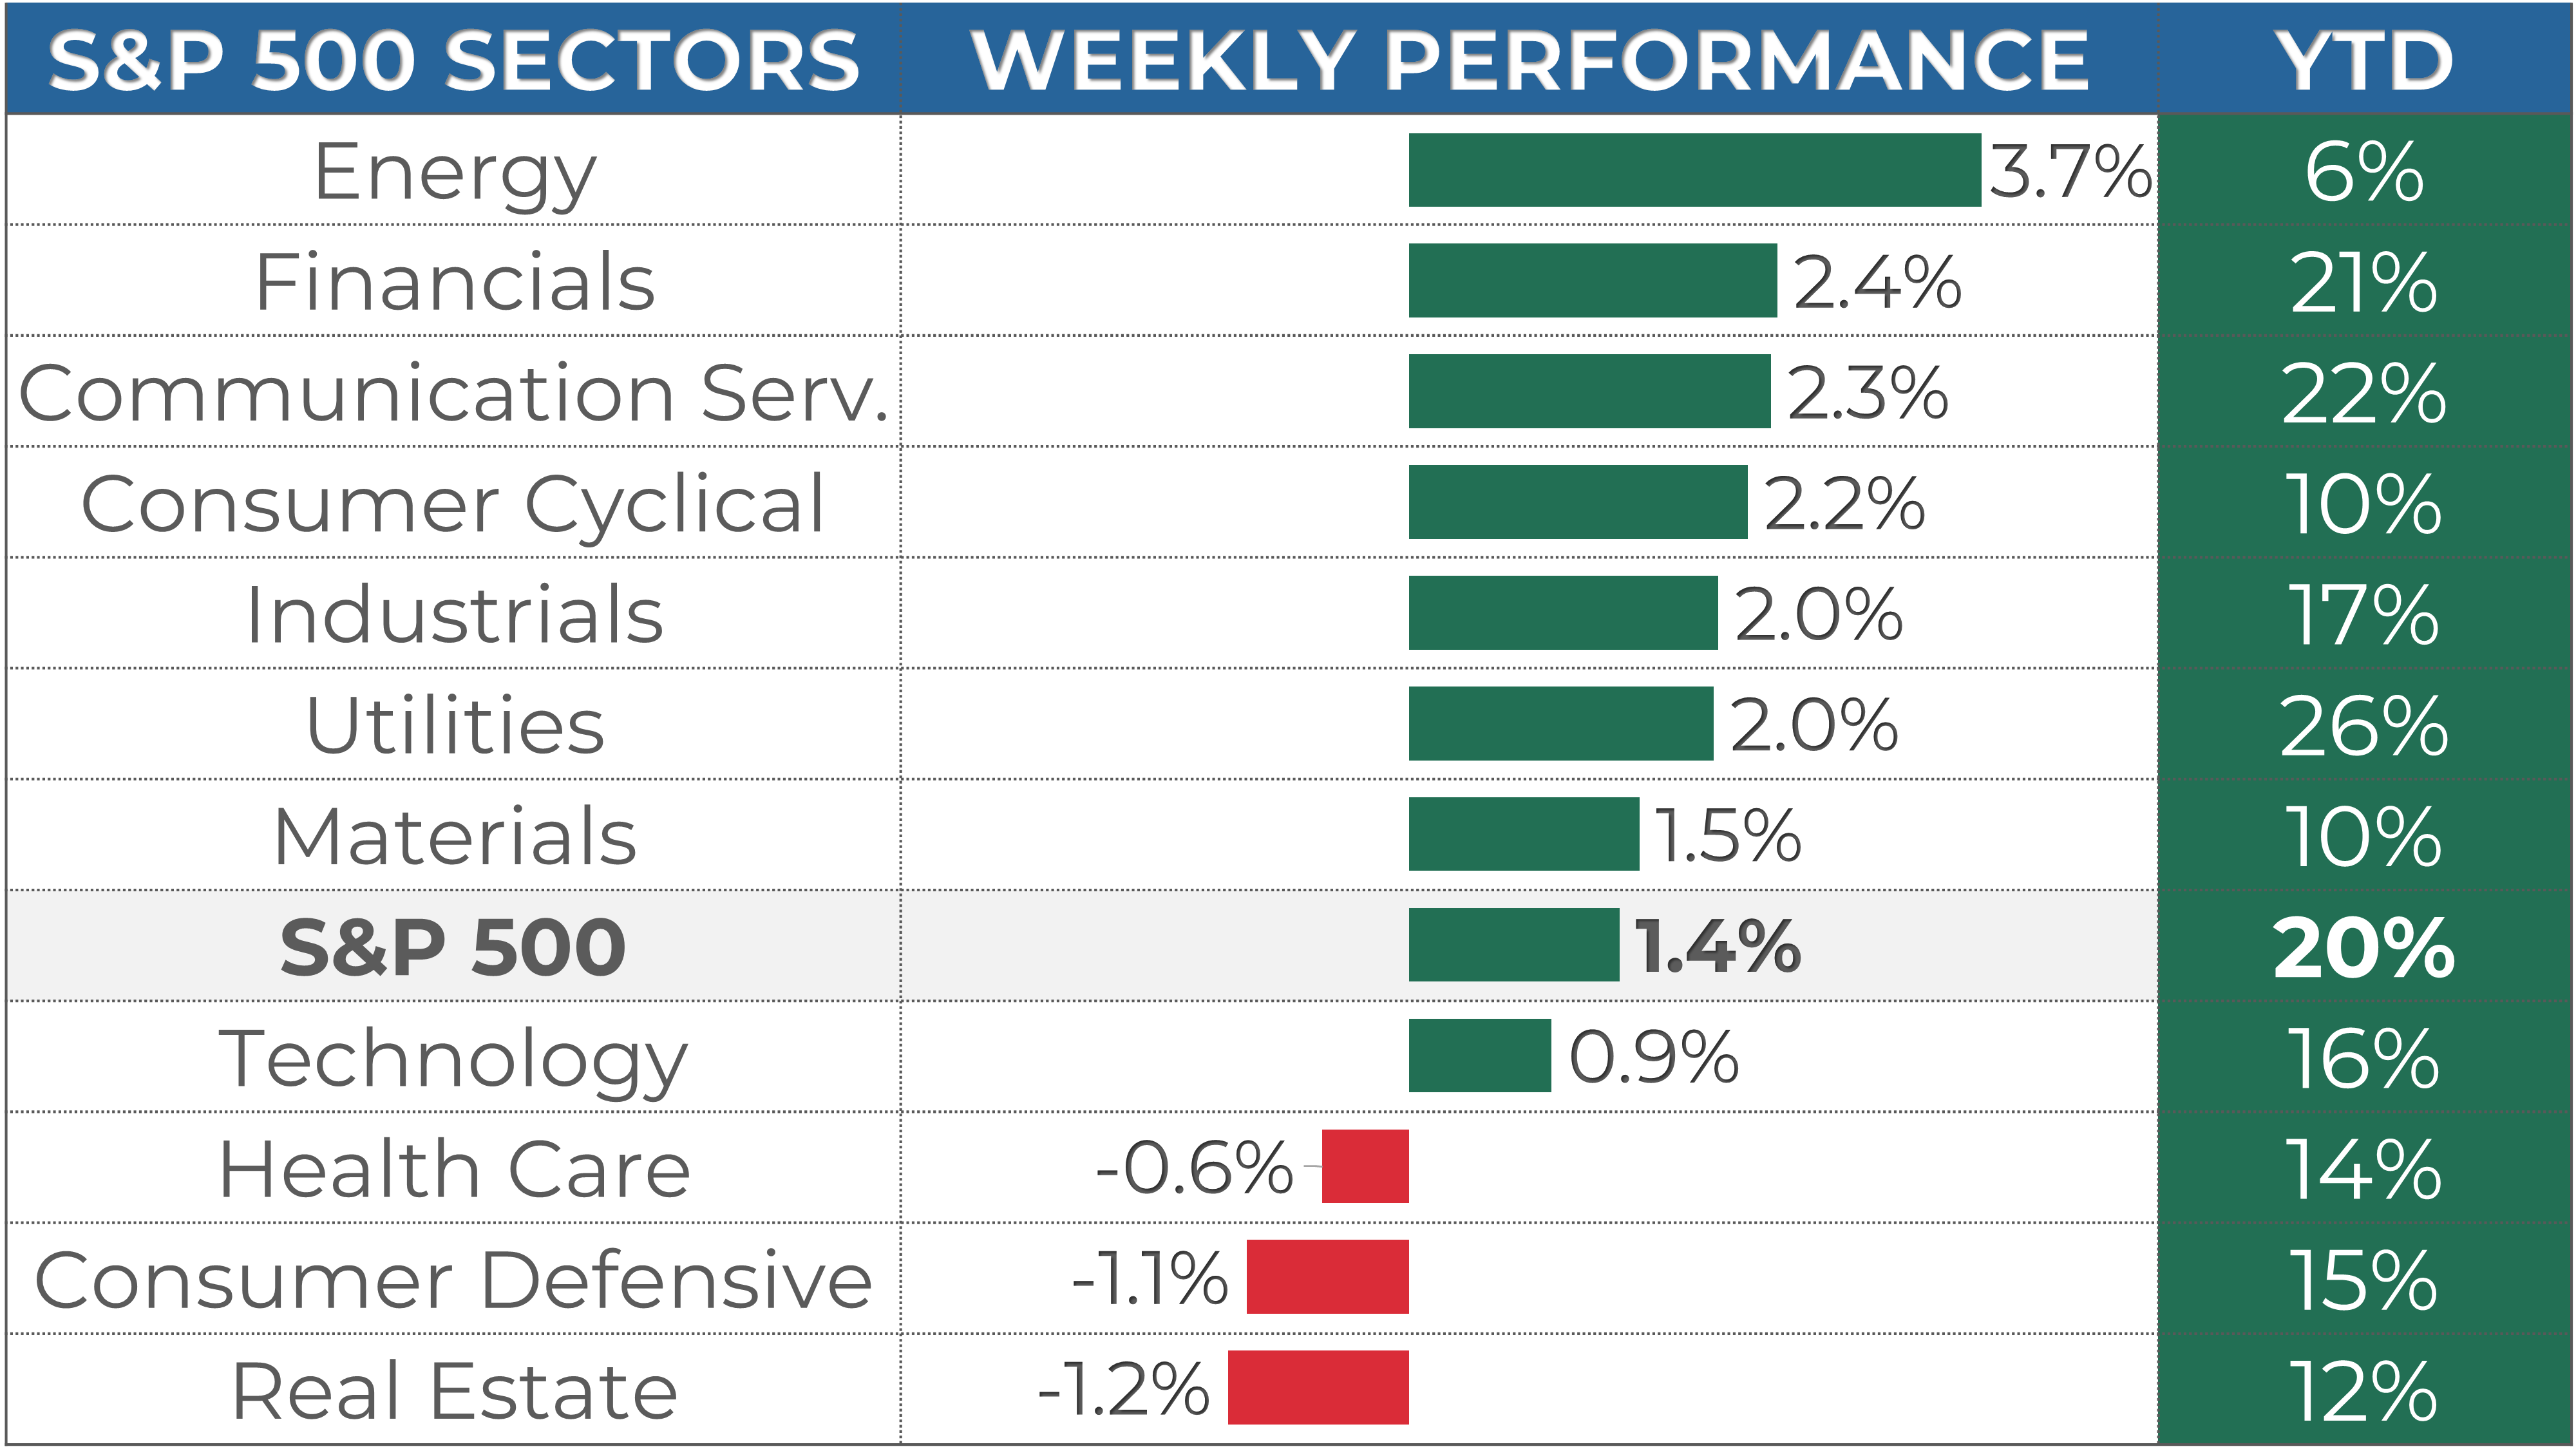
Over the week, 8 of the 11 S&P 500 sectors have achieved gains. Energy led the way, rising by 3.7%. By contrast, Real Estate was the weakest, falling by -1.2%.
Year-to-date, all the sectors have seen positive results. Utilities has been the most successful sector, with a 26% gain. On the other hand, Energy has been trailing behind.
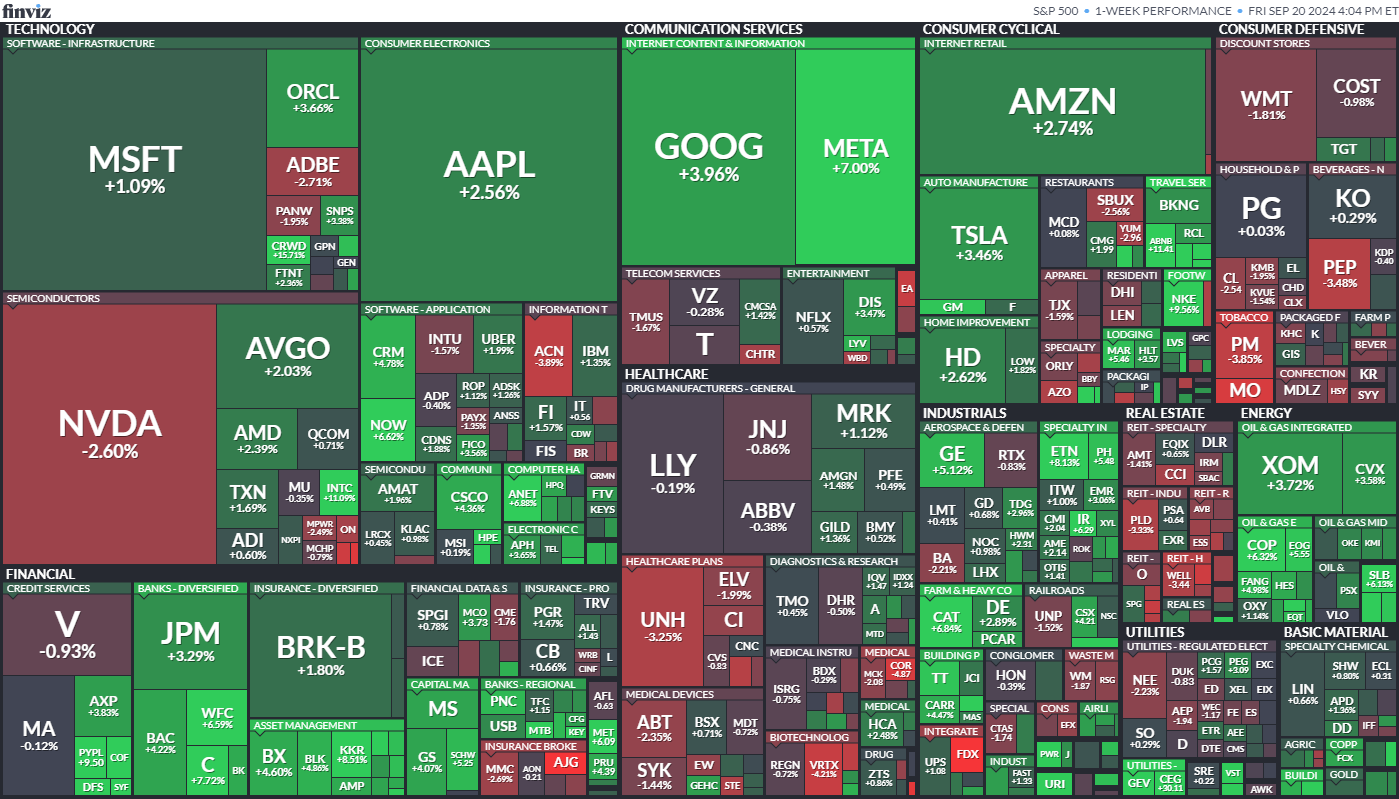
2. S&P 500 Top & Worst Performers
In the last 5 trading days, 65% of the stocks in the S&P 500 index rose in value.
The best-performing stocks were:
Constellation Energy Corporation (CEG, 30%)
Vistra Corp (VST, 26%)
Crowdstrike Holdings Inc (CRWD, 16%)
Meanwhile, the worst-performing stocks were:
Walgreens Boots Alliance Inc (WBA, -5%)
Arthur J. Gallagher & Co. (AJG, -7%)
Fedex Corp (FDX, -11%)
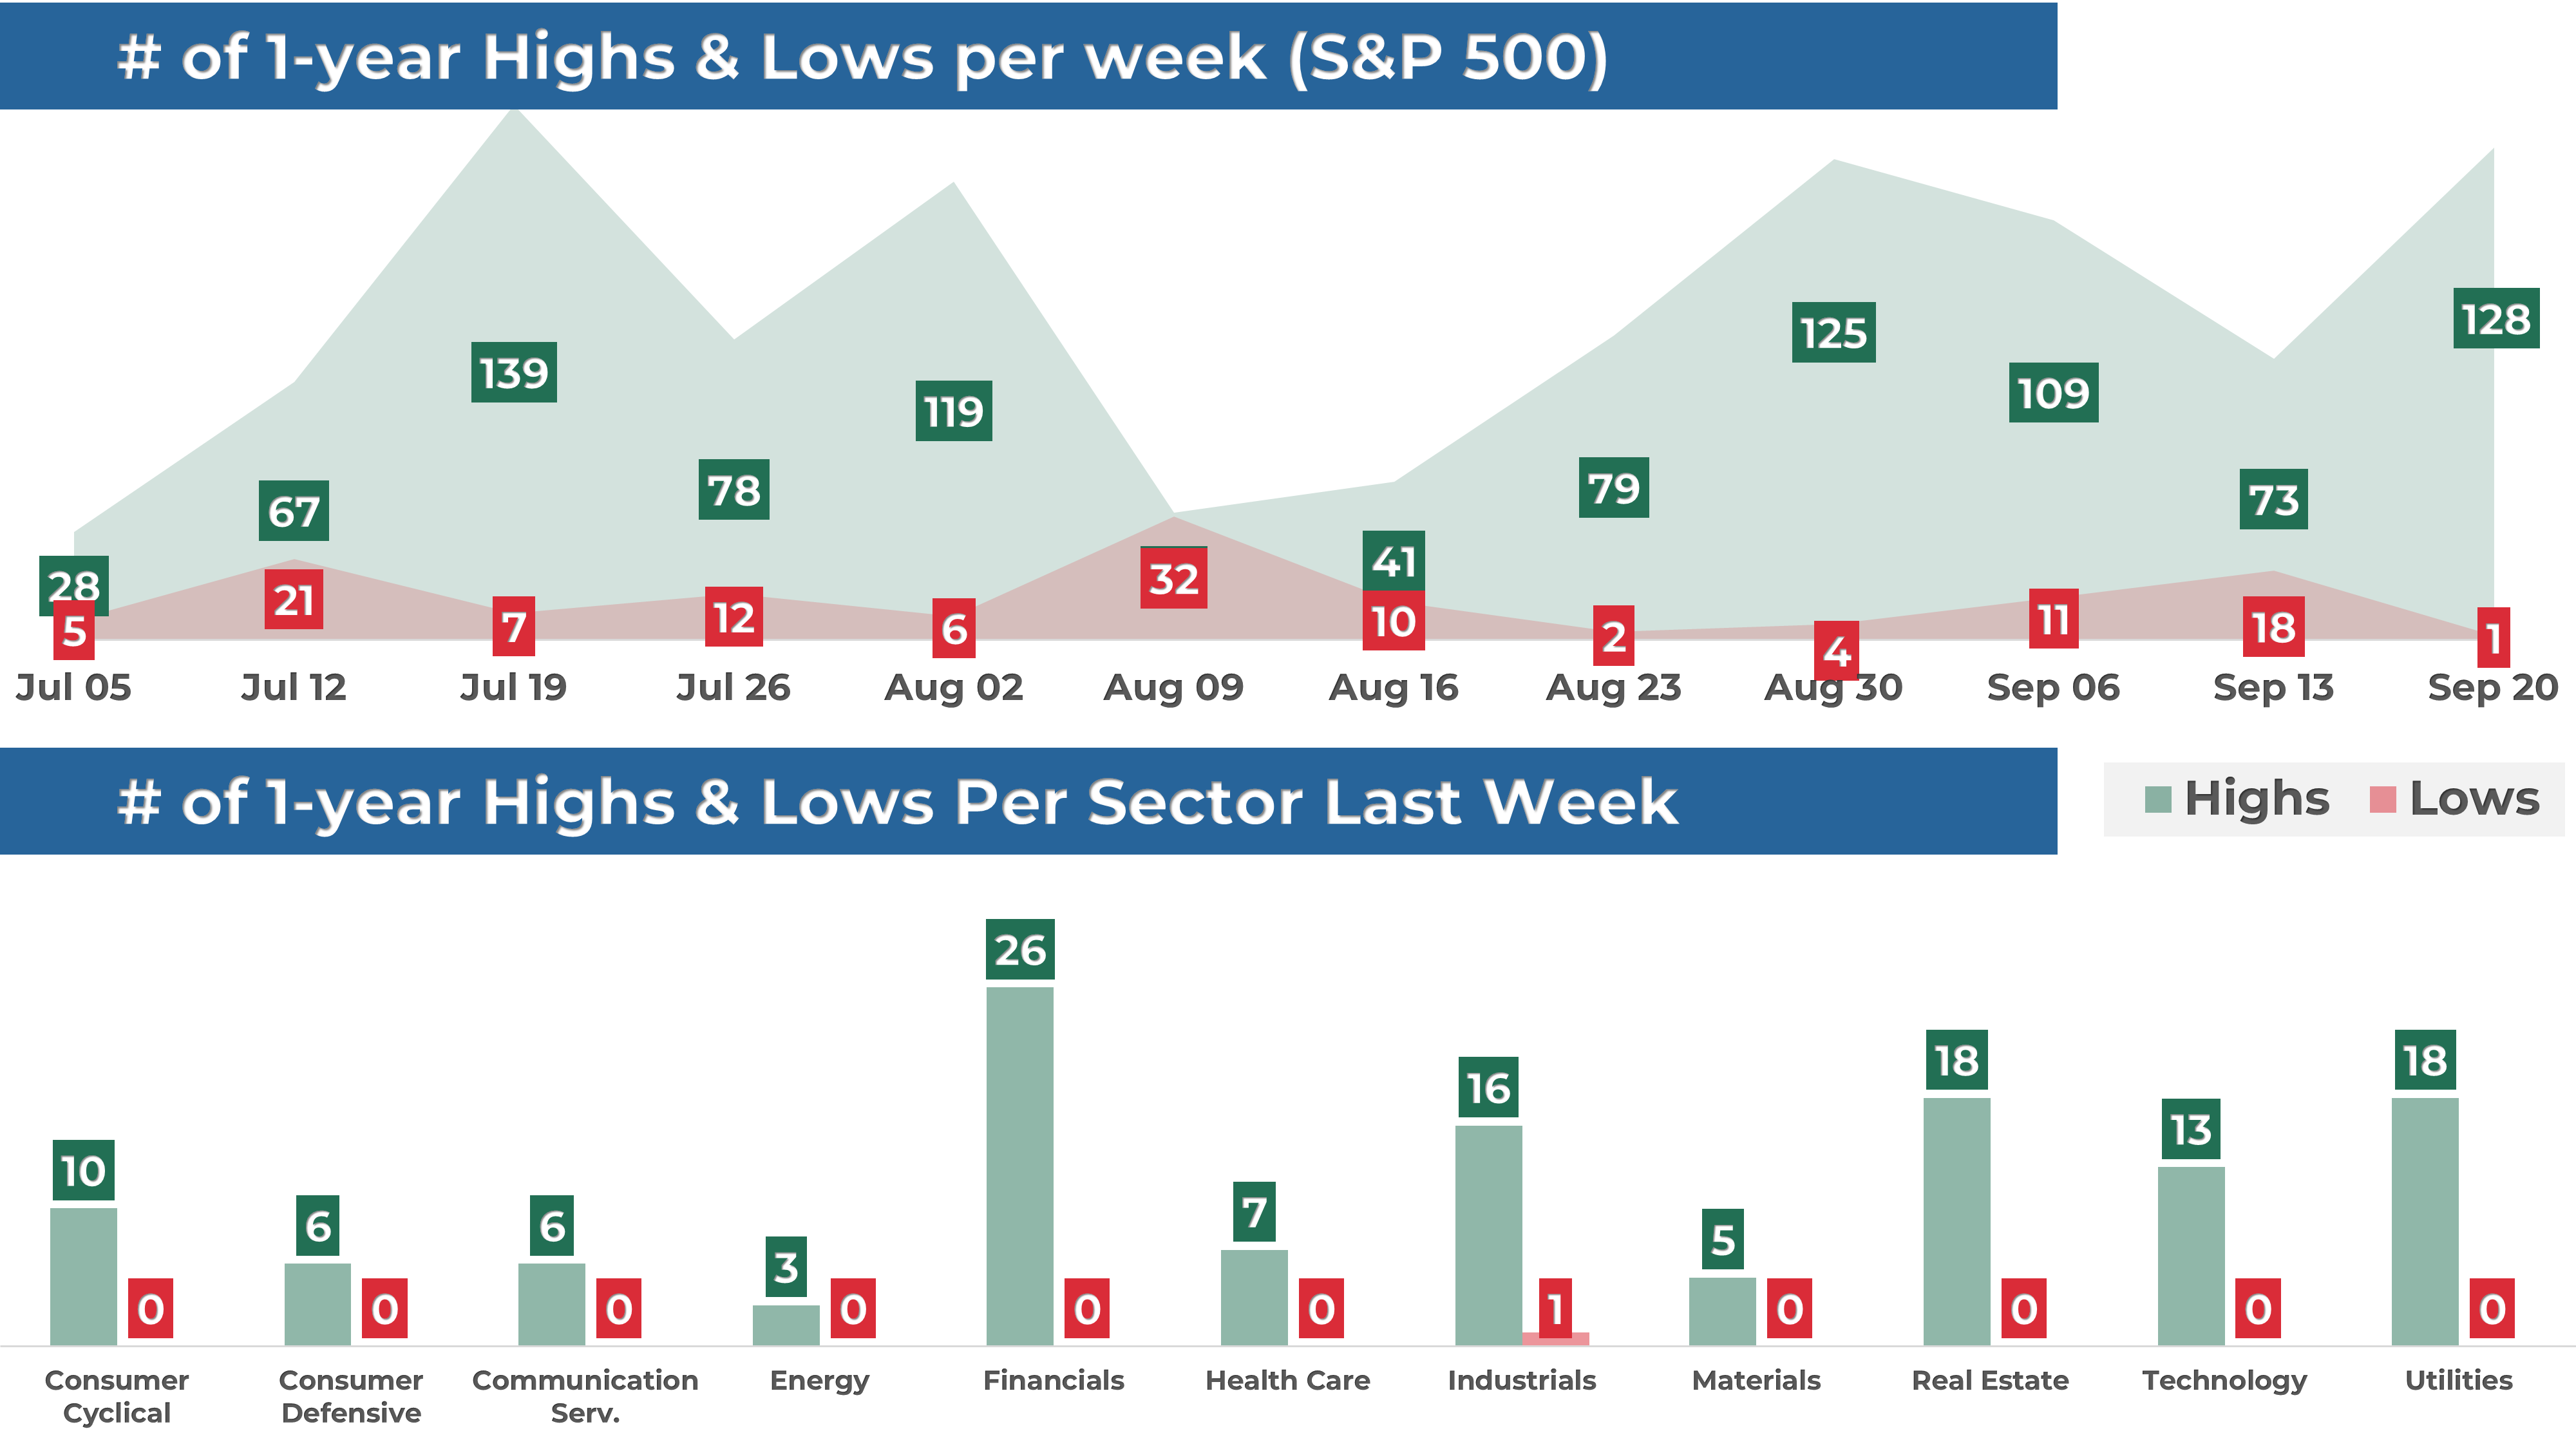
In addition, 128 stocks within the S&P 500 reached a new 52-week high, while 1 set new lows. Most of the highs this week came from the Financial sector.
MARKET TRENDS & MOMENTUM
1. S&P 500 Long-Term Trend
The long-term trend for the S&P 500 is positive. I base this evaluation on the 9 and 30-week exponential moving averages (EMAs). To determine if the trend is strongly positive, I look for the following conditions (the 1st is the most important):
9-week EMA is above the 30-week EMA: 🟢
Price is trading above the 9-week EMA: 🟢
Price is trading above the 30-week EMA: 🟢
The 9-week EMA trend line is rising: 🟢
The 30-week EMA trend line is rising: 🟢
I also use the MACD as an additional tool to detect trend changes. The MACD is close to its signal line, a neutral indication for the index.
2. S&P 500 Technical Analysis
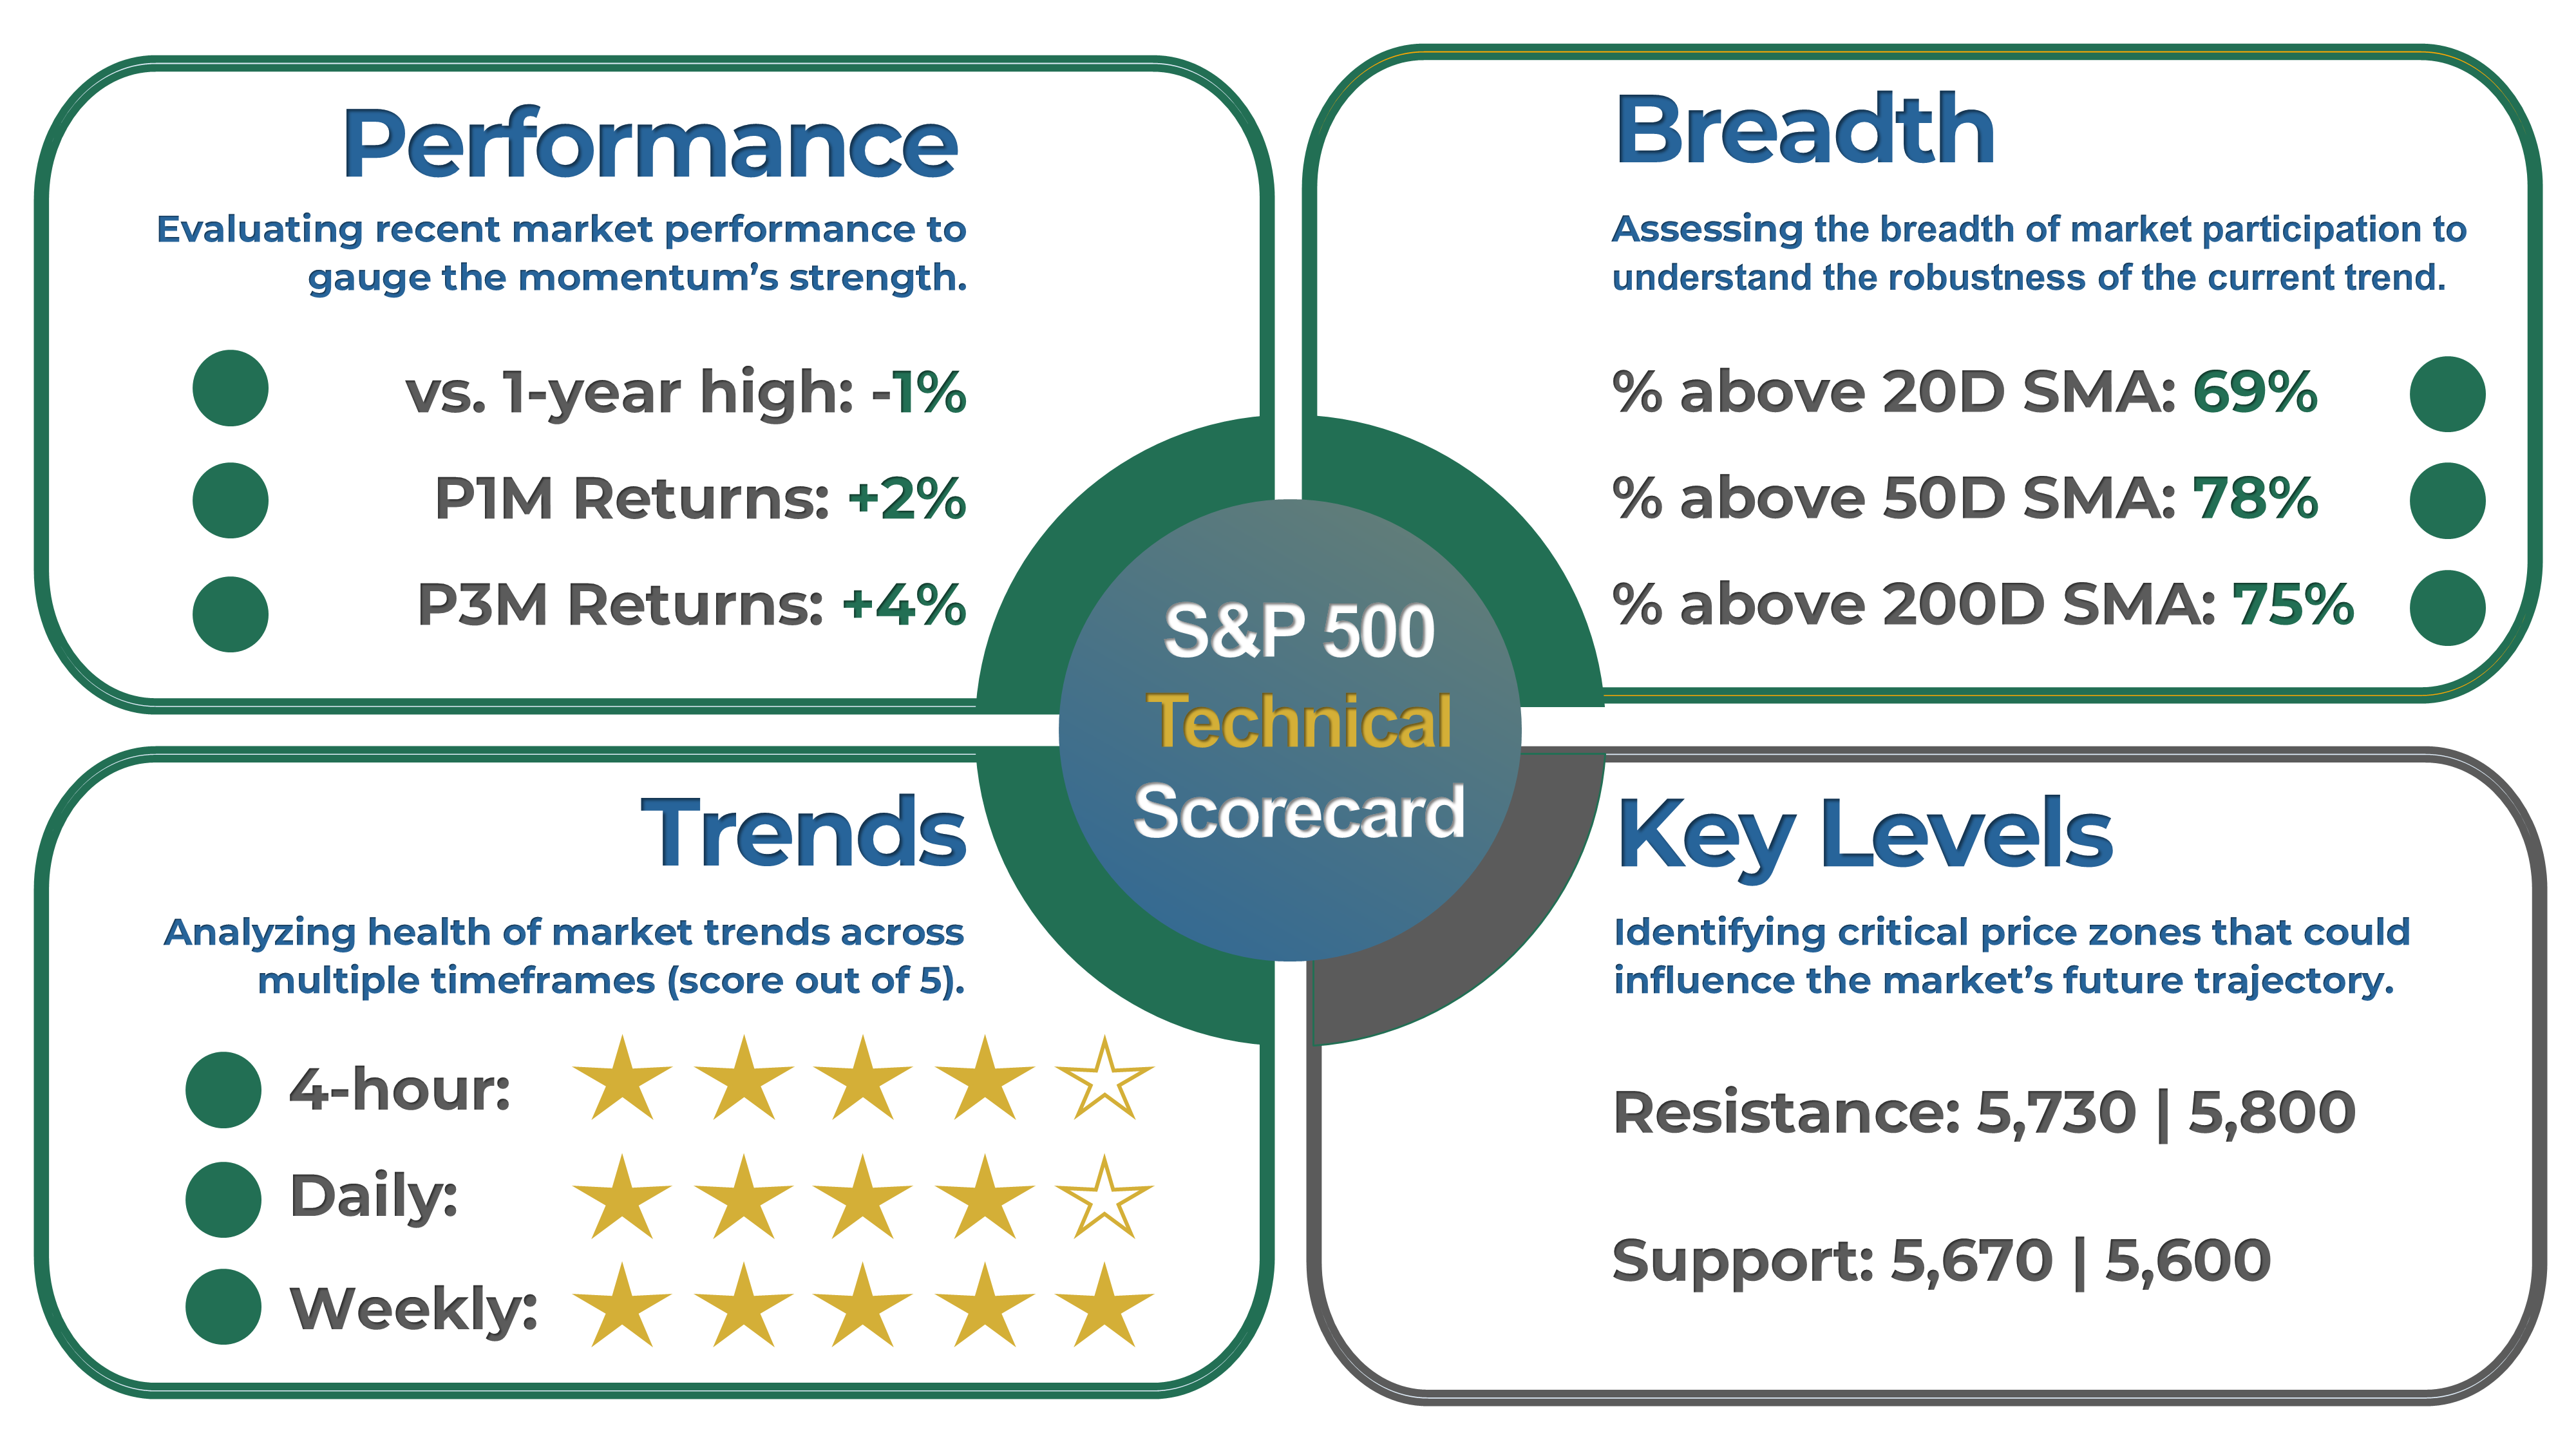
Healthy bull markets typically see the index set several new highs, broad market participation, and ascending trend lines. That's why I've created a four-part scorecard – a straightforward tool to give us a comprehensive view of these essential health indicators.
Momentum: The index is up 2% over the past month, 4% in the last three months, and is trading less than 1% away from its 52-week high.
Breadth: Market participation remains healthy in the long term, as 75% of S&P 500 stocks are trading above their 200-day moving average (SMA). Meanwhile, 69% of the stocks are trading above their 20-day SMA, up from 64% the previous week. A reading above 80% or below 20% typically indicates an overextended trend.
Trends: The trend on the 1-day and 4-hour charts is positive, with the index trading above its 21-period exponential moving average.
Key levels: The next resistance level is 5,730, then5,800. On the other hand, the next support areas are at 5,670, followed by 5,600.
3. Momentum Analysis of the Week
This week's momentum analysis is about the S&P 500 sectors' trends. I employ various performance metrics and technical indicators, which are then processed by my proprietary algorithm. I use this model here to rank the different S&P 500 sectors and identify those likely to outperform. Based on this approach, I've identified Utilities and Real Estate sectors as having the best relative momentum this week. I encourage fellow momentum traders to investigate this sector and its best-performing stocks.

EARNINGS RECAP
1. Q2 and Full Year 2024 Expected EPS & Revenue Growth
Q2 2024 earnings for the S&P 500 are expected to be up 13%. Excluding the energy sector, the figure is +14%.
Earnings are projected to grow by 10% in 2024, higher than the 9% growth seen on average over the last decade. In the past four weeks, 45% of earnings revisions made by analysts were to increase their outlook.
The forward 4-quarter P/E ratio is 22.1, higher than the average over the past five and ten years.
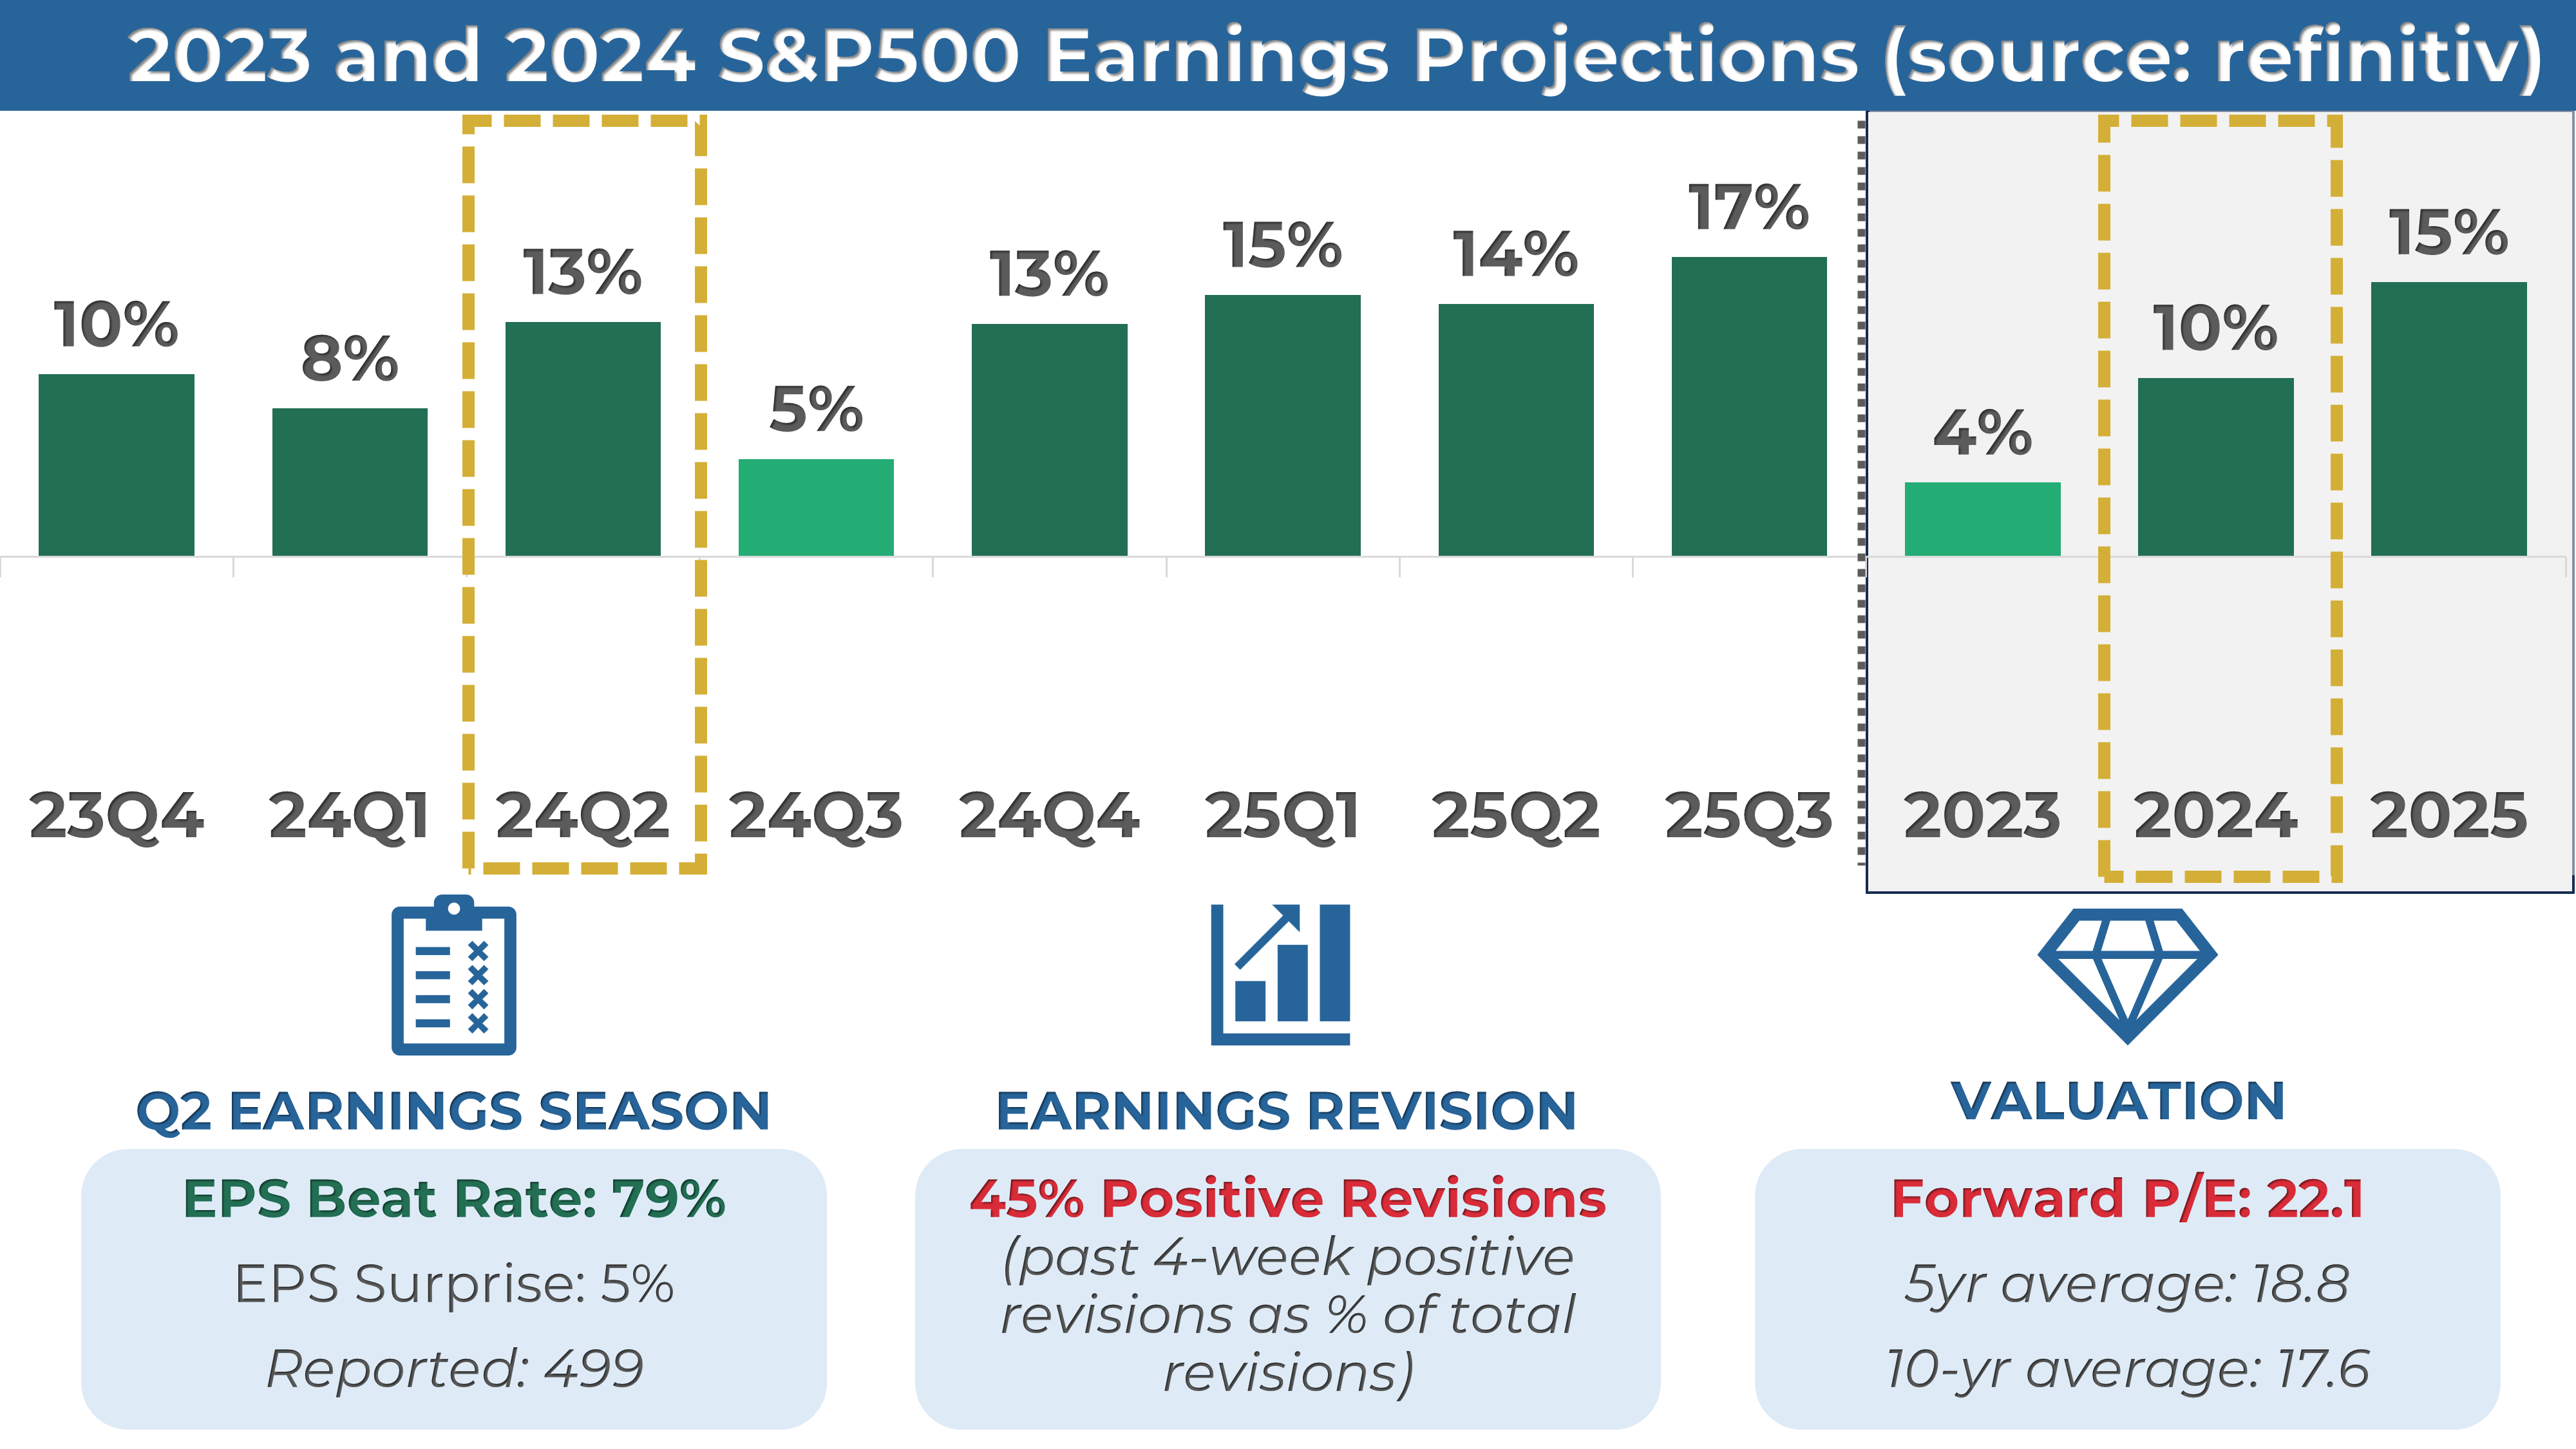
2. Q2 Earnings Season Summary
499 companies from the S&P 500 index have released their second-quarter earnings, with 79% posting higher EPS than expectations. This is in line with the previous four-quarter average of 79% and higher than the historical average of 67%.
MARKET SENTIMENT
Measures of investor sentiment can be helpful as they provide insight into the views and opinions of professional or individual investors. However, it's important to note that these measures are not perfect predictors of market movements. They should be combined with other indicators and analysis tools for a complete market picture.
1. AAII Sentiment Survey (Individual Investors)
The American Association of Individual Investors (AAII) conducts a weekly survey among its members to gauge their expectations for the stock market over the next six months. The results are published every Wednesday.
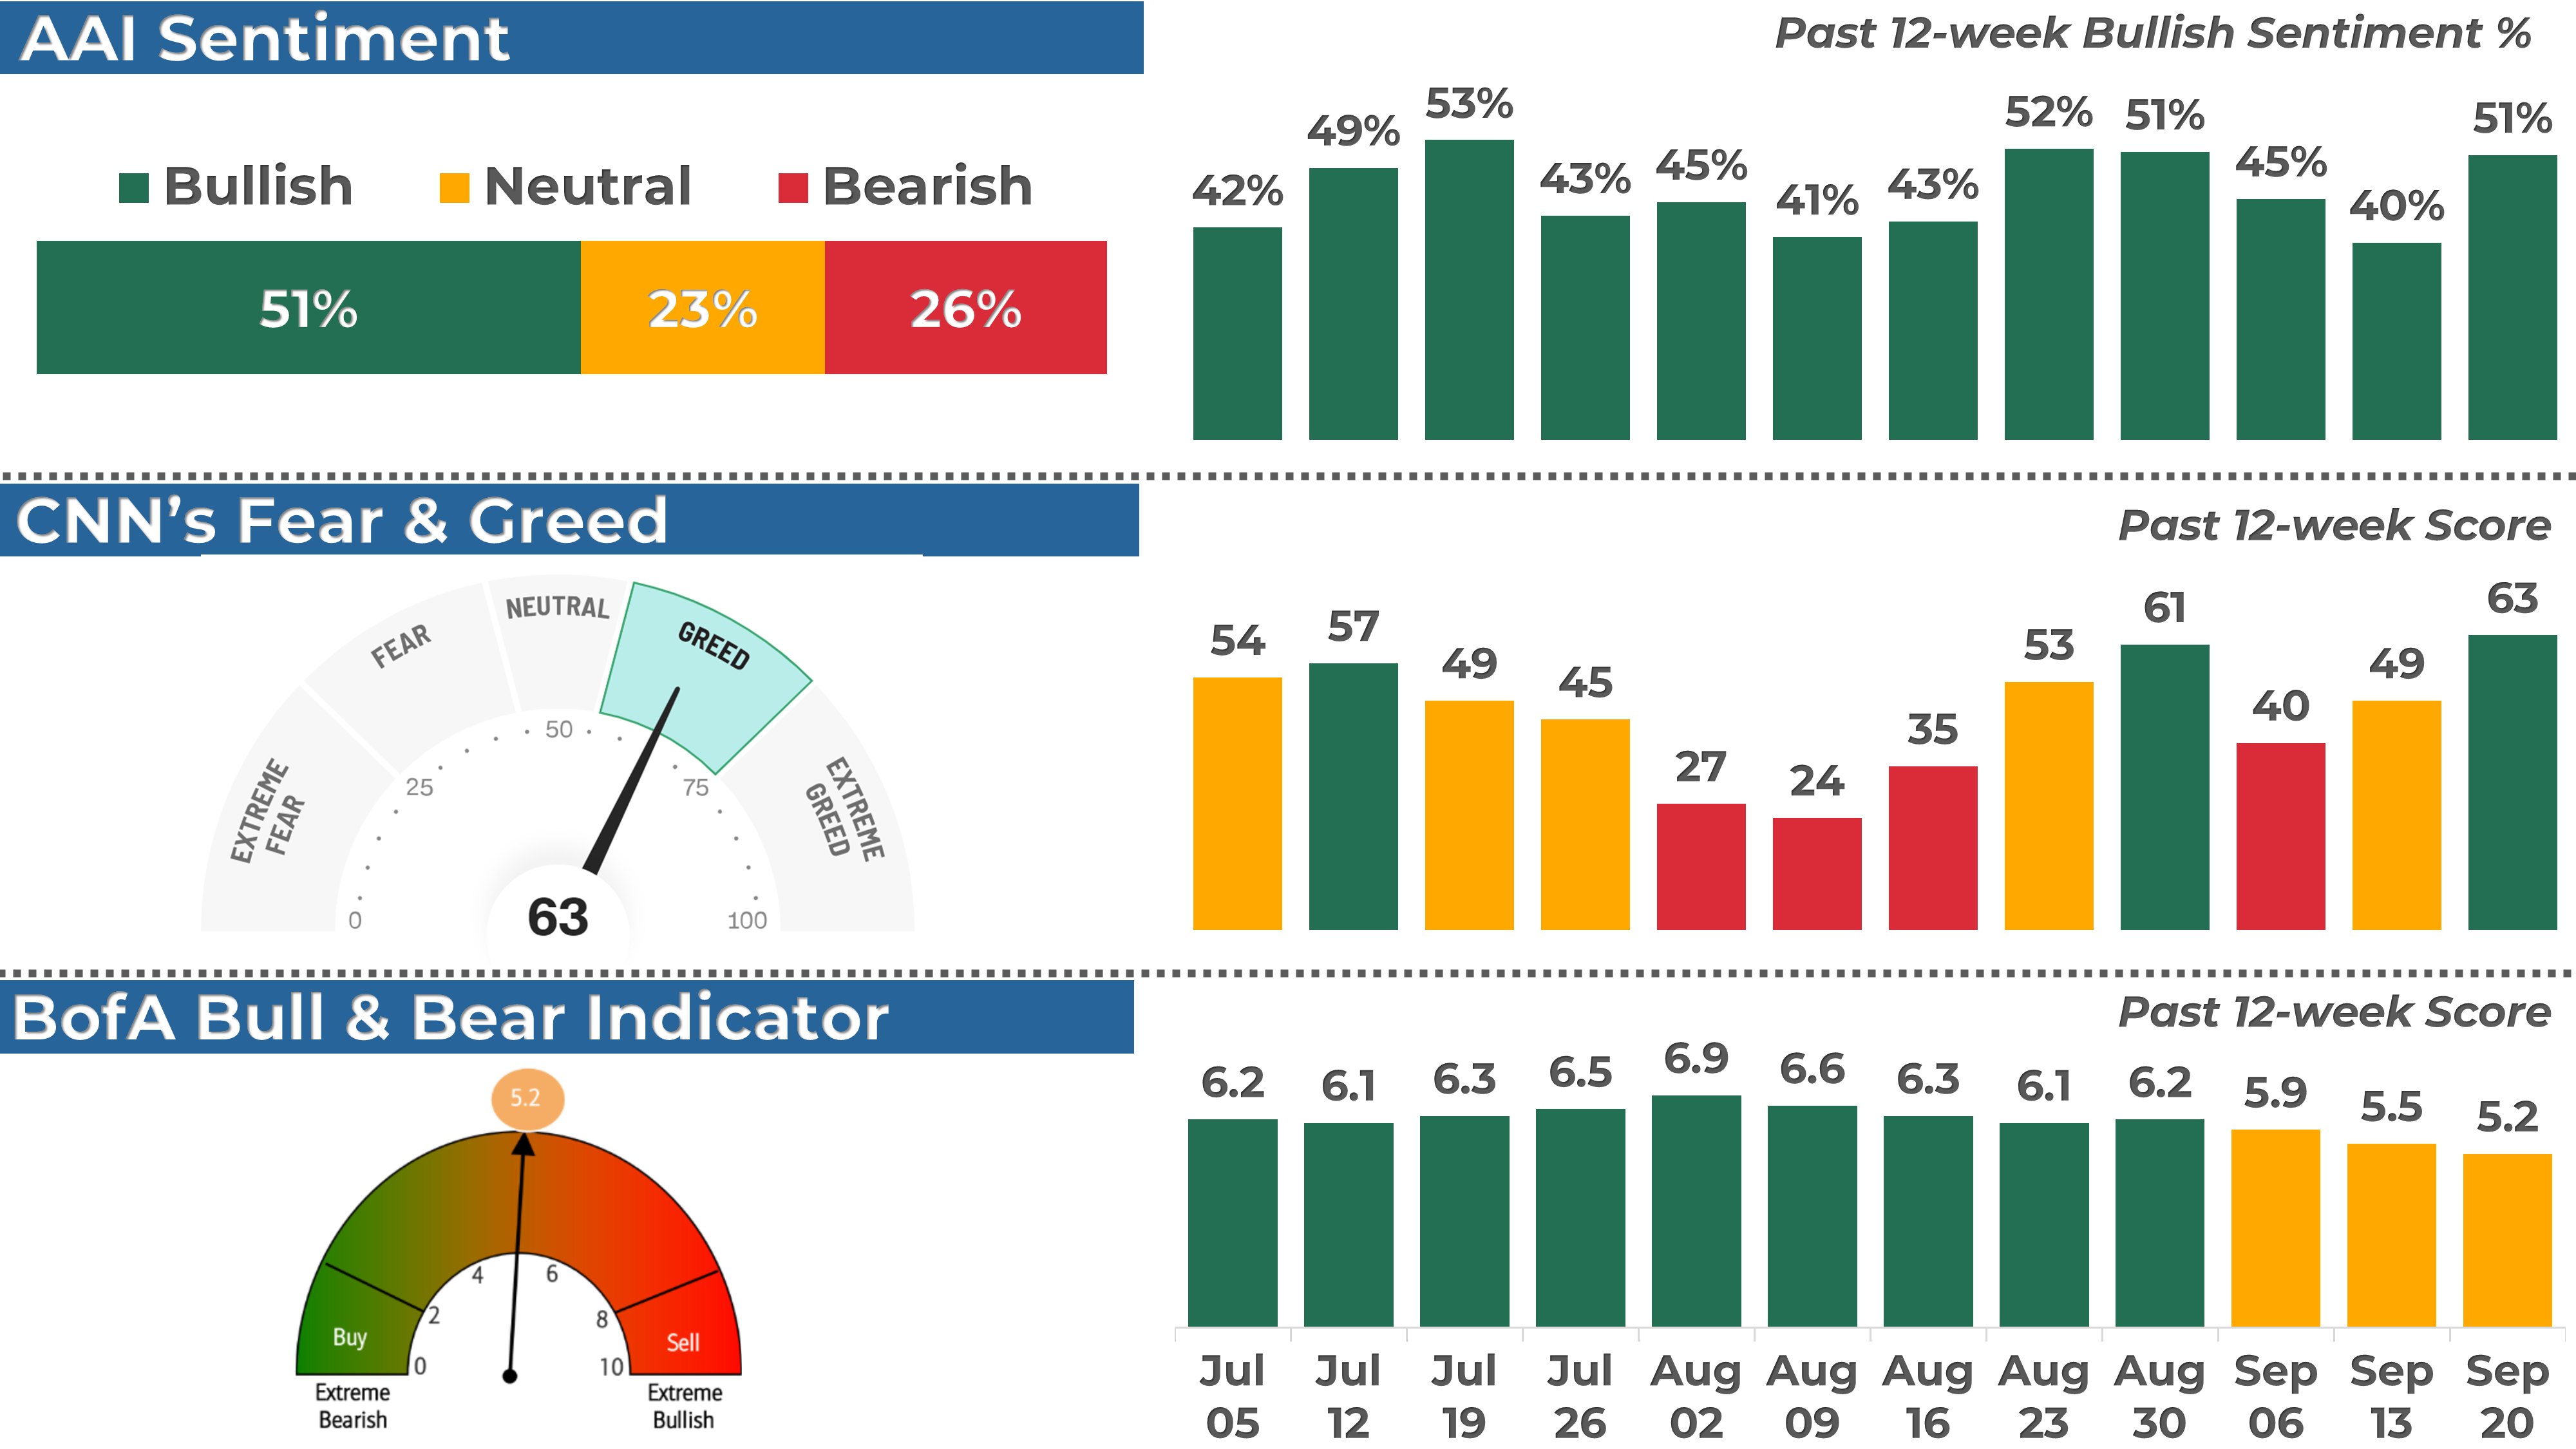
According to the most recent AAII survey, 51% of the respondents had a bullish outlook on the stock market, increasing by 11 points from the previous week.
2. BofA Bull & Bear Indicator (Institutional Investors)
The Bank of America Bull-Bear Indicator is a proprietary measure of investor sentiment developed by Bank of America. It is based on a survey of fund managers and institutional investors, and it tracks the percentage of respondents who are bullish, bearish, or neutral on the stock market. Results are published in the form of a score ranging from 0 (extremely bearish) to 10 (extremely bullish)
The latest reading available of the indicator was 5.2, a neutral sentiment reading.
3. CNN Fear & Greed Index (Technical)
The CNN Fear & Greed Index is a daily measure that analyzes seven market indicators to assess how emotions influence investors' decisions. The index is scored out of 100 and categorizes results into five stages: Extreme Fear, Fear, Neutral, Greed, and Extreme Greed.
The index closed at 63, or a “Greed level, up from 49 last Friday.
THE WEEK AHEAD
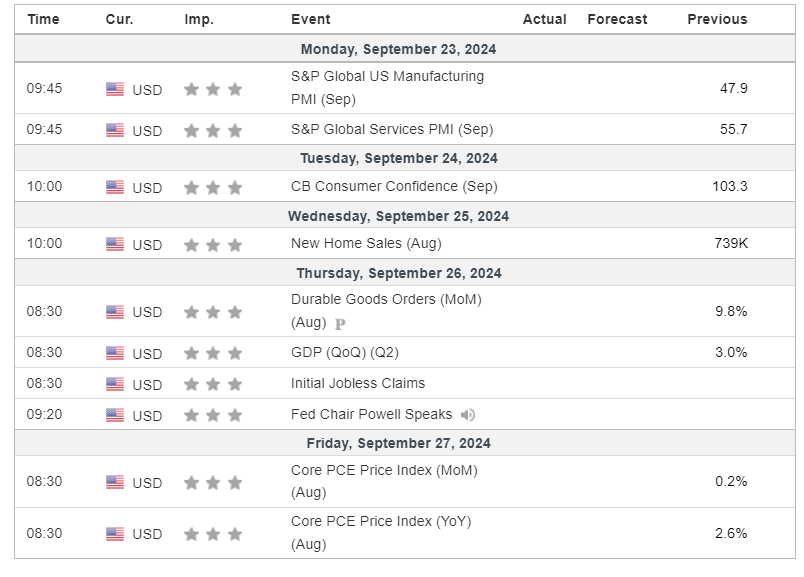
1. Economic Calendar
On deck next week is another GDP update for Q2, which the market will watch closely as recession fears remain high. The Personal Consumption Expenditures (PCE) Price Index, the Fed's favorite measure of inflation, will be released on Wednesday.
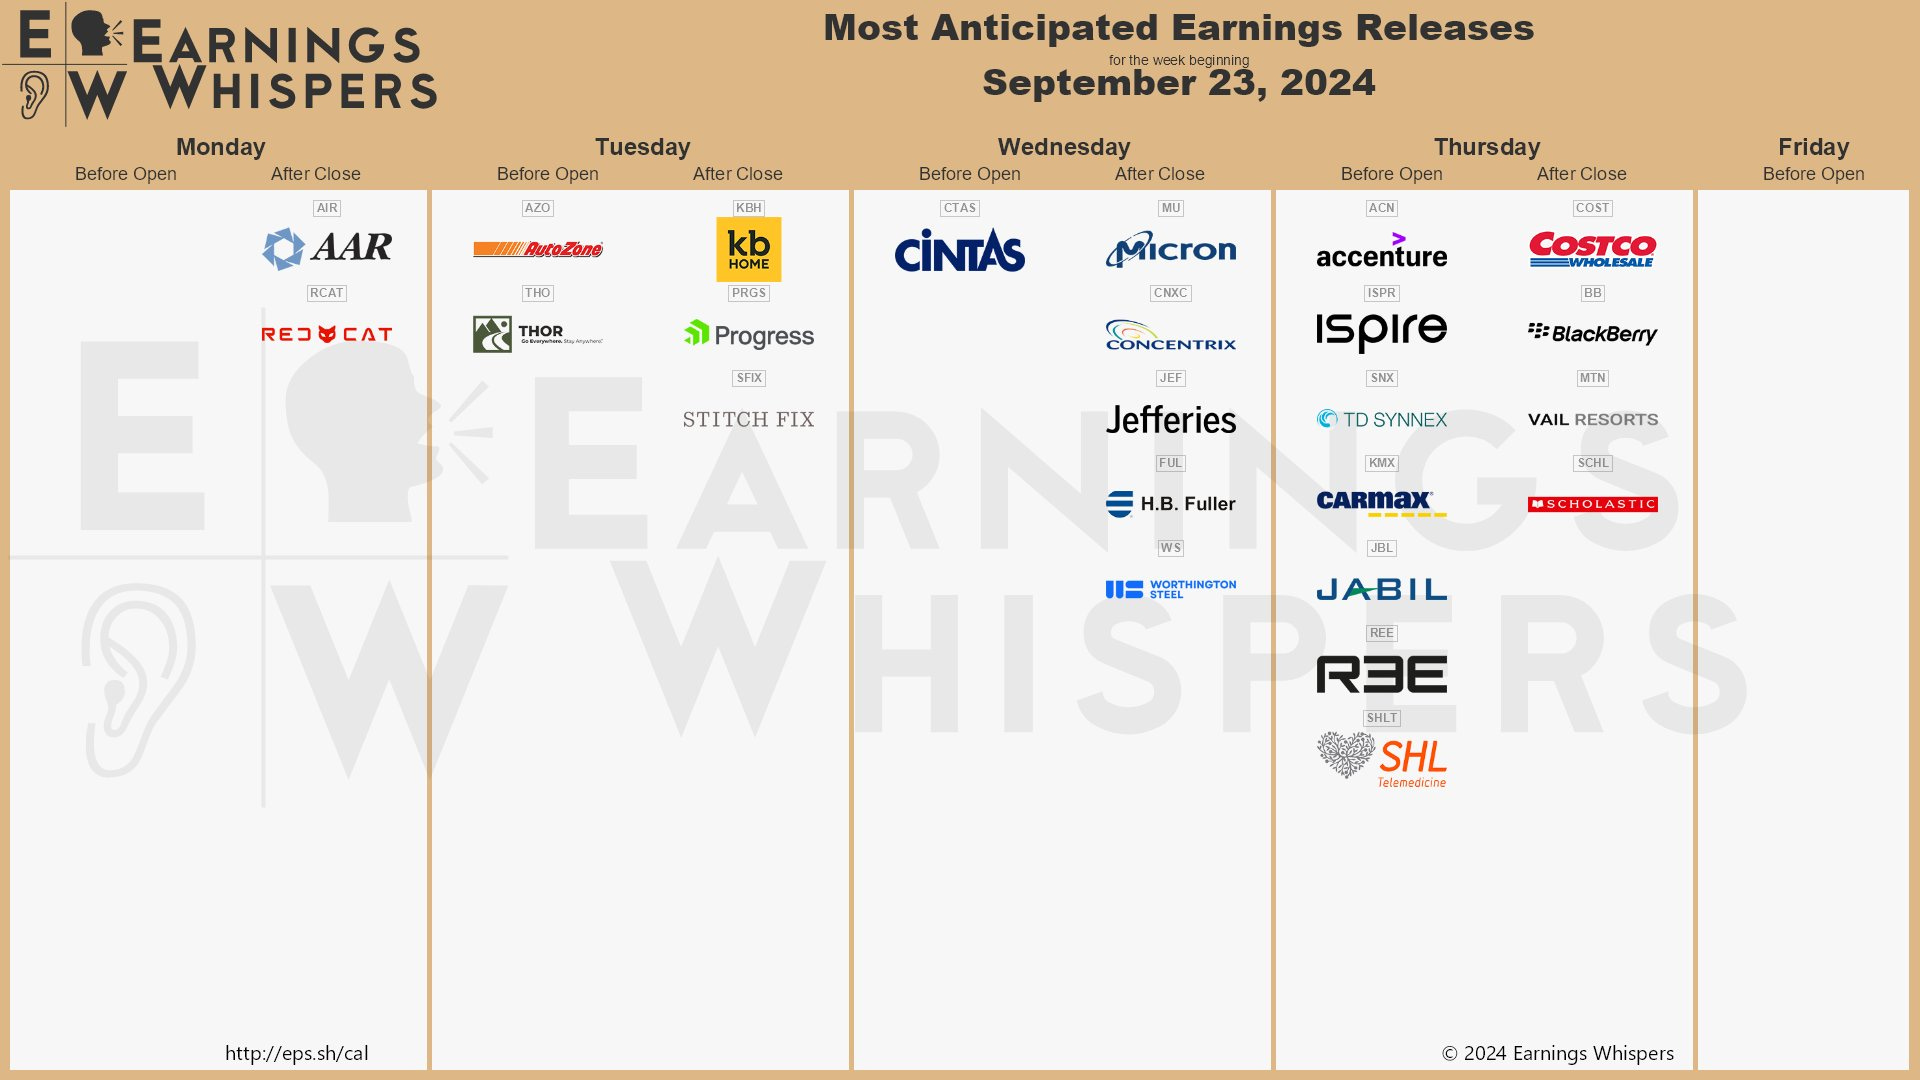
2. Earnings Calendar
Earnings season continues next week, and 7 companies from the S&P 500, including Costco and Micron, are expected to release their quarterly results.
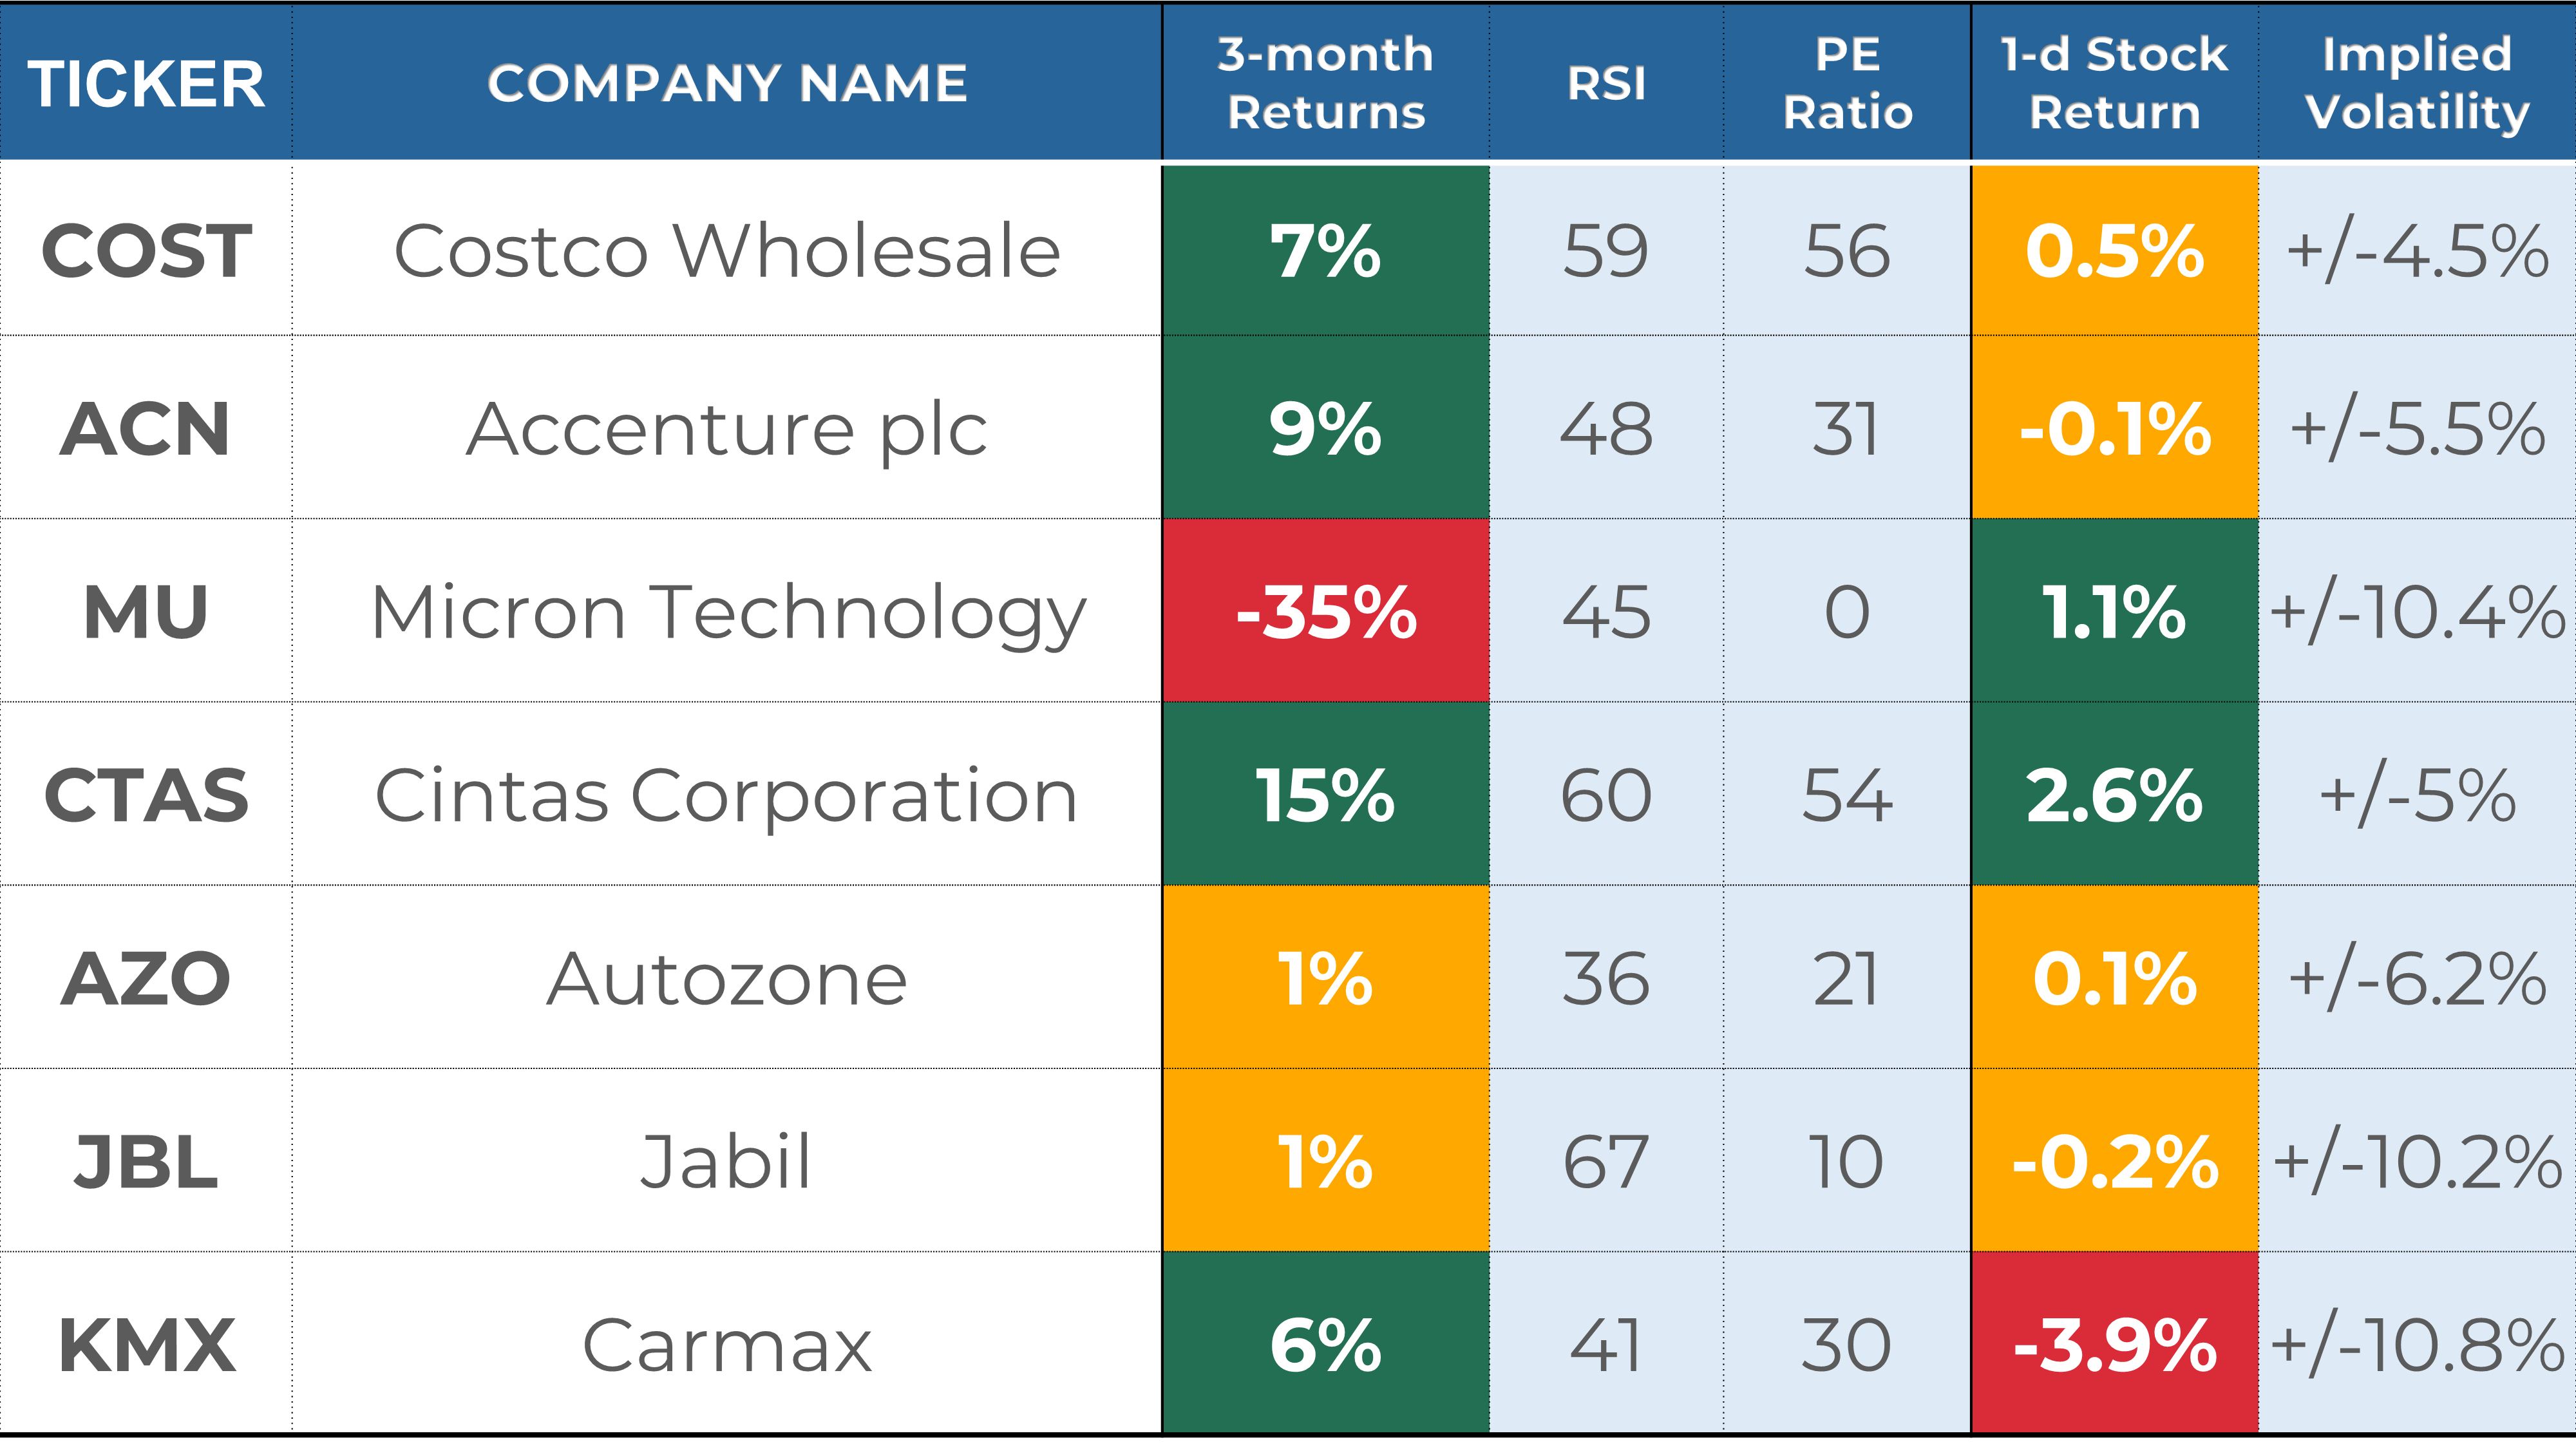
3. Next Week’s Earnings Watchlist
Below is my watchlist of stocks reporting week next week, along with several key indicators I like to review:
Stock Indicators:
Stock performance in the last 3 months.
RSI, where a reading of 70 indicates overbought status and a reading of 30 oversold.
PE ratio, where a reading below 25 indicates a "cheap" valuation and/or low growth expectations.
Stock Price Reactions to Earnings:
1-day Stock Return on Earnings is the stock performance on the earnings release date.
Implied volatility is the expected 1-day stock change after earnings are released, as assessed by the options markets.
Every week, I share my analysis of 1 stock reporting earnings in the coming days, focusing on implications for long-term investors. This week, I prepared an in-depth overview of Costco ($COST). In this post, I break down key data points around Costco’s fundamentals, stock returns, analyst ratings, and past earnings performance to help you make informed investment decisions. Check out the post and learn why I gave a “HOLD” rating to Costco.

That’s a wrap for this week’s recap! I hope it helped you understand the market better.
If you enjoyed this post, you should explore the premium section: I provide my short-term trading and analysis of over 20 US large caps and share my long-term investing portfolios. Upgrade your subscription to unlock all the exclusive features and insights.
If you have any questions or feedback, please don't hesitate to email me or comment on this post. Your support helps me create high-quality content and is greatly appreciated!
Have a great week!
My Weekly Stock
DISCLAIMER
The information provided in this newsletter is for informational purposes only and should not be taken as financial advice. Any investments or decisions made based on the information provided in this newsletter are the reader's sole responsibility. We recommend that readers conduct their own research and consult a qualified financial professional before making investment decisions. The author does not assume any responsibility for any losses or damages arising from using the information provided in this newsletter.
Yup!