
Momentum Review: Macro Segments (Aug 2025 Edition)
Dear readers,
Welcome back to My Weekly Stock, where in-depth market analysis meets proven momentum-based trading strategies. My mission? To help you win in the markets with unbiased, data-driven insights you can act on.
This mid-week update is all about my momentum review. Each week, I analyze a different curated list of ETFs or stock tickers covering either key market segments, sectors, or individual stocks. I focus on understanding where we are in the cycle with a mid-to-long-term perspective. My momentum model combines 3 elements: performance, trend, and key levels. This structured approach helps identify strengths, weaknesses, and emerging opportunities across various market segments.
If you want the full experience, consider upgrading your subscription. Paid members get access to all my portfolios, real-time trade alerts, in-depth analysis, and a clear momentum-based framework you can follow and learn from. If you’re ready to give it a try—or just want to support my work—this is your chance!
Let’s go!
SUMMARY
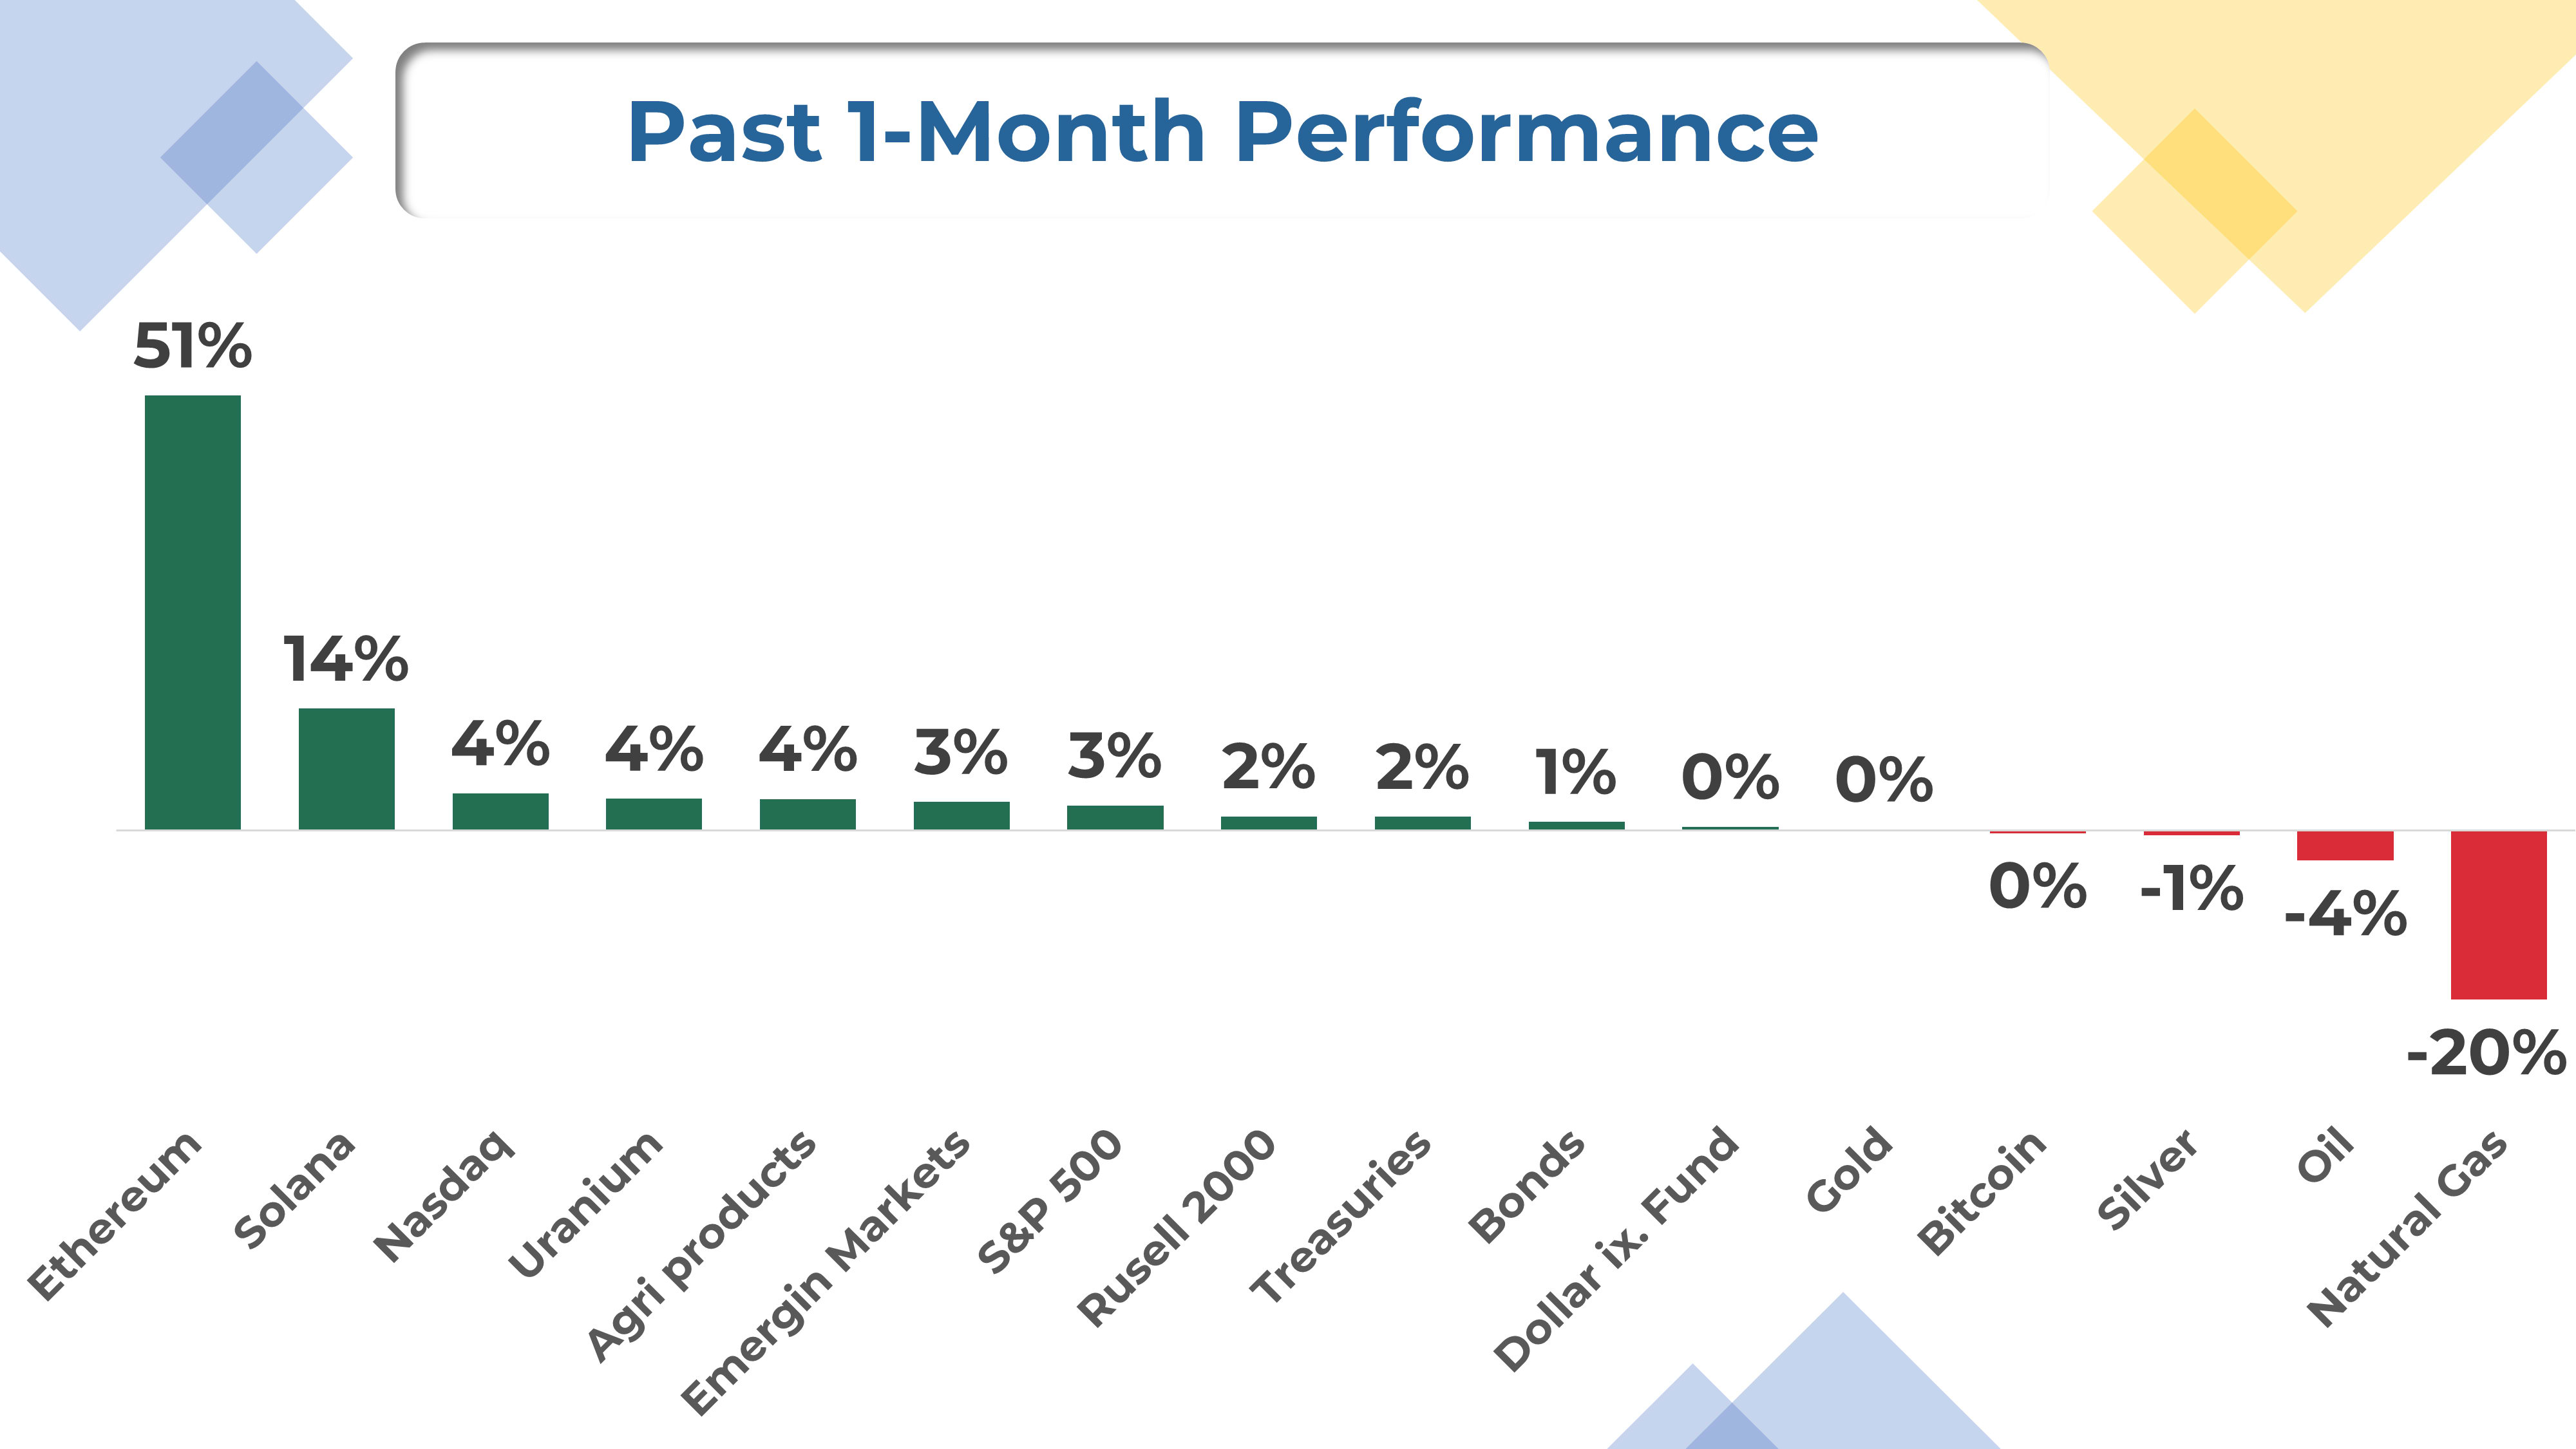
The "everything rally" continues with equities, metals, and crypto all well anchored in their uptrends. The S&P 500 and Nasdaq, in particular, just had a healthy consolidation, with a shallow pullback that was quickly bought. We've already pushed back to all-time highs, and yesterday's CPI helped trigger a breakout.
This strength will likely carry us into the September FOMC, where we could face a real test, especially if the Fed turns more hawkish than the market currently expects. Until then, there is no point in fighting the trend, and my plan is to ride it. And, if history is any guide, a healthy bull market should still have more upside ahead. That said, it doesn't mean the next leg will be as smooth as the past four months, and I expect some bumps along the way.
My Analytical Approach
My momentum framework is divided into three parts: performance, trends, and key levels.
I like to see securities trading within 5% of their 1-year high, which indicates strong momentum and minimal overhead resistance. Additionally, I look for signs of accelerating gains in recent periods.
I assess the strength of a ETF’s weekly chart using a trend rating system on a scale of 1 to 5. A score of 3 or above indicates a strong trend worth holding. A score of 2 or below signals weakening momentum and suggests preparing an exit plan.
My trend rating is based on five criteria centered around the 9- and 30-week exponential moving averages (EMAs):
The 9-week EMA is above the 30-week EMA (most important).
Price is trading above the 9-week EMA.
Price is trading above the 30-week EMA.
The 9-week EMA trend line is rising.
The 30-week EMA trend line is rising.
In the core of an uptrend, the 9-week EMA often acts as support, while a confirmed loss of the 30-week EMA with no reaction typically suggests a trend change on the horizon.
I complement my analysis by looking at key levels. Support and resistance levels are critical technical analysis components, serving as indicators for potential trend reversals or continuations. My preferred method is to look for previous highs and lows, any levels where the trend has historically changed, and price gaps.
Why This Framework?
I developed this framework to ride uptrends confidently and to filter out noise from the price action. Breakouts can be messy—ranging markets, failed breakouts, and sharp reversals are all challenges we face as swing traders. Even the best uptrend on paper can be challenging to trade in real life.
My analysis approach helps me manage my positions effectively. Even if you don’t own any tickers below, you can adapt parts of this framework to navigate the market more confidently.
Watchlist
In this post, I will cover 16 ETFs, each tracking different segment of the market, including:
Equity Index:
$SPY (SPDR S&P 500 ETF) – S&P500
$QQQ (Invesco QQQ Trust) – Nasdaq
$IWM (iShares Russell 2000 ETF) – U.S. small-cap
$EEM (iShares MSCI Emerging Markets ETF) – Emerging markets
Fixed-Income:
$BND (Vanguard Total Bond Market ETF) – U.S. investment-grade bonds
$TLT (iShares 20+ Year Treasury Bond ETF) – Long-term U.S. Treasuries
$UUP (U.S. Dollar Index) – U.S. dollar currency exposure
Crypto:
BTCUSD (Bitcoin)
ETHUSD (Ethereum)
SOLUSD (Solana)
Commodities:
$USO (United States Oil Fund) – Crude oil
$UNG (United States Natural Gas Fund) – Natural gas
$URA (Uranium ETF) – Uranium
$GLD (SPDR Gold Trust) – Gold
$SLV (iShares Silver Trust) – Silver
$DBA (Invesco DB Agriculture Fund) – Agriculture
Momentum Analysis
Equity Index & Bonds
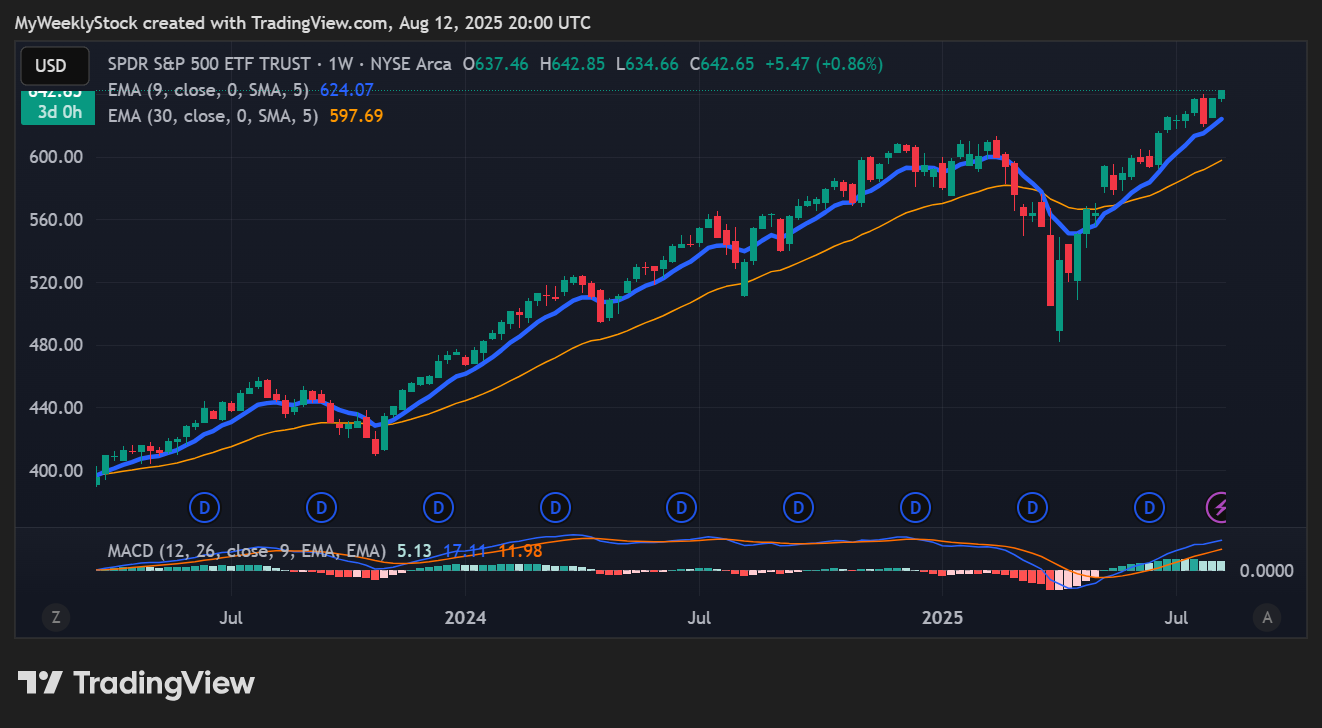
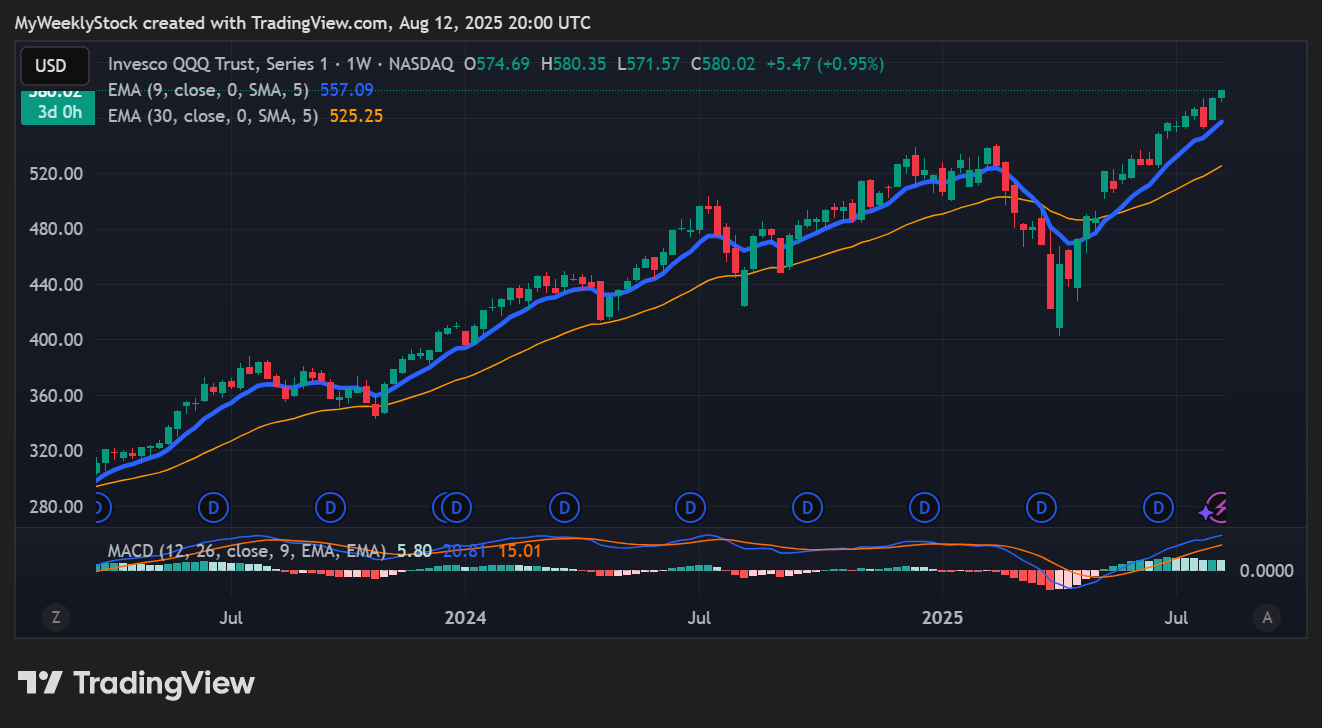
In all the charts below, the 9-week EMA is in BLUE, while the 30-week EMA is in YELLOW.
My Rating: “WATCH” means interesting set-up in formation but too early to invest.
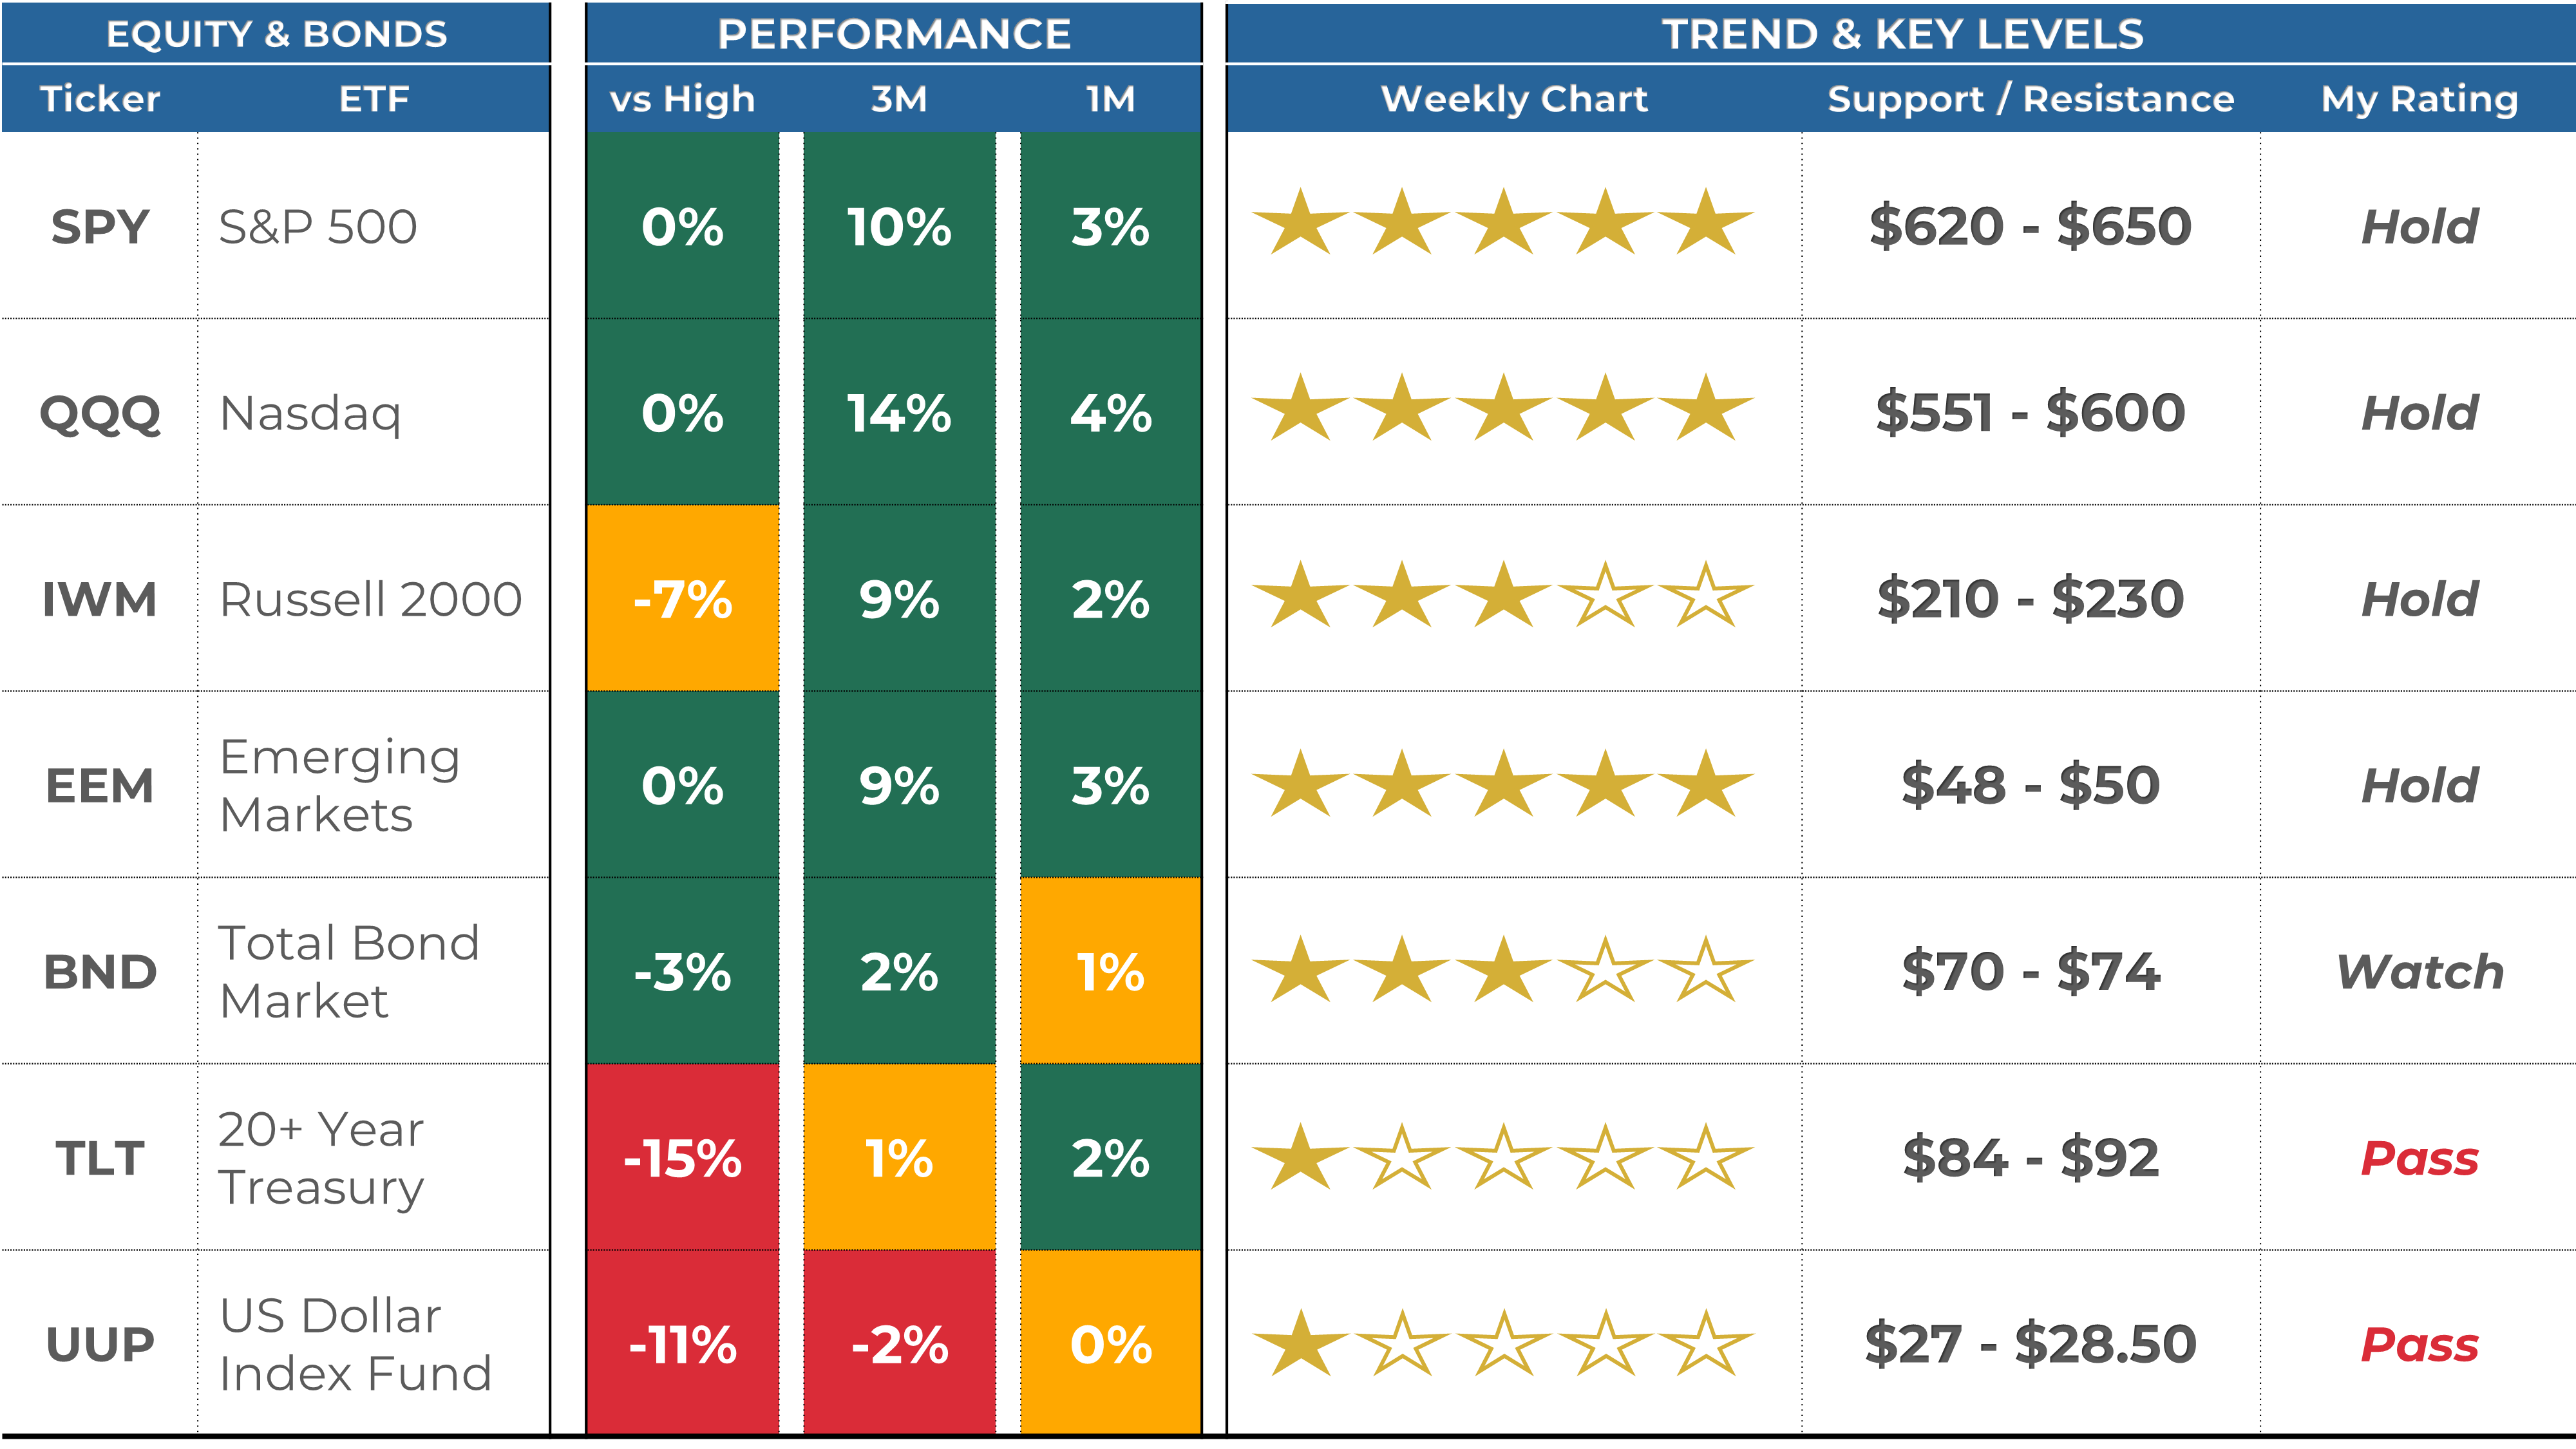
$SPY (SPDR S&P 500 ETF): ⭐️⭐️⭐️⭐️⭐️ (stable vs last month)
Remains well anchored in the uptrend, and the recent dip has been bought again. The rally has stalled at 640 over the past three weeks, but wefinally clear that level yesterday.
$QQQ (Invesco QQQ Trust) ⭐️⭐️⭐️⭐️⭐️ (stable vs last month)
Somewhat similar with even stronger momentum here. It’s positive we cleared the 575–580 area, if that holds, we should see some bullish continuation.
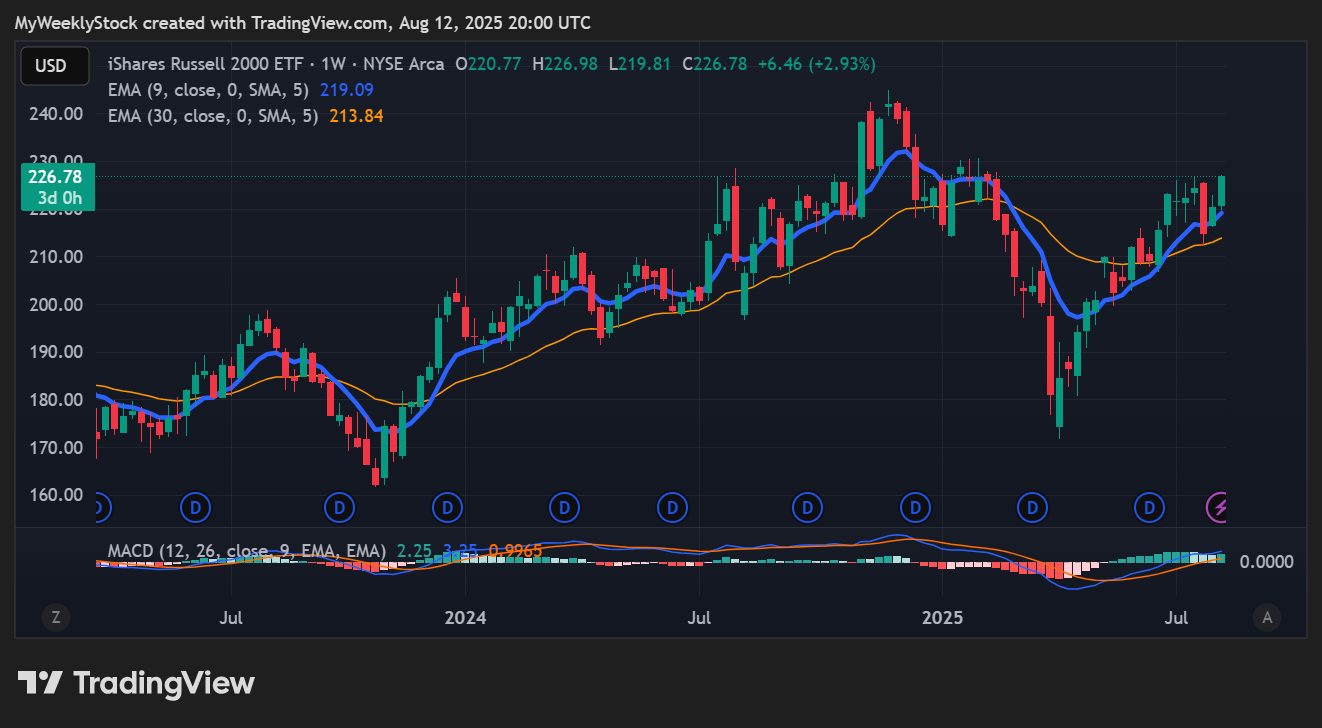
$IWM (iShares Russell 2000 ETF) ⭐️⭐️⭐️(stable vs last month)
Small caps have been lagging for quite some time now and remain far from previous highs, with significant overhead resistance along the way. But I do like the potential upside if it can finally show some relative strength.
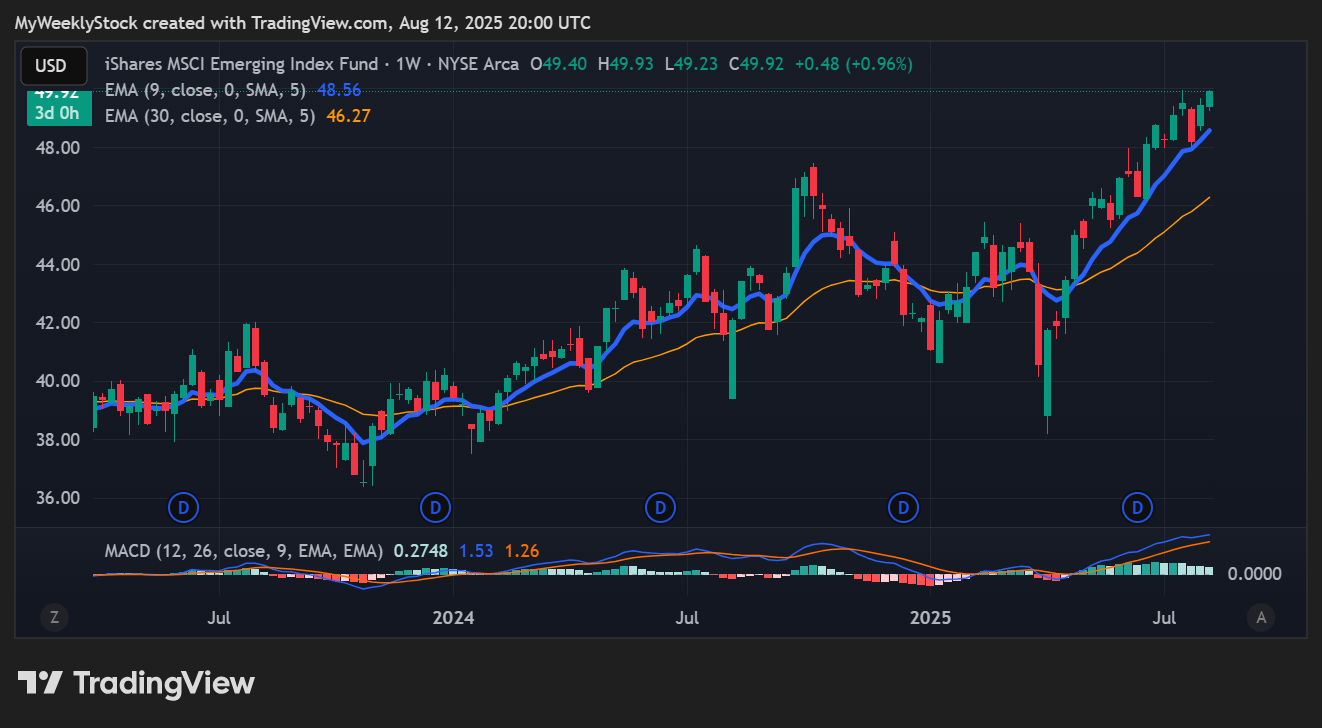
$EEM (iShares MSCI Emerging Markets ETF) ⭐️⭐️⭐️⭐️⭐️(stable vs last month)
Strong momentum, but we’ll need to sustain a move above the $50 mark next.
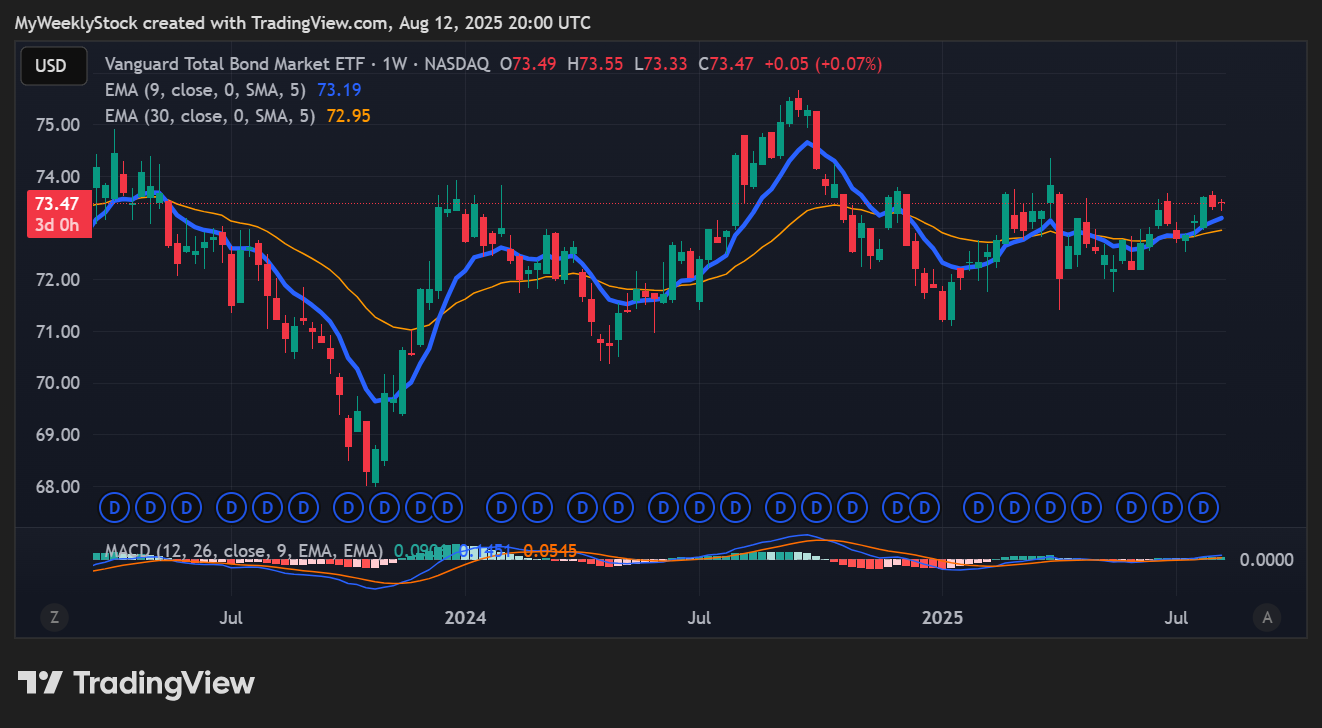
$BND (Vanguard Total Bond Market ETF) ⭐️⭐️⭐️ (improving vs last month)
Early signs of strength as we broke above the 9- and 30-week EMAs. But stepping back, we’re still stuck in a range that’s close to a year old.
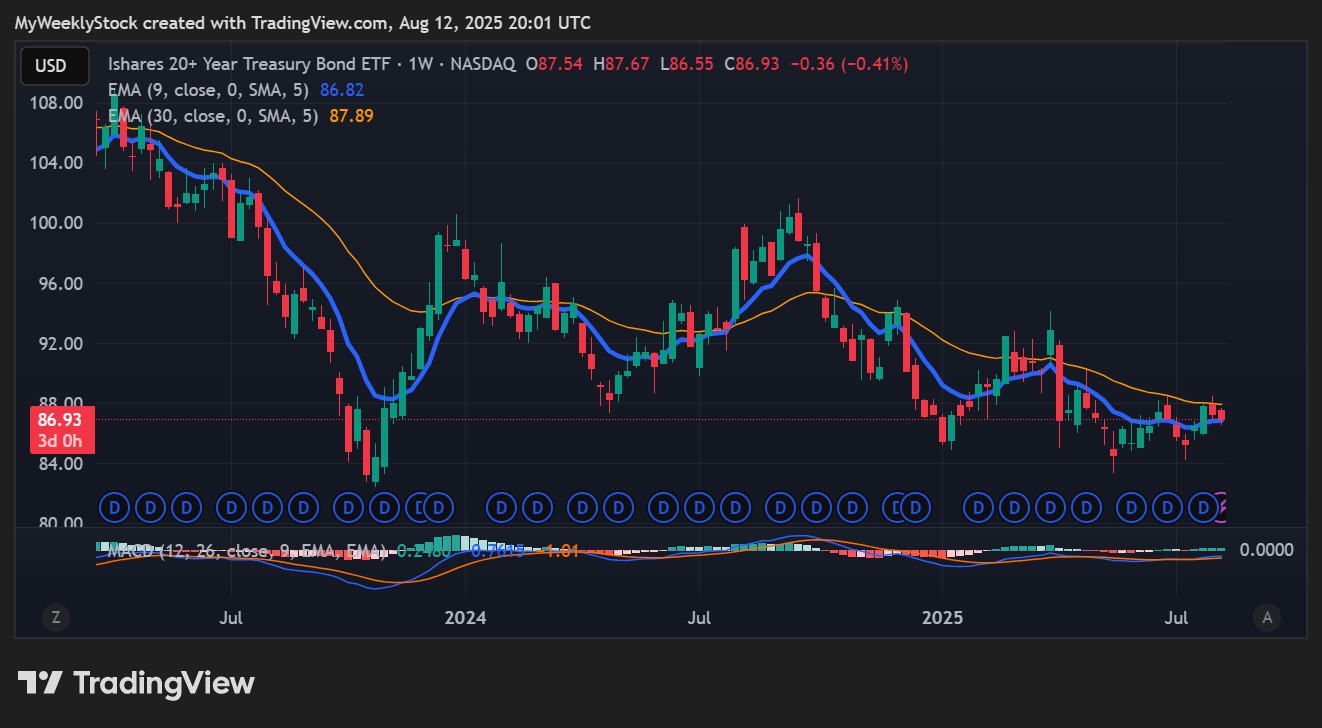
$TLT (iShares 20+ Year Treasury Bond ETF) ⭐️(stable vs last month)
Still stuck in the negative downtrend, although we’ve stabilized above the 84 support. It must post a higher high, ideally above $92, to feel more confident that momentum has shifted. The next FOMC meeting could be the catalyst it needs.
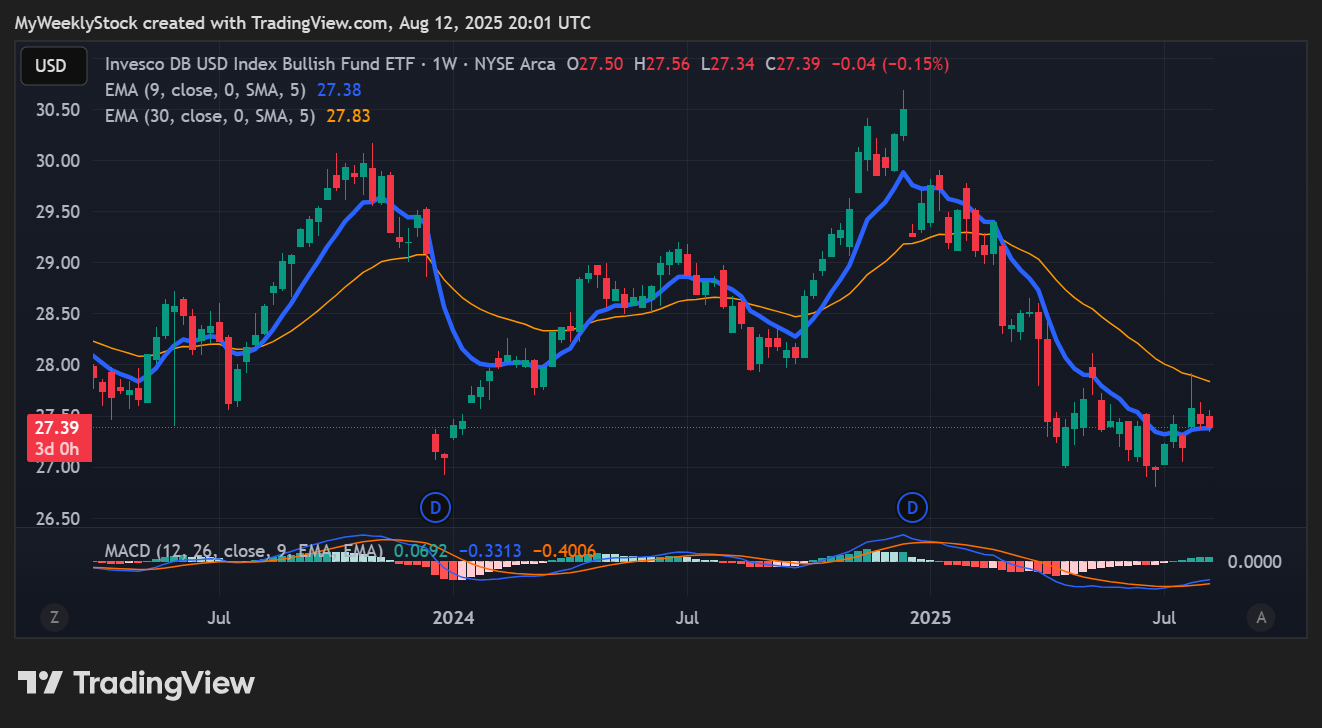
$UUP (U.S. Dollar Index) ⭐️(improving vs last month)
Somewhat similar. Downward pressure has eased after finding good support around $27. Still, I’d need to see a higher high, above $28.50, to confirm the negative downtrend is over.
Commodities & Crypto
Keep reading with a 7-day free trial
Subscribe to My Weekly Stock to keep reading this post and get 7 days of free access to the full post archives.