


Momentum Review: Macro Segments (Jul 2025 Edition)
Dear readers,
Welcome back to My Weekly Stock, where in-depth market analysis meets proven momentum-based trading strategies. My mission? To help you win in the markets with unbiased, data-driven insights you can act on.
This mid-week update is all about my momentum review. Each week, I analyze a different curated list of ETFs or stock tickers covering either key market segments, sectors, or individual stocks. I focus on understanding where we are in the cycle with a mid-to-long-term perspective. My momentum model combines 3 elements: performance, trend, and key levels. This structured approach helps identify strengths, weaknesses, and emerging opportunities across various market segments.
If you want the full experience, consider upgrading your subscription. Paid members get access to all my portfolios, real-time trade alerts, in-depth analysis, and a clear momentum-based framework you can follow and learn from.
Start today. Your first month is completely FREE. If you’re ready to give it a try—or just want to support my work—this is your chance!
Let’s go!
SUMMARY
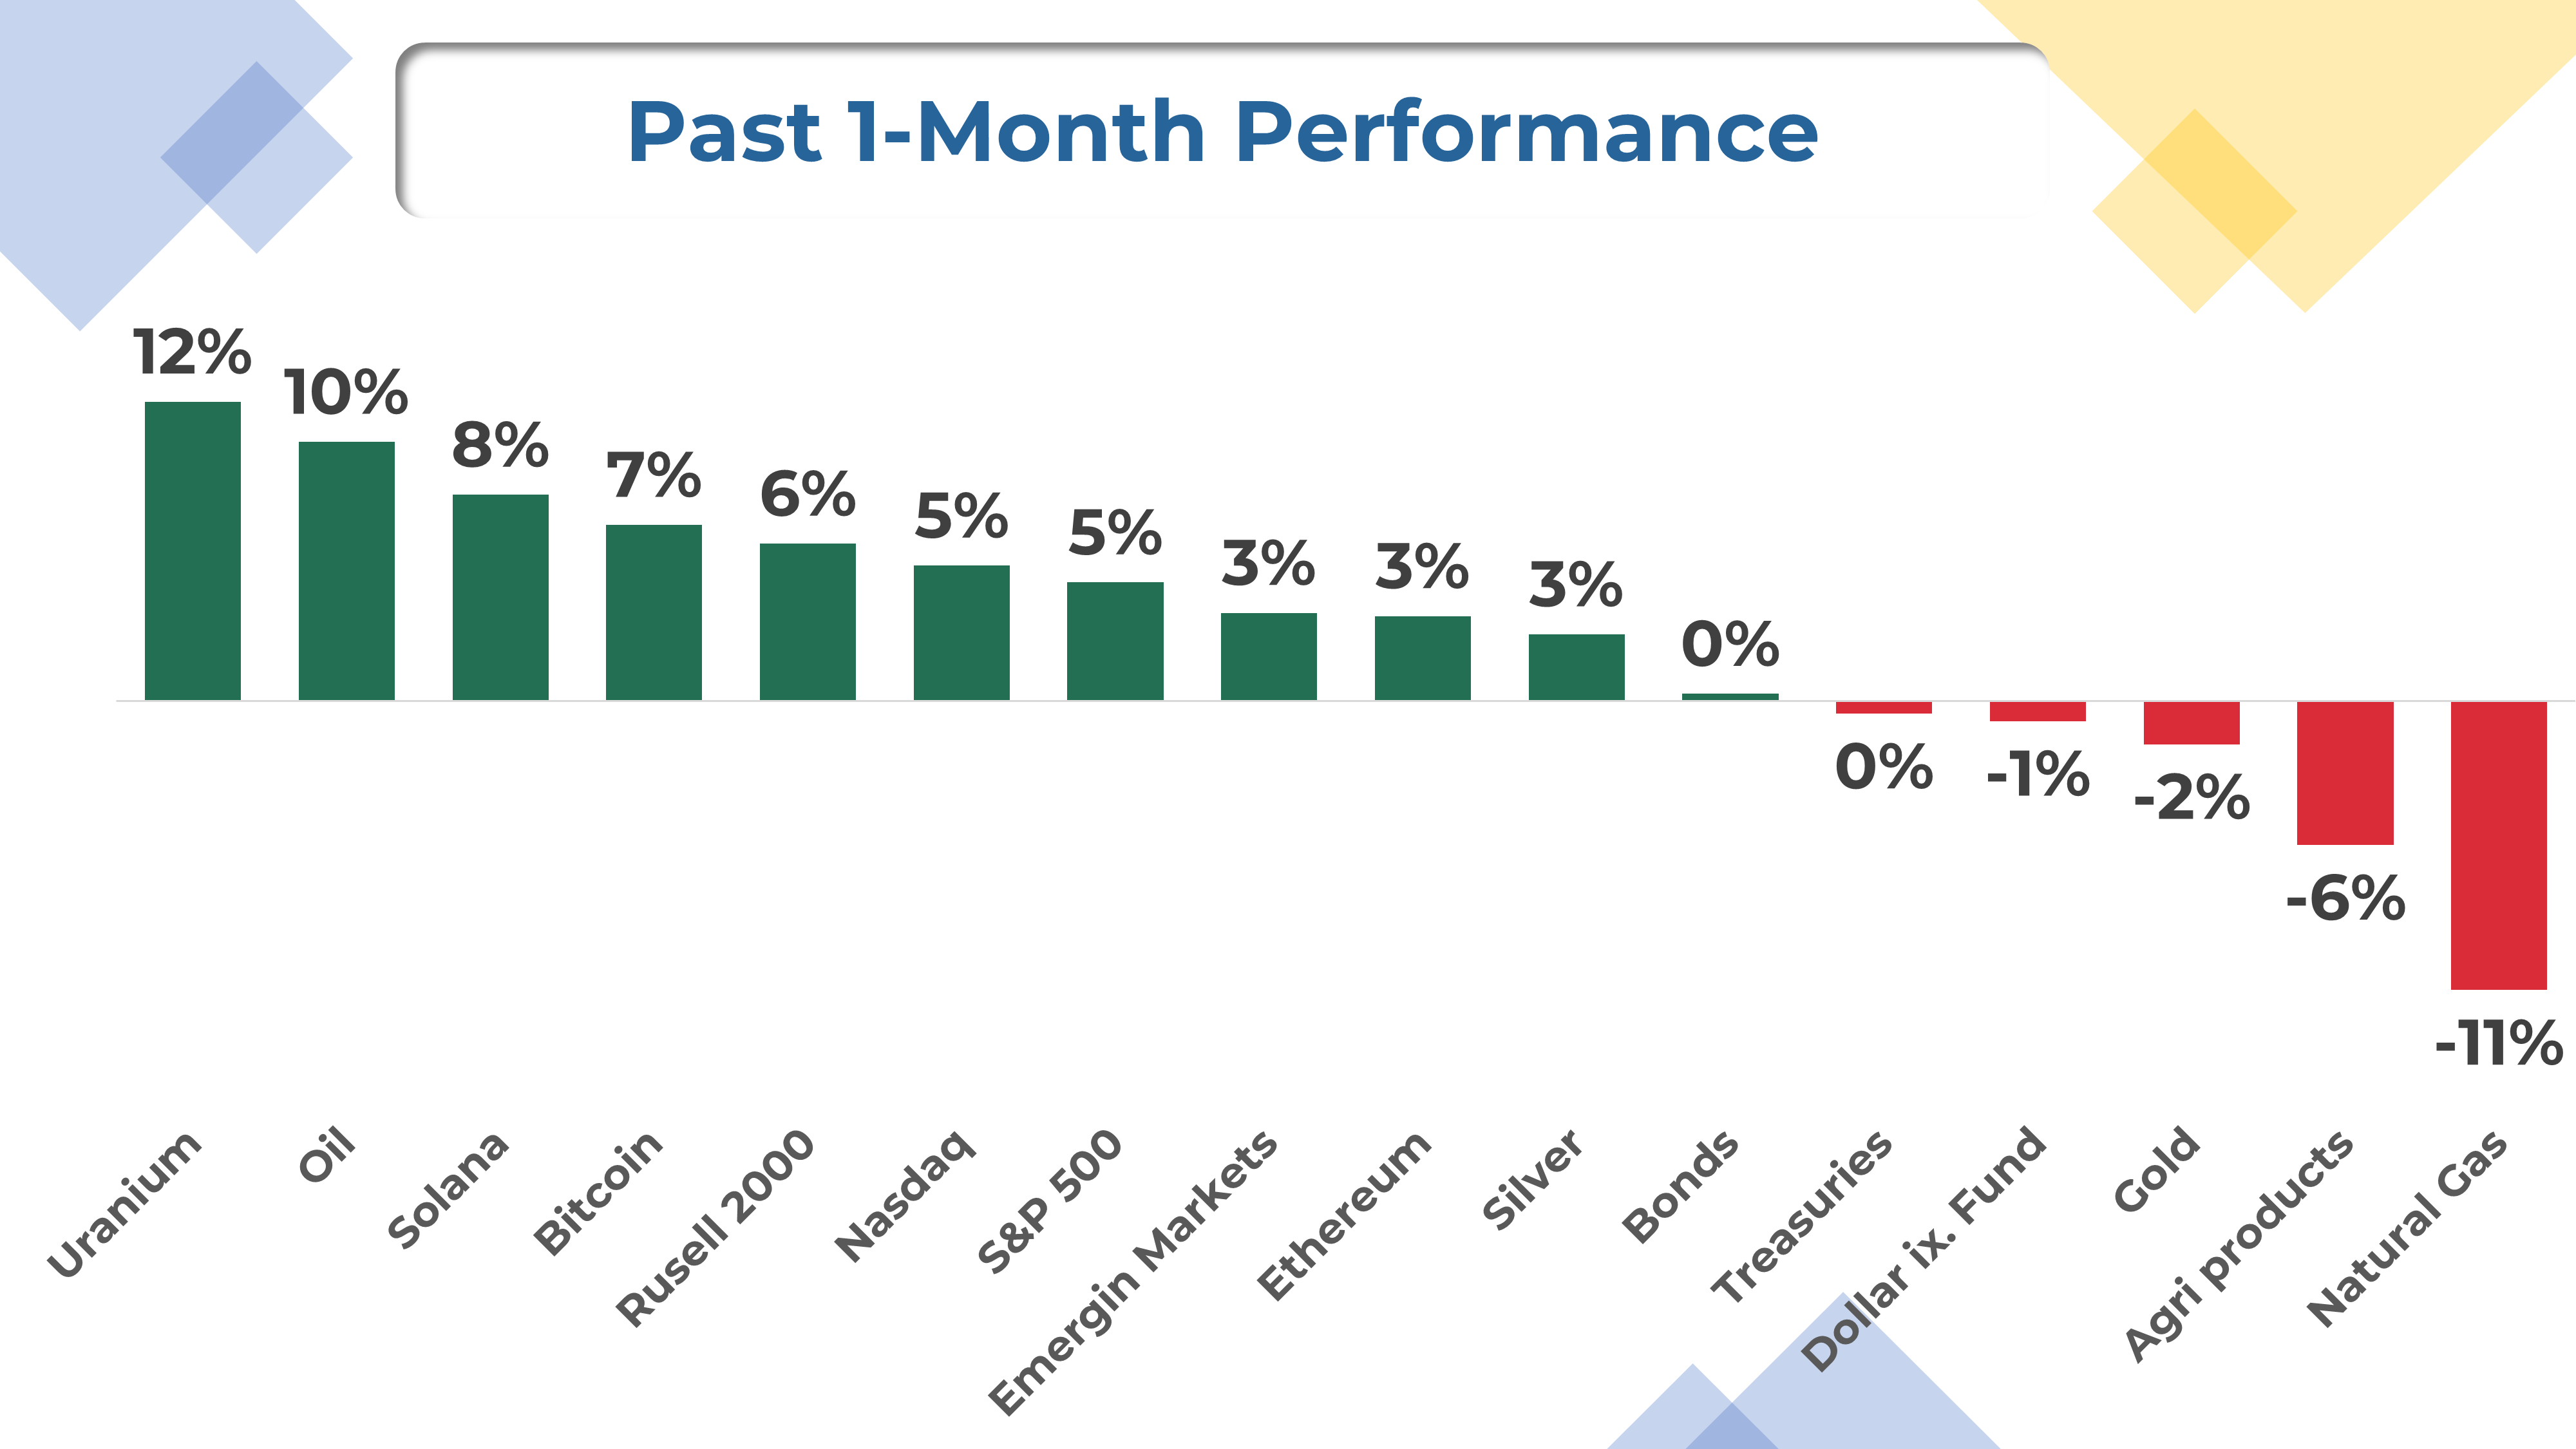
Risk-on segments continued their impressive recovery from April's lows. After reclaiming their 30-week EMAs, the next natural challenge was to break out above their previous highs, and many did just that in recent weeks.
Looking at the weekly charts, several of these rallies appear somewhat overheated, so a period of consolidation would be both expected and healthy. So if you didn't use the past few weeks to position aggressively, now may not be the best time to chase.
That said, momentum remains strong and continues to suggest the early stages of a new bullish cycle. As long as we don't lose key support or trend lines, I'd view any upcoming pullback as a potential buying opportunity, not a reason to panic.
My Analytical Approach
My momentum framework is divided into three parts: performance, trends, and key levels.
I like to see securities trading within 5% of their 1-year high, which indicates strong momentum and minimal overhead resistance. Additionally, I look for signs of accelerating gains in recent periods.
I assess the strength of a ETF’s weekly chart using a trend rating system on a scale of 1 to 5. A score of 3 or above indicates a strong trend worth holding. A score of 2 or below signals weakening momentum and suggests preparing an exit plan.
My trend rating is based on five criteria centered around the 9- and 30-week exponential moving averages (EMAs):
The 9-week EMA is above the 30-week EMA (most important).
Price is trading above the 9-week EMA.
Price is trading above the 30-week EMA.
The 9-week EMA trend line is rising.
The 30-week EMA trend line is rising.
In the core of an uptrend, the 9-week EMA often acts as support, while a confirmed loss of the 30-week EMA with no reaction typically suggests a trend change on the horizon.
I complement my analysis by looking at key levels. Support and resistance levels are critical technical analysis components, serving as indicators for potential trend reversals or continuations. My preferred method is to look for previous highs and lows, any levels where the trend has historically changed, and price gaps.
Why This Framework?
I developed this framework to ride uptrends confidently and to filter out noise from the price action. Breakouts can be messy—ranging markets, failed breakouts, and sharp reversals are all challenges we face as swing traders. Even the best uptrend on paper can be challenging to trade in real life.
My analysis approach helps me manage my positions effectively. Even if you don’t own any tickers below, you can adapt parts of this framework to navigate the market more confidently.
Watchlist
In this post, I will cover 16 ETFs, each tracking different segment of the market, including:
Equity Index:
$SPY (SPDR S&P 500 ETF) – S&P500
$QQQ (Invesco QQQ Trust) – Nasdaq
$IWM (iShares Russell 2000 ETF) – U.S. small-cap
$EEM (iShares MSCI Emerging Markets ETF) – Emerging markets
Fixed-Income:
$BND (Vanguard Total Bond Market ETF) – U.S. investment-grade bonds
$TLT (iShares 20+ Year Treasury Bond ETF) – Long-term U.S. Treasuries
$UUP (U.S. Dollar Index) – U.S. dollar currency exposure
Crypto:
BTCUSD (Bitcoin)
ETHUSD (Ethereum)
SOLUSD (Solana)
Commodities:
$USO (United States Oil Fund) – Crude oil
$UNG (United States Natural Gas Fund) – Natural gas
$URA (Uranium ETF) – Uranium
$GLD (SPDR Gold Trust) – Gold
$SLV (iShares Silver Trust) – Silver
$DBA (Invesco DB Agriculture Fund) – Agriculture
Momentum Analysis
Equity Index & Bonds

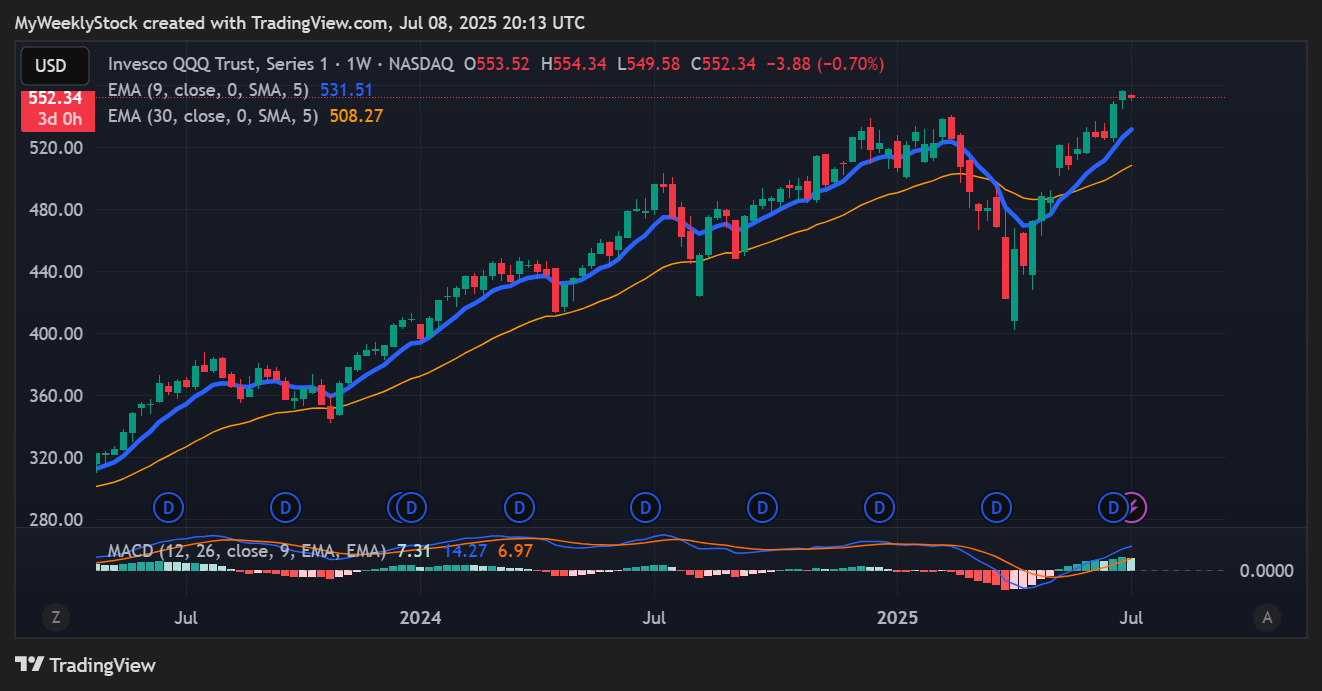
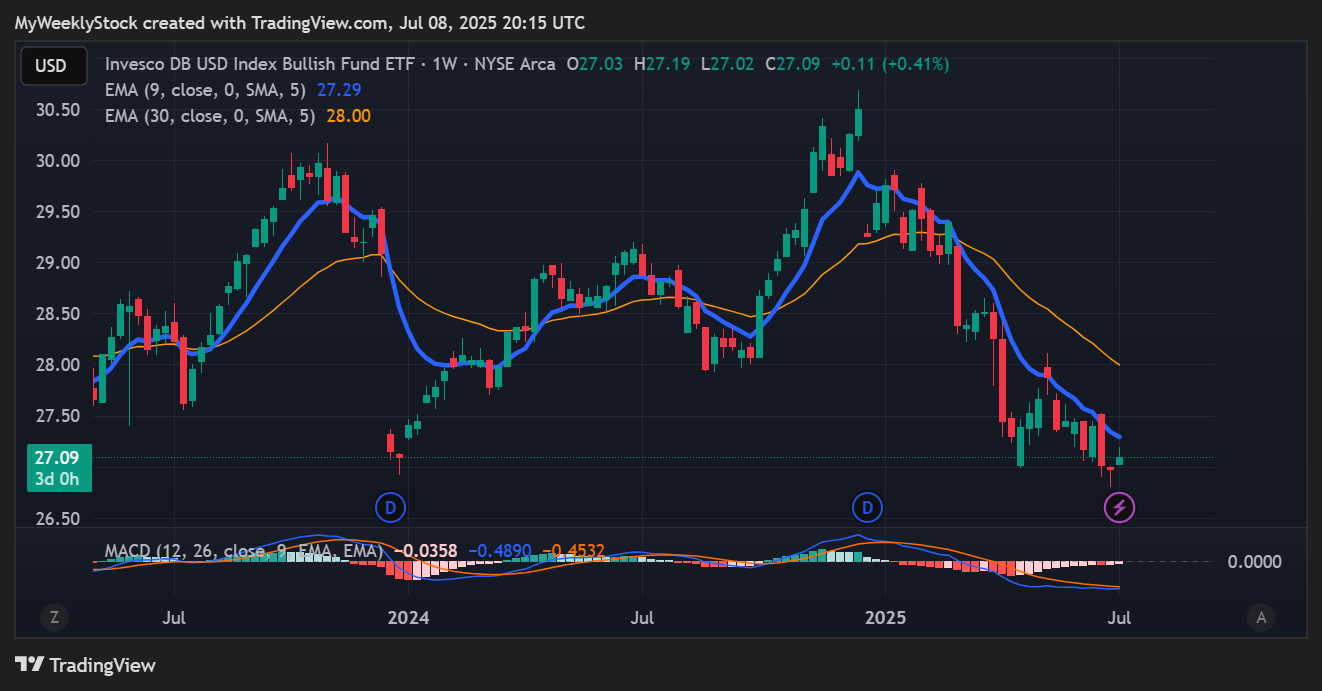
In all the charts below, the 9-week EMA is in BLUE, while the 30-week EMA is in YELLOW.
My Rating: “WATCH” means interesting set-up in formation but too early to invest.
$SPY (SPDR S&P 500 ETF): ⭐️⭐️⭐️⭐️⭐️ (improving vs last month)
Nice follow-through from bulls as we recovered the 30-week EMA and broke out in late June to new all-time highs. The rally is extended, and a cool-off period is needed to let the trendline catch up.

$QQQ (Invesco QQQ Trust) ⭐️⭐️⭐️⭐️⭐️ (improving vs last month)
Same setup.
$IWM (iShares Russell 2000 ETF) ⭐️⭐️⭐️(improving vs last month)
Small caps have lagged so far but are ready to catch up. The 9-week EMA is about to cross over the 30-week EMA, my favorite buy signal. If it follows the pattern of large caps, we could revisit previous highs soon.

$EEM (iShares MSCI Emerging Markets ETF) ⭐️⭐️⭐️⭐️⭐️(improving vs last month)
Strong momentum but running a little too hot. Some consolidation might be needed next.

$BND (Vanguard Total Bond Market ETF) ⭐️⭐️(improving vs last month)
Stuck in a tight range since November.

$TLT (iShares 20+ Year Treasury Bond ETF) ⭐️(improving vs last month)
Still anchored in the downtrend, although the $82 area has provided good support. I’d like to see a higher high before considering an entry.

$UUP (U.S. Dollar Index) (stable vs last month)
Similarly, still stuck in a negative downtrend, and it is too early to tell if we’ve found a swing low.
Commodities & Crypto
Keep reading with a 7-day free trial
Subscribe to My Weekly Stock to keep reading this post and get 7 days of free access to the full post archives.