
Dear readers,
Welcome back to My Weekly Stock, where in-depth market analysis meets proven momentum-based trading strategies. My mission? To help you win in the markets with unbiased, data-driven insights you can act on.
This mid-week update is all about my momentum review. Each week, I analyze a different curated list of ETFs or stock tickers covering either key market segments, sectors, or individual stocks. I focus on understanding where we are in the cycle with a mid-to-long-term perspective. My momentum model combines 3 elements: performance, trend, and key levels. This structured approach helps identify strengths, weaknesses, and emerging opportunities across various market segments.
If you want the full experience, consider upgrading your subscription. Paid members get access to all my portfolios, real-time trade alerts, in-depth analysis, and a clear momentum-based framework you can follow and learn from.
Start today. Your first month is completely FREE. If you’re ready to give it a try, or just want to support my work, this is your chance!
Let’s go!
SUMMARY
Risky assets have successfully reclaimed the 30-week exponential moving average, my favorite long-term trend line. We're now seeing some healthy consolidation and reloading before the next big challenge: retesting and eventually breaking into new all-time highs. Bitcoin was the first to achieve this, although it ultimately failed to hold above those highs. Equities are the next segment I'm watching closely.
If we consistently hit new all-time highs and sentiment continues to improve, that would be a strong sign that we're likely in the early stages of a new bullish cycle. We’re not fully out of the woods yet—but in my view, this isn’t the worst time to deploy cash, as long as it’s done in a disciplined way.

My Analytical Approach
My momentum framework is divided into three parts: performance, trends, and key levels.
I like to see securities trading within 5% of their 1-year high, which indicates strong momentum and minimal overhead resistance. Additionally, I look for signs of accelerating gains in recent periods.
I assess the strength of a ETF’s weekly chart using a trend rating system on a scale of 1 to 5. A score of 3 or above indicates a strong trend worth holding. A score of 2 or below signals weakening momentum and suggests preparing an exit plan.
My trend rating is based on five criteria centered around the 9- and 30-week exponential moving averages (EMAs):
The 9-week EMA is above the 30-week EMA (most important).
Price is trading above the 9-week EMA.
Price is trading above the 30-week EMA.
The 9-week EMA trend line is rising.
The 30-week EMA trend line is rising.
In the core of an uptrend, the 9-week EMA often acts as support, while a confirmed loss of the 30-week EMA with no reaction typically suggests a trend change on the horizon.
I complement my analysis by looking at key levels. Support and resistance levels are critical technical analysis components, serving as indicators for potential trend reversals or continuations. My preferred method is to look for previous highs and lows, any levels where the trend has historically changed, and price gaps.
Why This Framework?
I developed this framework to ride uptrends confidently and to filter out noise from the price action. Breakouts can be messy—ranging markets, failed breakouts, and sharp reversals are all challenges we face as swing traders. Even the best uptrend on paper can be challenging to trade in real life.
My analysis approach helps me manage my positions effectively. Even if you don’t own any tickers below, you can adapt parts of this framework to navigate the market more confidently.
Watchlist
In this post, I will cover 16 ETFs, each tracking different segment of the market, including:
Equity Index:
$SPY (SPDR S&P 500 ETF) – S&P500
$QQQ (Invesco QQQ Trust) – Nasdaq
$IWM (iShares Russell 2000 ETF) – U.S. small-cap
$EEM (iShares MSCI Emerging Markets ETF) – Emerging markets
Fixed-Income:
$BND (Vanguard Total Bond Market ETF) – U.S. investment-grade bonds
$TLT (iShares 20+ Year Treasury Bond ETF) – Long-term U.S. Treasuries
$UUP (U.S. Dollar Index) – U.S. dollar currency exposure
Crypto:
BTCUSD (Bitcoin)
ETHUSD (Ethereum)
SOLUSD (Solana)
Commodities:
$USO (United States Oil Fund) – Crude oil
$UNG (United States Natural Gas Fund) – Natural gas
$URA (Uranium ETF) – Uranium
$GLD (SPDR Gold Trust) – Gold
$SLV (iShares Silver Trust) – Silver
$DBA (Invesco DB Agriculture Fund) – Agriculture
Momentum Analysis
Equity Index & Bonds

In all the charts below, the 9-week EMA is in BLUE, while the 30-week EMA is in YELLOW.
My Rating: “WATCH” means interesting set-up in formation but too early to invest.
$SPY (SPDR S&P 500 ETF): ⭐️⭐️⭐️
The bounce from April's low remains alive as the S&P 500 has successfully recovered the 30-week exponential moving average (EMA). We have just witnessed a bullish crossover of moving averages, with the 9-week EMA crossing above the 30-week. The next challenge is to hit a new all-time high.

$QQQ (Invesco QQQ Trust) ⭐️⭐️⭐️
Same setup.

$IWM (iShares Russell 2000 ETF) ⭐️
While we saw a strong bounce from April's low, it failed to clear the 30-week EMA, and we are now ranging just below it.

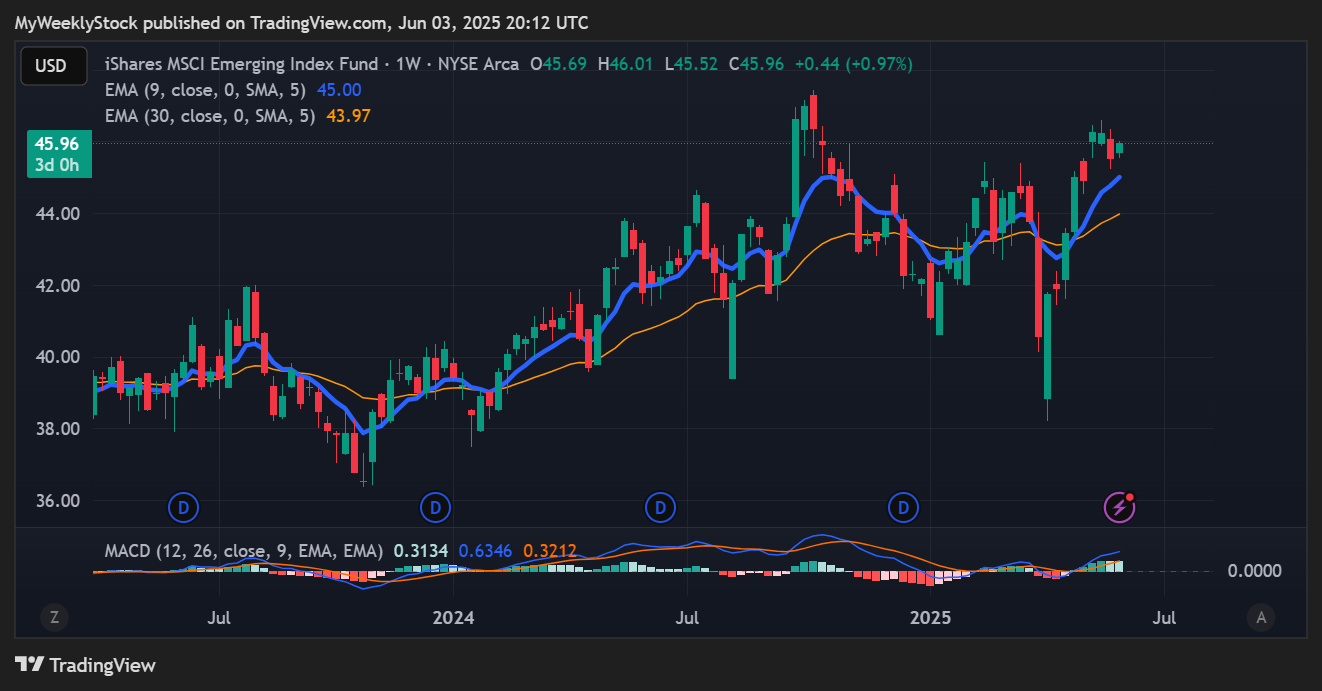
$EEM (iShares MSCI Emerging Markets ETF) ⭐️⭐️⭐️⭐️
Emerging markets have shown some relative strength this year. Still, we should take out the previous high and see rising moving averages to feel more confident in this move.
$BND (Vanguard Total Bond Market ETF) ⭐️
Consolidating around key trendlines and stuck for months in a multi-month range. I'd like to see a break above $74 to consider a position.

$TLT (iShares 20+ Year Treasury Bond ETF)
It remains stuck in a negative channel and a no-touch for me until the path of central bank rates is uncertain.

$UUP (U.S. Dollar Index)
Momentum remains largely negative, although we could have found a swing low in April. But until we clear resistance levels and reclaim key trendlines, we can't rule out another low. $28.50 is the first level I'm watching.

Commodities & Crypto
Keep reading with a 7-day free trial
Subscribe to My Weekly Stock to keep reading this post and get 7 days of free access to the full post archives.