Dear readers,
Welcome back to My Weekly Stock, where in-depth market analysis meets proven momentum-based trading strategies. My mission? To help you win in the markets with unbiased, data-driven insights you can act on.
This mid-week update is all about my momentum review. In this post series, I analyze a different curated list of ETFs or stock tickers covering either key market segments, sectors, or individual stocks. I focus on understanding where we are in the cycle with a mid-to-long-term perspective. My momentum model combines 3 elements: performance, trend, and key levels. This structured approach helps identify strengths, weaknesses, and emerging opportunities across various market segments.
If you want the full experience, consider upgrading your subscription. Paid members get access to all my portfolios, real-time trade alerts, in-depth analysis, and a clear momentum-based framework you can follow and learn from.
Start today. Your first month is completely FREE. If you’re ready to give it a try—or just want to support my work—this is your chance!
Let’s go!
SUMMARY
Many of the growth and cyclical sectors continue to slowly grind higher as we digest the strong bounce from April's lows. But the key challenge remains the same as last month: surpassing the previous all-time highs, which now sit just a few inches away.
That also means that if you haven't already used the past few weeks to build positions, this is probably not the best time to start aggressively adding exposure. I prefer to see us challenge those previous highs and sustain a breakout. Only then would I feel more confident that we won't revisit April's lows.
So, while many charts look fairly constructive, I remain cautious, as negative headlines—whether related to trade, macroeconomic data, or geopolitics— could provide sellers another opportunity to step in.
My Analytical Approach
My momentum framework is divided into three parts: performance, trends, and key levels.
I like to see securities trading within 5% of their 1-year high, which indicates strong momentum and minimal overhead resistance. Additionally, I look for signs of accelerating gains in recent periods.
I assess the strength of a ETF’s weekly chart using a trend rating system on a scale of 1 to 5. A score of 3 or above indicates a strong trend worth holding. A score of 2 or below signals weakening momentum and suggests preparing an exit plan.
My trend rating is based on five criteria centered around the 9- and 30-week exponential moving averages (EMAs):
The 9-week EMA is above the 30-week EMA (most important).
Price is trading above the 9-week EMA.
Price is trading above the 30-week EMA.
The 9-week EMA trend line is rising.
The 30-week EMA trend line is rising.
In the core of an uptrend, the 9-week EMA often acts as support, while a confirmed loss of the 30-week EMA with no reaction typically suggests a trend change on the horizon.
I complement my analysis by looking at key levels. Support and resistance levels are critical technical analysis components, serving as indicators for potential trend reversals or continuations. My preferred method is to look for previous highs and lows, any levels where the trend has historically changed, and price gaps.
Why This Framework?
I developed this framework to ride uptrends confidently and to filter out noise from the price action. Breakouts can be messy—ranging markets, failed breakouts, and sharp reversals are all challenges we face as investors. Even the best uptrend on paper can be challenging to trade in real life.
My analysis approach helps me manage my positions effectively. Even if you don’t own any tickers below, you can adapt parts of this framework to navigate the market more confidently.
Coverage
In this post, I will cover 16 ETFs, each tracking different sectors or industry, including:
(1) Growth:
$FDN (First Trust Dow Jones Internet Index Fund) – Internet/digital economy
$IGV (iShares Expanded Tech-Software Sector ETF) – Software
$SMH (VanEck Semiconductor ETF) – Semiconductors
$HACK (Prime Cyber Security ETF) – Cybersecurity
(2) Defensive:
$VDC (Vanguard Consumer Staples ETF) – Consumer staples
$VHT (Vanguard Health Care ETF) – Healthcare
$VPU (Vanguard Utilities ETF) – Utilities
(3) Cyclical:
$XLE (Energy Select Sector SPDR Fund) – Energy
$XME (SPDR S&P Metals & Mining ETF) – Metals & Mining
$PAVE (Global X U.S. Infrastructure Development ETF) – Infrastructure
$XHB (SPDR S&P Homebuilders ETF) – Homebuilders
$VIS (Vanguard Industrials ETF) - Industrials
$IYT (iShares U.S. Transportation ETF) - Transportation
$KBE (SPDR S&P Bank ETF) - Banks
$XRT (SPDR Retail ETF) - Retail
$VNQ (Vanguard Real Estate ETF) – Real estate
Momentum Analysis
Growth & Defensive
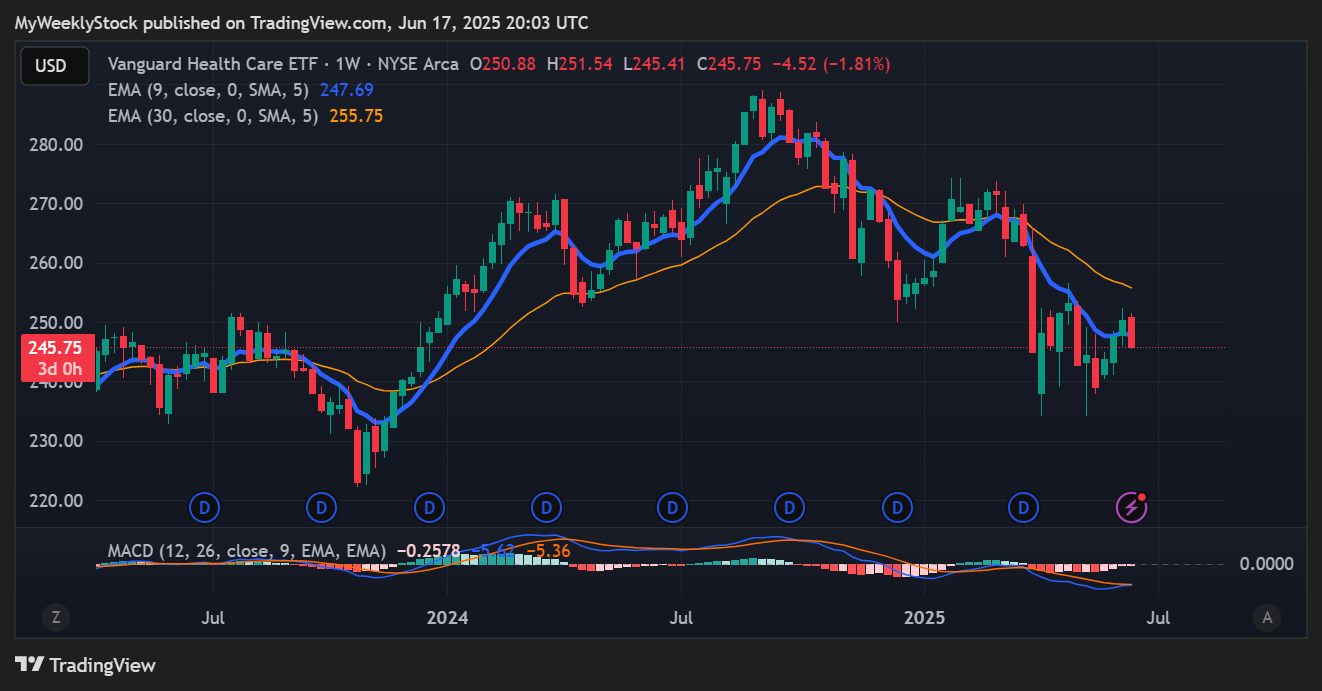
In all the charts below, the 9-week EMA is in BLUE, while the 30-week EMA is in YELLOW.
My Rating: “WATCH” means interesting set-up in formation but too early to invest
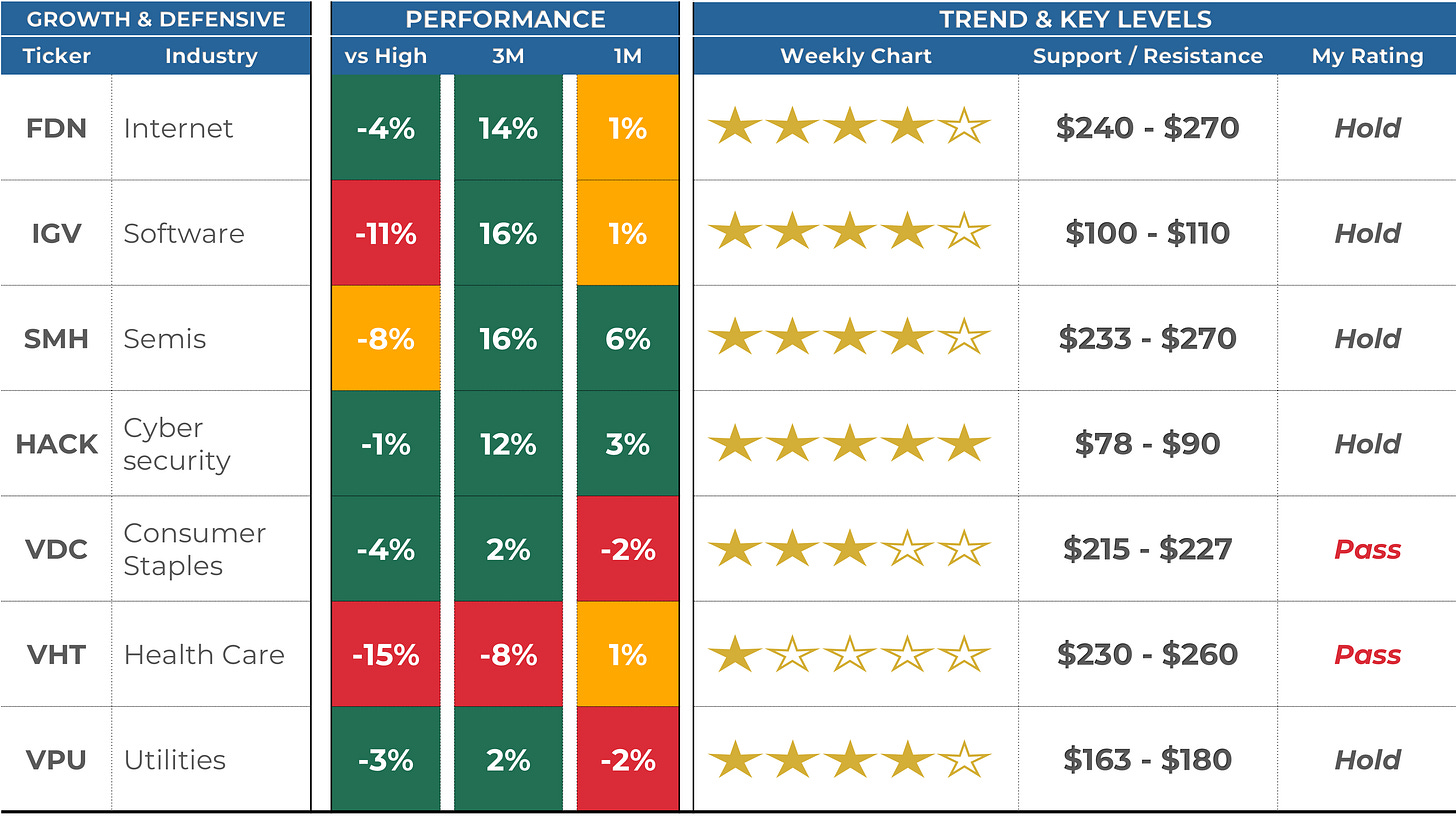
$FDN – Internet/digital economy ⭐️⭐️⭐️⭐️ (stable vs. last month)
Slowly grinding higher as we digest the strong bounce from April's low. The key challenges remain unchanged compared to last month, i.e., to surpass the previous all-time high. I would still be cautious until this breaks, especially as negative headlines could take us back to the 30-week EMA, for example.
$IGV - Software ⭐️⭐️⭐️⭐️ (improving)
Similar setup.
$SMH - Semiconductors ⭐️⭐️⭐️⭐️ (improving)
Similarly, it ranges just a few inches from the all-time high, and I would like to see a sustained breakout above that resistance to feel comfortable that we won't revisit April's low.
$HACK – Cybersecurity⭐️⭐️⭐️⭐️⭐️ (improving)
This is precisely what the cybersecurity industry has managed to do, hitting a new high and now digesting the move. Should we resume the march upwards, that's a very bullish chart.
$VDC – Consumer staples ⭐️⭐️⭐️ (stable)
Consumer staples have been stuck in a tight range since September. I recently preferred to exit my position and redeploy the cash into more growth- and cyclical-oriented sectors.
$VHT – Healthcare⭐️ (improving)
While momentum remains mostly negative, $230-235 has once again acted as a good support zone, and we are now stabilizing. I would need a move above the 30-week EMA to put this on my watchlist.
$VPU - Utilities ⭐️⭐️⭐️⭐️ (improving)
Ranging just below the all-time high and a sustained breakout here would confirm that the April lows are truly behind us.
Cyclicals
Keep reading with a 7-day free trial
Subscribe to My Weekly Stock to keep reading this post and get 7 days of free access to the full post archives.


