

My Weekly Stock Debrief - Feb 18-25th
My Weekly Stock Debrief - Feb 18-25th

Dear subscribers,
Welcome to My Weekly Stock’s debrief for trading week #8 of 2022 (Feb 18-25th),
This is our free weekly newsletter reviewing the market performance in 10 points:
Marker Performance
SP500 Sector Performance
SP500 Top / Bottom Stock Performers
SP500 Breadth
SP500 Daily Chart
Market Sentiment
Our Chart of the Week
Our Favorite Analysis of the Week
The Week Ahead
My Weekly Stock’s pick
1. Market Performance
Last week was positive for equity markets, with the NASDAQ leading the pack while large-caps were lagging. It was, however, far from an easy ride. Mid-week, as Russia started its invasion of Ukraine, the SP500 entered in correction territory (10% below last high) before staggering an impressive 2-day rally and closing the week positive.
Oil crossed the $100 mark before giving back most of its weekly gains. Oil is still up 22% in 2022, and many analysts predict a barrel at $120 soon.

2. SP500 Sector Performance
The performance was broad-based, with almost all sectors flat or positive. The consumer discretionary sector was the exception as cyclical names suffer from the current economic uncertainties due to the high inflation and the consequences of the war in Ukraine.
The energy sector is the only positive sector in 2022 while technology and consumer cyclical are in correction territory.

3. SP500 Top / Bottom Stock Performers
The best and worst stock performers were driven mainly by earnings releases. ETSY and IRM finished the week up more than 10% on the back of solid earnings. On the other hand, BKNG beat estimates but warned on the travel demand for the rest of the year, while NCHL missed both top and bottom-line estimates. This earnings season is unforgiving for companies missing estimates or providing disappointing guidance. We have seen several double-digit percentage points drop, especially for the high-growth names.
Unsurprisingly, the best performers in 2022 are all energy stocks. Despite a recovery last week, the worst performers are mostly technology stocks with many names like FB or NFLX down more than 35% so far in 2022.

4. SP500 Breadth
Last week was encouraging, with 61% of the SP500 components positive and many breadth indicators improving but requiring more confirmation.
We are indeed far from a reversal yet as two third of the SP500 is in correction and more than half are trading below key technical levels.

Read more about market breadth
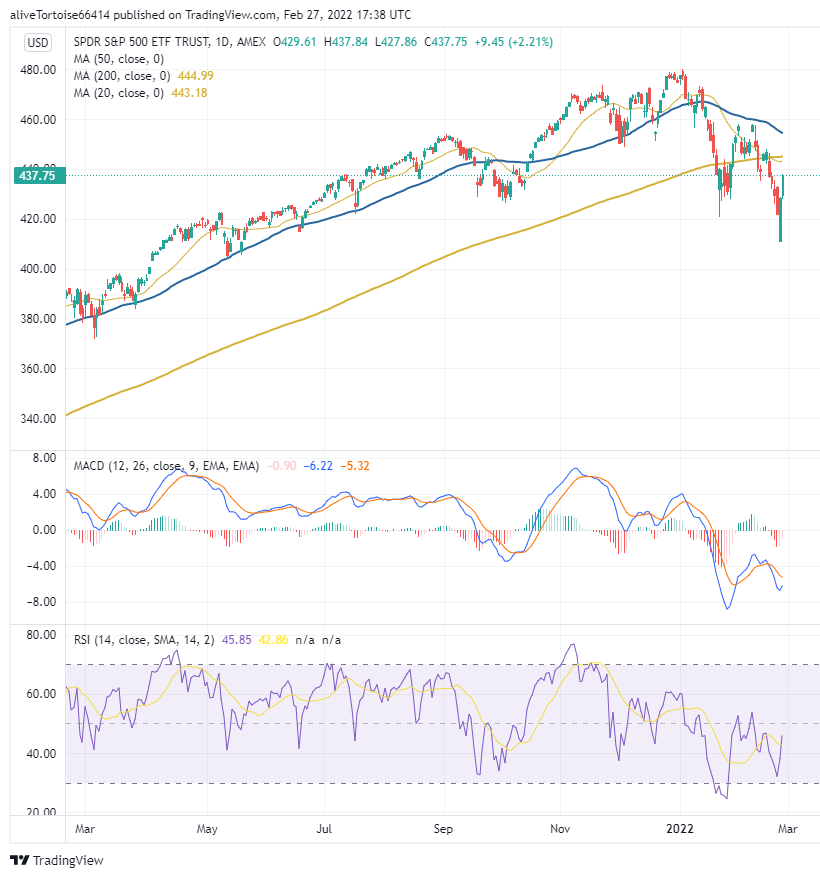
5. SP500 Daily Chart
The SP500 made a new low for the year and remained below its 20, 50, and 200-day moving averages. The risk of a death cross (50-day moving average crossing below the 200-day) is still looming and could indicate another major sell-off ahead.
However, the MACD and RSI did not make new lows which could signal a bullish divergence. Again, we see encouraging signs, but it requires more confirmation. Until then, we cannot eliminate the potential for new lows.
6. Market Sentiment
Fear & Greed Index
CNN's Fear & Greed Index tracks seven investor sentiment indicators and is published daily.
Read more about the Fear & Greed Index
The index closed on Friday at the “Fear” level (33), improving from the “Extreme Fear” from the previous week. The VIX has traded most of the week above 30 and is again above this level this morning.

AAII Investor Sentiment Survey
The American Association of Individual Investors surveys each week its members on what they feel the stock market will be in the next six months. The results are published weekly on Wednesdays.
Read more about the AAII sentiment survey
The last AAII survey reported on Feb 23rd that 54% of the respondents had a bearish outlook for the markets. The reading is higher than during the 2020 COVID crash and is at a level last seen during the 2008-09 crisis.

7. Our Chart of the Week
Volatility has been elevated in 2022, and the VIX hit a new 1-year high. Almost 50% of the trading sessions in 2022 have seen absolute daily returns higher than 1% (based on the prices at the close). The historical average since 1980 is 25%.
We experienced a similar level only in past crises (2020 Covid crash, 2008-09 financial crisis, the early 2000s).
The volatility is here to stay short-term and at a minimum until the next Fed meeting and a resolution of the conflict in Ukraine.

Access here the original tweet
8. Our Favorite Analysis of the Week
March is around the corner.
Adam Mancini reviews the seasonality of the SP500, which tracked perfectly in January and February. And he has good news for us: we could have a multi-month seasonal low in front of us.


SP500 in correction territory
The SP500 briefly entered into correction last week. Ryan Detrick reviewed the previous 33 corrections since 1980 and assessed that the return 1-year later is on average +25% and higher 90% of the time.


More about market sentiment
Here is an extensive analysis from ZeroHedge on the market sentiment, the amount of hedging taking place in the market, and what it could mean for the months ahead.
https://www.zerohedge.com/markets/market-sentiment-has-never-been-worse-and-everyone-hedging-crash
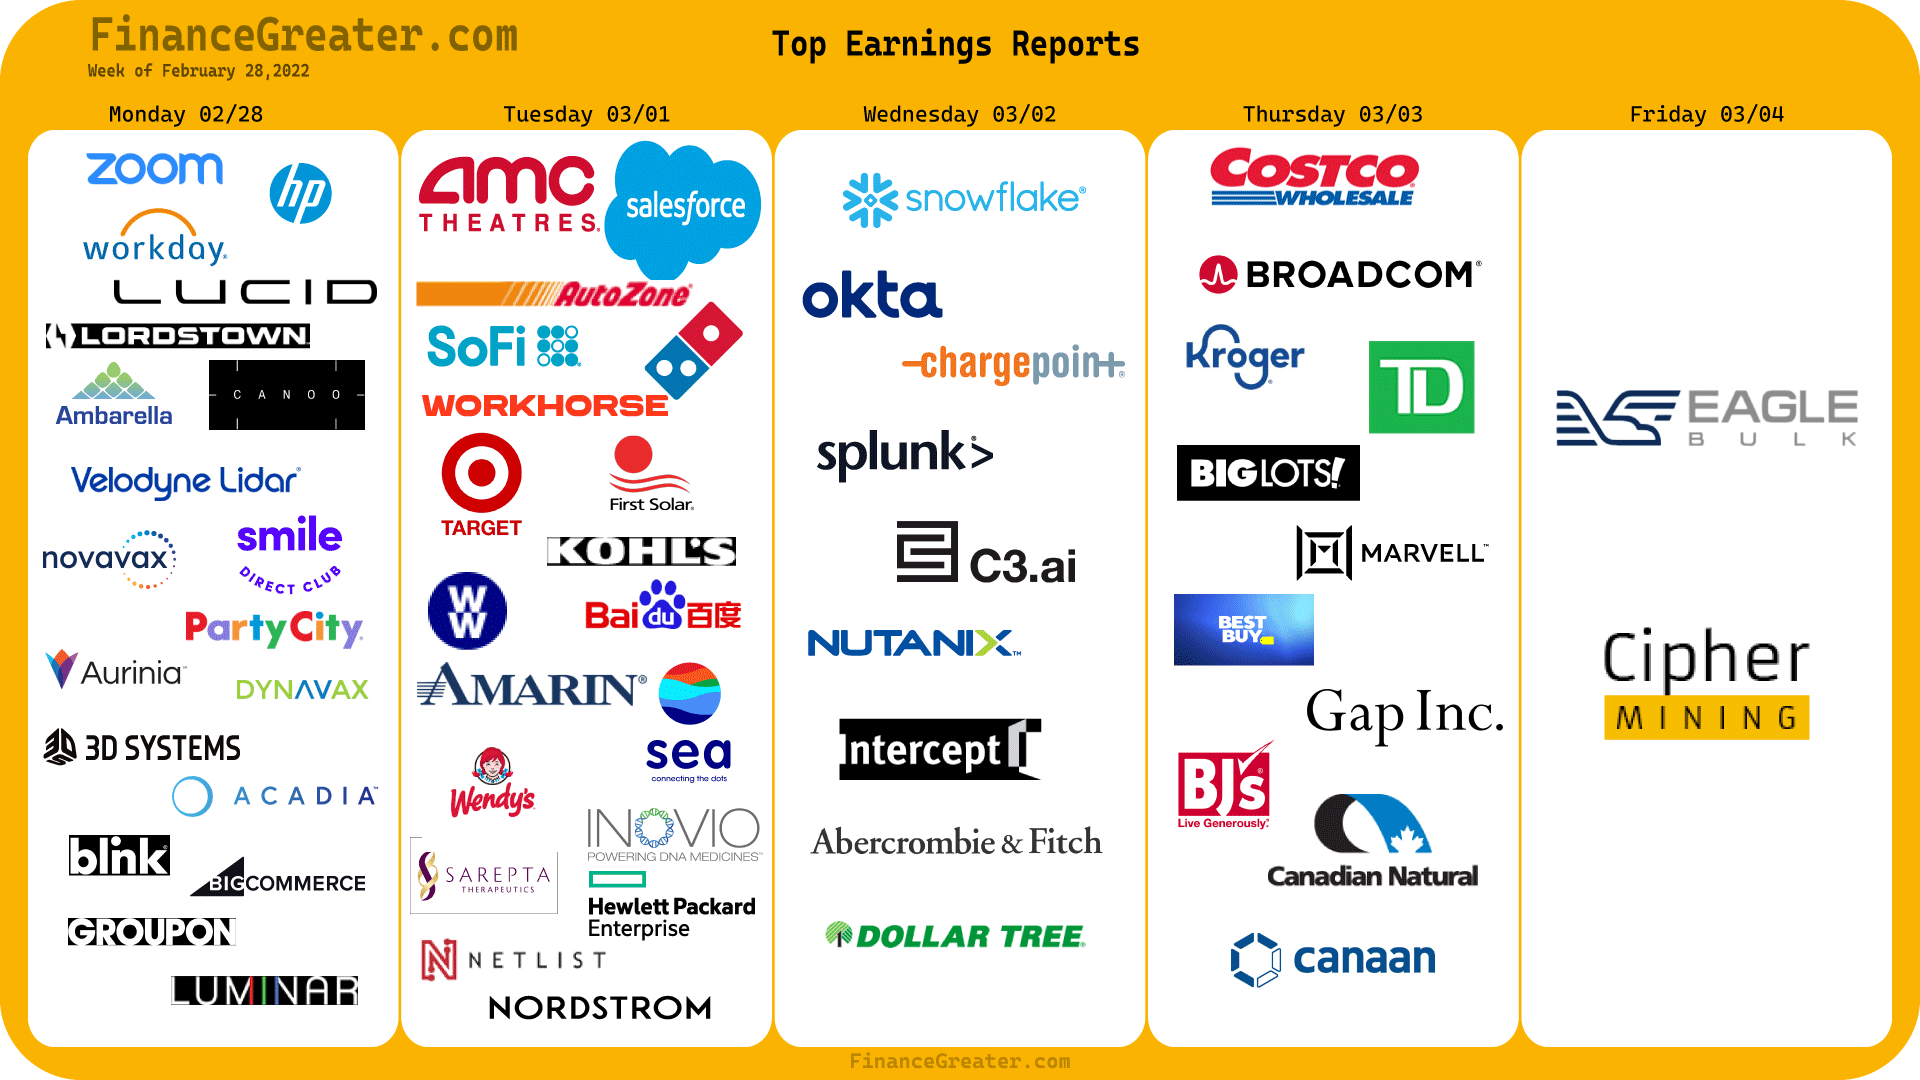
9. The Week Ahead
Many earnings releases are expected from retailers (Costco, Kohl’s, Target) and technology names (Broadcom, Zoom, Salesforce). As usual, the impact of inflation and future guidance will be capital for investors.
The employment report is due on Friday and should show strong numbers as the Omicron wave slowed down. The FED president is also scheduled to testify in front of congress. The investors will look for clues if the latest geopolitical events and the over-heated inflation reports impact the FED policies.

Access the earnings and economic calendar here
Beyond earnings and economic reports, the Russia-Ukraine conflict will be at the center. We can expect more details about potential economic sanctions and what it means for the economy and energy prices.
10. My Weekly Stock Pick
Last week, we traded AXP, and the stock finished down 0.8% (Monday open to Friday close). In 2022, My Weekly Stock picks are up 10% (no leverage, buy and hold five days), and our options trading is up 143%.
Access here our performance tracking
My Weekly Stock’s pick for this week is in the energy sector. The stock has been on a positive trend since October, is up more than 20% in 2022, and hit a new 52-week high on Friday.
To unlock My Weekly Stock’s pick, access our trading plan, and receive timely buy/sell alerts, join one of our paid plans. We currently have a 14-day free trial!
This ends My Weekly Stock’s debrief for trading week #8 of 2022 (Feb. 18-25th).
Please share that newsletter if you enjoy reading it by hitting the link below.
You can also follow us on Twitter or Instagram, where we post more charts during the week.
Finally, if you have any feedback about the newsletter, you can reply directly to this email.
Have a lovely trading week,
My Weekly Stock
Disclaimer
My Weekly Stock shares information and content on our websites, social networks, or newsletters only for educational purposes. The information contained in our publications has been prepared based on publicly available information and proprietary research. The author does not guarantee the correctness, accuracy, or completeness of the information provided.
All information provided by My Weekly Stock or its affiliates is impersonal and not tailored to your needs, your investment objectives, or your financial situation. Nothing contained in the report shall constitute financial advice or an investment recommendation.
You are solely responsible for your own investment decisions. We recommend consulting with a registered investment advisor, broker-dealer, or financial advisor. If you choose to invest, with or without seeking advice, then any consequences resulting from your investments are your sole responsibility. We are neither liable nor responsible for any profits or losses arising from any investment decision you have taken or made based on information we provide on our websites, social networks, or newsletters.
By using this site, newsletter, or any information provided herein, you indicate your consent and agreement to the terms of this disclaimer.