


My Weekly Stock Debrief - Feb 25-Mar 4th

Dear subscribers,
Welcome to My Weekly Stock’s debrief for trading week #9 of 2022 (Feb 25-Mar 4th),
Our free weekly newsletter reviews the market performance this week in 10 points:
Marker Performance
SP500 Sector Performance
SP500 Top / Bottom Stock Performers
SP500 Breadth
SP500 Daily Chart
Market Sentiment
Our Chart of the Week
Our Favorite Analysis of the Week
The Week Ahead
My Weekly Stock’s pick
1. Market Performance
Stock indexes closed another negative week, with the SP500 down 1.3% and the NASDAQ 2.8%. Oil closed the week above $115, for the highest price since 2008, as the conflict in Ukraine increased supply worries. While the market navigates the updates from Ukraine and constant fears of inflation, investors preferred the safety of Gold and bonds over riskier assets this week.
The SP500 is down 9% in 2022, while the NASDAQ remains in correction territory. Meanwhile, Oil is up an impressive 53%, and Gold continues to outperform.

2. SP500 Sector Performance
Energy and Utilities were the top performers as commodities prices pushed higher. Economic-sensitive sectors were down due to the current economic uncertainties.
The energy sector is the only positive sector in 2022, while Technology and Consumer Cyclical remain in correction territory.

3. SP500 Top / Bottom Stock Performers
Occidental Petroleum (OXY) benefitted from the rising oil prices and posted a 45% gain in 5 days. The stock is the indisputable winner of 2022 and has almost doubled since the beginning of the year. Kroger (KR) was up 27% after releasing quarterly results above estimates and issuing upbeat guidance for the remainder of the year.
EPAM lost close to half of its value this week after withdrawing its financial projection for 2022. The software company has large software development sites in Ukraine, Russia, and Belarus.
Unsurprisingly, the best performers in 2022 are energy stocks. The worst performers remain mostly technology stocks, with Facebook (FB) and Netflix (NFLX) down more than 40% so far in 2022.

4. SP500 Breadth
61% of the SP500 components were negative this week. We are far from any reversal yet as two-thirds of the SP500 is in correction and below their 50-day moving average.

Read more about market breadth
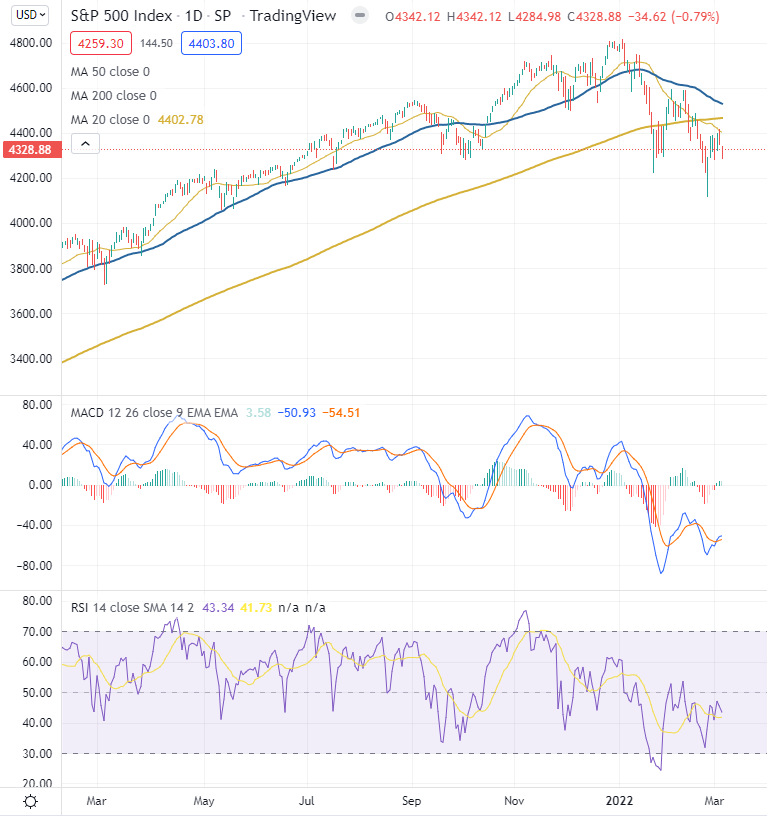
5. SP500 Daily Chart
The SP500 remained below its 20, 50, and 200-day moving averages. The risk of a death cross (50-day moving average crossing below the 200-day) is still looming and could indicate another major sell-off ahead.
6. Market Sentiment
Fear & Greed Index
CNN's Fear & Greed Index tracks seven investor sentiment indicators and is published daily.
Read more about the Fear & Greed Index
The index closed on Friday at the “Extreme Fear” level (17), the lowest level of 2022 and worsening vs. the “Fear” from the previous week. The VIX has traded most of the week above 30 and closed Friday up 5% at 32.

AAII Investor Sentiment Survey
The American Association of Individual Investors surveys each week its members on the direction of the stock market for the next six months. The results are published weekly on Wednesdays.
Read more about the AAII sentiment survey
The last AAII survey reported on March 2nd that 41% of the respondents had a bearish outlook for the markets. The reading is improving after hitting the highest reading since 2013 the previous week.

7. Our Chart of the Week
Except for energy stocks, the market's poor performance so far in 2022 is pretty broad-based:
One-third of the SP500 is down more than 20% vs. their respective 52-week highs,
One-third is down between 10 and 20%,
One-third is down less than 10%.
Once the selling pressure settles, and the markets are ready to go higher, some of the heavily beaten-down stocks may lead the way up.

Access here the original tweet
8. Our Favorite Analysis of the Week
Volatility and market returns
The VIX remains firmly anchored above 30, but it is not necessarily bad for the market. Mike Zaccardi’s chart shows that, historically, a VIX at 30 meant an SP500 up 15% in the following 12 months.


Energy vs. Technology
Obvious to say that Energy has outperformed Technology recently. The ratio of the SP500 Technology sector vs. Energy has been cut in half in 4 months. But it is still higher than at the top of the dot-com bubble.


Market resilience
The Kobeissi Letter rightfully points out that the SP500 is just off 10% of its all-time high despite all the negative news around.

9. The Week Ahead
The earning season is approaching its end. Next week will be relatively calm, with the main report being Oracle on Thursday.

On Thursday, all eyes will be on the CPI report, with prices expected to increase 7.8% year-over-year, the highest since 1982.

Access the earnings and economic calendar here
Beyond earnings and economic reports, the investors will continue to monitor the situation in Ukraine and the price of oil and commodities.
10. My Weekly Stock Pick
This week, we traded CVX, and the stock finished up 14% (Monday open to Friday close). In 2022, My Weekly Stock’s picks are up 25% (no leverage, buy and hold five days), and our options trading is up 179%.
Access here our performance tracking
My Weekly Stock’s pick for the coming week will be again in the energy sector. The stock has been on a positive trend since October, is up more than 30% in 2022, and posted new 52-week highs every day of this week.
Join us to unlock My Weekly Stock’s pick, access our trading plan, and receive timely buy/sell alerts. We currently have a 14-day free trial!
That’s all for My Weekly Stock’s debrief for week #9 of 2022 (Feb. 25-Mar. 4th).
If you enjoy reading our newsletter, please share it via the link below:
You can also follow us on Twitter where we post many more charts during the week.
Finally, if you have any feedback or question about the newsletter, you can reply directly to this email.
Have a lovely trading week,
My Weekly Stock
Disclaimer
My Weekly Stock shares information and content on our websites, social networks, or newsletters only for educational purposes. The information contained in our publications has been prepared based on publicly available information and proprietary research. The author does not guarantee the correctness, accuracy, or completeness of the information provided.
All information provided by My Weekly Stock or its affiliates is impersonal and not tailored to your needs, your investment objectives, or your financial situation. Nothing contained in the report shall constitute financial advice or an investment recommendation.
You are solely responsible for your own investment decisions. We recommend consulting with a registered investment advisor, broker-dealer, or financial advisor. If you choose to invest, with or without seeking advice, then any consequences resulting from your investments are your sole responsibility. We are neither liable nor responsible for any profits or losses arising from any investment decision you have taken or made based on information we provide on our websites, social networks, or newsletters.
By using this site, newsletter, or any information provided herein, you indicate your consent and agreement to the terms of this disclaimer.