


My Weekly Stock Debrief - Mar 11-18th

Dear subscribers,
Welcome to My Weekly Stock’s debrief for week #11 of 2022 (Mar 11-18th),
Our free weekly newsletter reviews the market performance this week in 10 points:
Marker Performance
SP500 Sector Performance
SP500 Top / Bottom Stock Performers
SP500 Breadth
SP500 Daily Chart
Market Sentiment
Our Chart of the Week
Our Favorite Analysis of the Week
The Week Ahead
My Weekly Stock’s pick
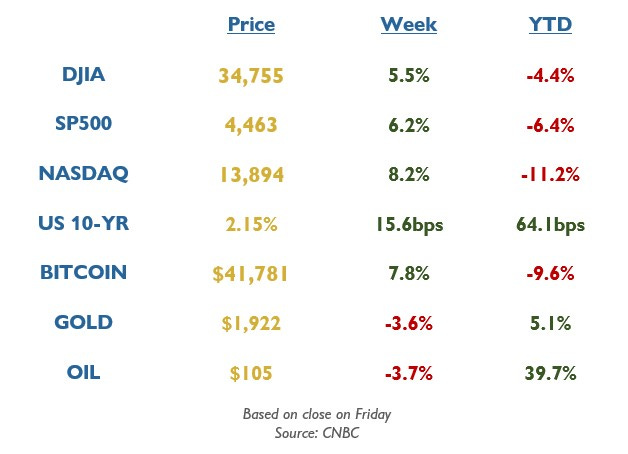
1. Market Performance
The Equity markets just had their best week in almost 18 months. The SP500 had four consecutive daily gains higher than 1% and finished the week up 6.2%. The Dow was up 5.5% and NASDAQ overperformed at 8.2%. The Fed increased its benchmark rate on Wednesday, but the central bank action came with no surprise to the markets. Energy prices finally cooled down, and Oil moved back below $100 during the week before recovering on Friday.
Year-to-date, all major equity indexes remain down despite this week's recovery, while Oil and Gold show positive returns.
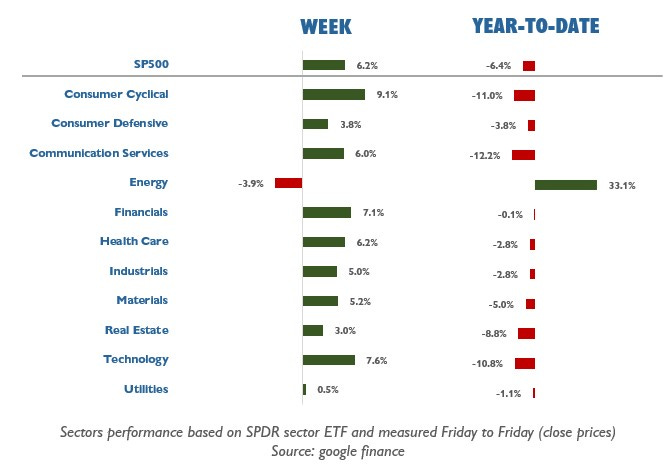
2. SP500 Sector Performance
In almost perfect contrast to the previous week, we saw a broad-based rally in the SP500 with all sectors, except Energy, posting a positive week. Sectors that were heavily beaten down so far in 2022, like Consumer Cyclical and Technology, led the markets higher this week.
The energy sector is still the only positive sector in 2022, while Technology, Communication Services, and Consumer Cyclical remain slightly in correction territory.
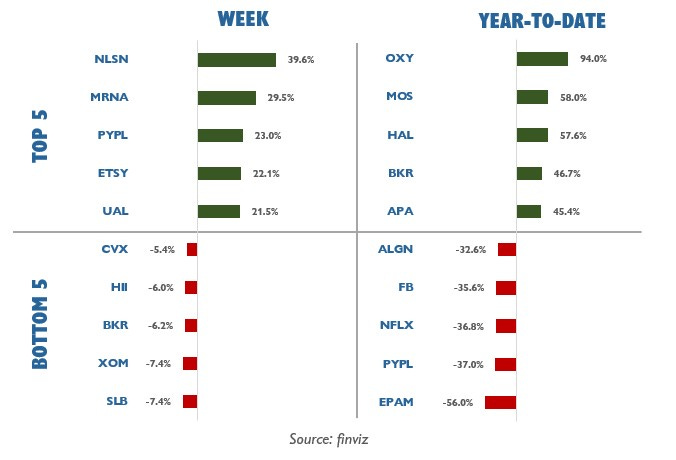
3. SP500 Top / Bottom Stock Performers
The shift in momentum is visible in the individual performance. This week's worst performers are all energy stocks, while cyclical stocks led the market higher. Moderna (MRNA) surged higher after the company requested the FDA to approve an additional COVID vaccine booster. Nielsen (NLSN) closed up 40% after reports surfaced that a private equity group could acquire the company.
Despite the cooldown of this week, the best performers in 2022 are sill energy stocks. The worst performers remain mostly technology stocks, with Facebook (FB) and Netflix (NFLX) down more than 40% in 2022. EPAM lost 56% of its value as the software company has large software development sites in Ukraine, Russia, and Belarus.
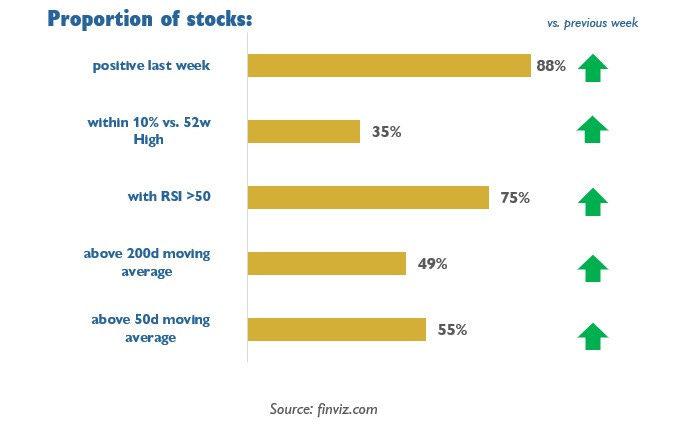
4. SP500 Breadth
This week generated a remarkable shift in momentum. After weeks of continuous negative pressure, many indicators flipped bullish in just five days. 88% of the SP500 components were positive in the last five days. Breadth improved significantly, with half of the index trading above their 200-day or 50-day moving average (vs. only one quarter the previous week).
Read more about market breadth
5. SP500 Daily Chart
The death cross finally happened this week (50-day moving average below 200-day), but it did not prevent the market from rallying strongly. The death cross is a relatively poor timing indicator, and it may signal the bottom has been struck (more about it below). Short-term, the momentum seems to have turned positive, and the index is trading back above its 20-day moving average. RSI and MACD are both on a rising trend, with room to grow.

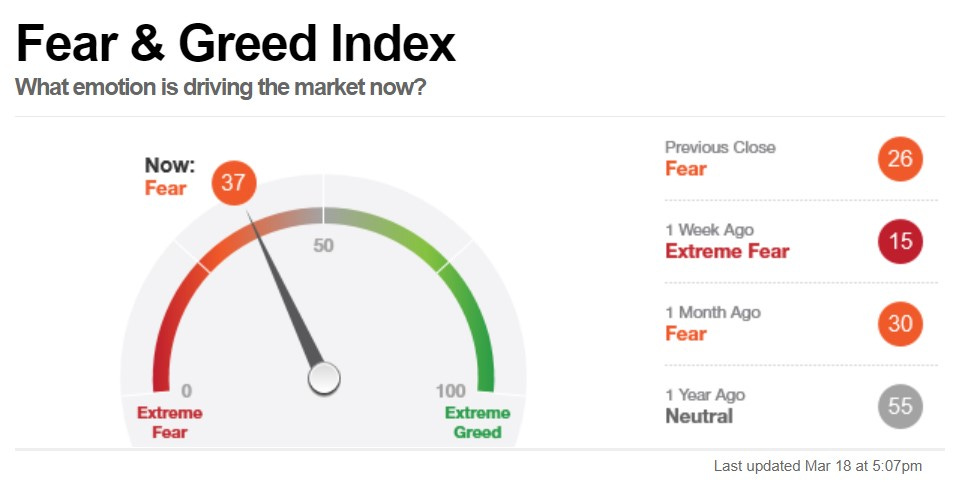
6. Market Sentiment
Fear & Greed Index
CNN's Fear & Greed Index tracks seven investor sentiment indicators and is published daily.
Read more about the Fear & Greed Index
On Friday, the index closed at the “Fear” level (37), a great improvement after hitting a 2022 low the previous week. The VIX finally broke down below 30 and could point to a return to a normal level of volatility in the coming days.
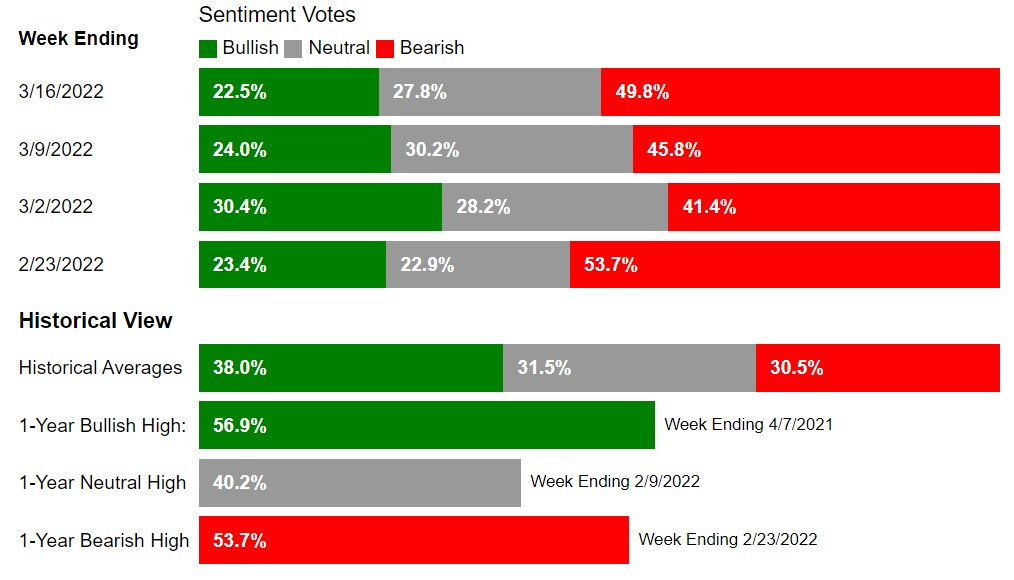
AAII Investor Sentiment Survey
The American Association of Individual Investors surveys each week its members on the direction of the stock market for the next six months. The results are published weekly on Wednesdays.
Read more about the AAII sentiment survey
The last AAII survey reported on March 16th that 50% of the respondents had a bearish outlook for the markets. The reading is deteriorating vs. the previous week but remains below the high struck at the end of February. Currently, the bullish sentiment is below the historical average of 38% for the 17th consecutive week. However, we can expect an improvement in sentiment after the substantial gains this week.
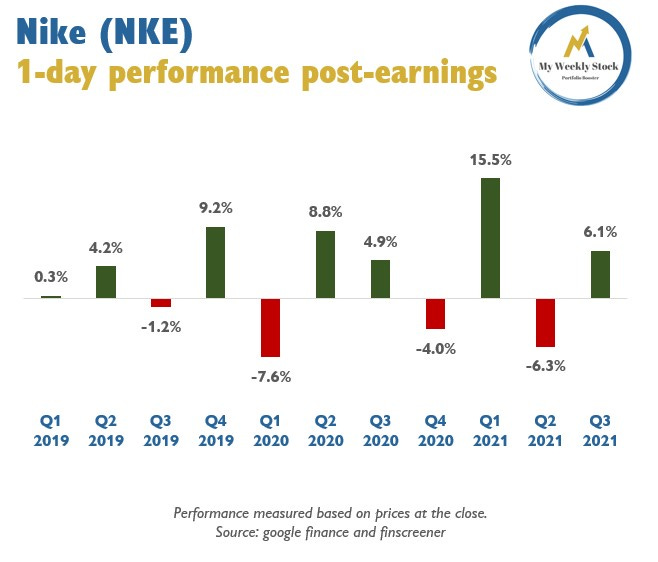
7. Our Chart of the Week
Next week, we will be watching with attention the quarterly report from Nike (NKE). The stock has an interesting stock performance post-earnings, with an average 1-day return after earning of +2%. The stock delivered a positive return in 7 quarters out of 12.
8. Our Favorite Analysis of the Week
SP500 Death Cross
The infamous death cross occurred early this week (50-day moving average below the 200-day). While this event has been feared by many investors, since 2009 it acted as a “buy” signal, as shown by Lance Roberts.


Fed rate hike cycle
Seth Golden reviewed the market performance after the first Fed rate hike. In the last eight hiking cycles, the SP500 was higher 100% of the time one year later.


Year-to-date Performance
The SP500 had its 4th worst start of the year after 48 days of trading. Charlie Bilello reviewed the five worst year start, and all saw a tremendous comeback in the rest of the year.


9. The Week Ahead
The earning season is approaching its end. Next week will be relatively calm, with the main reports being Nike, General Mills, and Adobe.
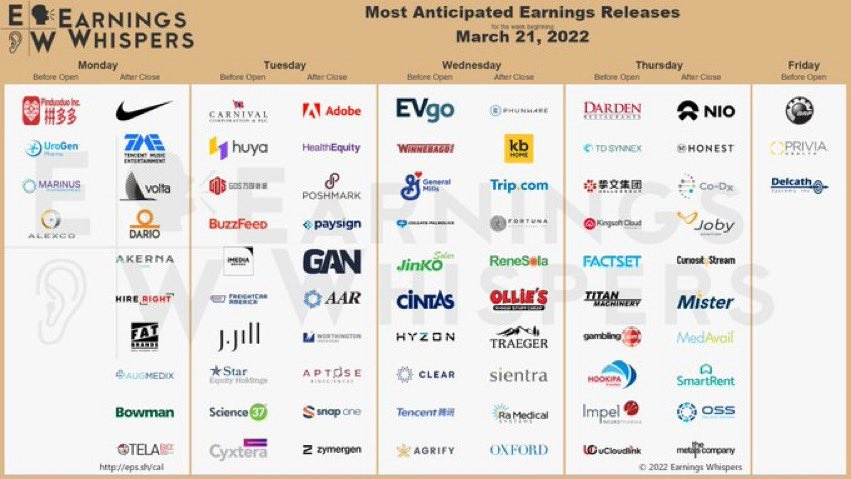
The week will also be relatively quiet on the economic data front. Fed Chairman is scheduled to speak on Monday, and we may hear more about the recent Fed meeting.

10. My Weekly Stock Pick
Our stock pick was CVX, and it finished the week down 2.7% (Monday open to Friday close). In 2022, My Weekly Stock’s picks are up 30% (no leverage, buy and hold five days), and our options trading is up 195%.
Access our performance tracking here.
For the coming week, we will trade a stock in the financial sector. You can learn more about our trading approach in the article below:
Read more about our trading approach here.
Join us to unlock My Weekly Stock’s pick, access our trading plan, and receive timely buy/sell alerts. We currently have a 14-day free trial!
That’s all for My Weekly Stock’s debrief for week #11 of 2022 (Mar. 11-18th).
If you enjoy reading our newsletter, you can share it via the link below:
You can also follow us on Twitter where we post many more charts during the week.
Finally, if you have any feedback or question about the newsletter, you can reply directly to this email.
Have a lovely trading week,
My Weekly Stock
Disclaimer
My Weekly Stock shares information and content on our websites, social networks, or newsletters only for educational purposes. The information contained in our publications has been prepared based on publicly available information and proprietary research. The author does not guarantee the correctness, accuracy, or completeness of the information provided.
All information provided by My Weekly Stock or its affiliates is impersonal and not tailored to your needs, your investment objectives, or your financial situation. Nothing contained in the report shall constitute financial advice or an investment recommendation.
You are solely responsible for your own investment decisions. We recommend consulting with a registered investment advisor, broker-dealer, or financial advisor. If you choose to invest, with or without seeking advice, then any consequences resulting from your investments are your sole responsibility. We are neither liable nor responsible for any profits or losses arising from any investment decision you have taken or made based on information we provide on our websites, social networks, or newsletters.
By using this site, newsletter, or any information provided herein, you indicate your consent and agreement to the terms of this disclaimer.