

My Weekly Stock Debrief - Mar 25 - Apr 1
My Weekly Stock Debrief - Mar 25 - Apr 1

Dear subscribers,
Welcome to My Weekly Stock’s debrief for week #13 of 2022 (Mar 25-Apr 1st), our weekly newsletter reviewing the market performance this week in 10 points:
Marker Performance
SP500 Sector Performance
SP500 Top / Bottom Stock Performers
SP500 Breadth
SP500 Daily Chart
Market Sentiment
Our Chart of the Week
Our Favorite Analysis of the Week
The Week Ahead
My Weekly Stock’s pick
You can subscribe and receive this newsletter directly into your mailbox every week!
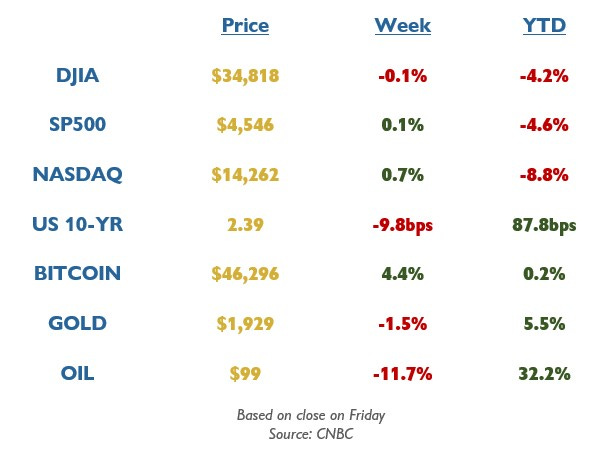
1. Market Performance
The equity markets were flat for the week, with the SP500 finishing up 0.1% and the NASDAQ +0.7%. The stock indices were due for a pause after the rally since mid-March. The strong job report of Friday further supports the expectation of a 50 basis points rate hike in May. The key yield curve finally inverted this week (10-year rate lower than the 2-year), which historically has been a signal of a future economic recession. However, the recession's timing and its impact on the stock market are not easy to predict (more about that below). Oil dropped below $100 after the US released more barrels from its strategic reserve.
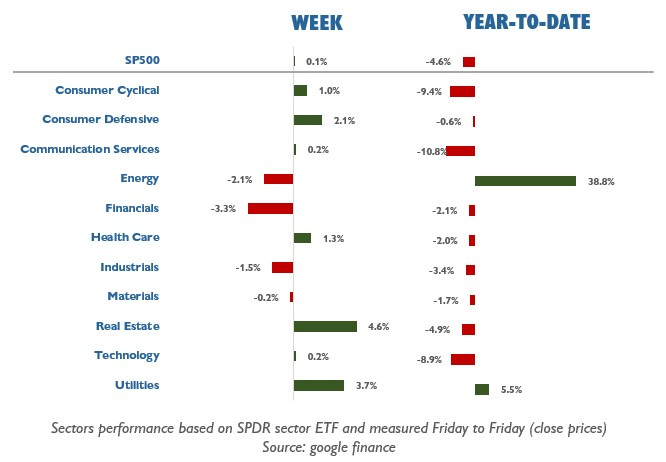
2. SP500 Sector Performance
We saw a mixed performance, with 7 out of the 11 SP500 sectors positive this week. Real Estate and Utilities led the market while Energy and Financials lagged.
Energy remains the undisputable winner of 2022 with a 39% gain, while Utilities Is the only other positive sector this year, and Communication Services is the only remaining sector in correction territory.
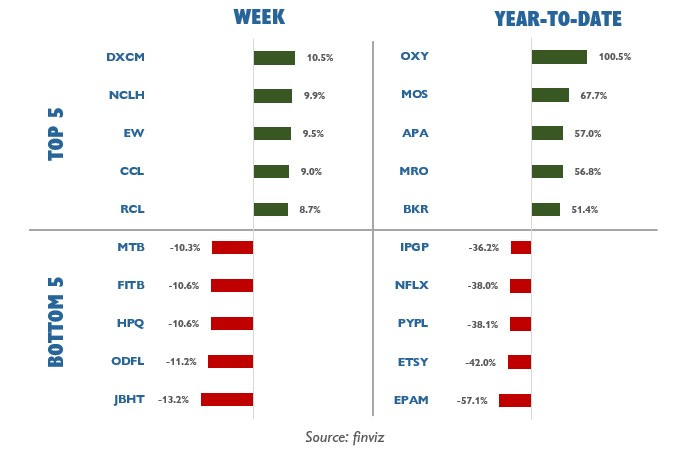
3. SP500 Top / Bottom Stock Performers
The cruise industry was the week's winner after the CDC lifted its travel health advisory for cruise ships. Due to demand concerns, transport stocks like JBHT or ODFL declined more than 10%. Friday, a report from the Department of Labor showed that the number of truck transportation jobs reduced in March after almost two years of consecutive increases.
The best performers in 2022 remain energy stocks. The worst performers are mostly growth/technology stocks, with Paypal (PYPL) and Netflix (NFLX) down almost 40% in 2022. EPAM lost close to 60% of its value as the software company has large software development sites in Ukraine, Russia, and Belarus.
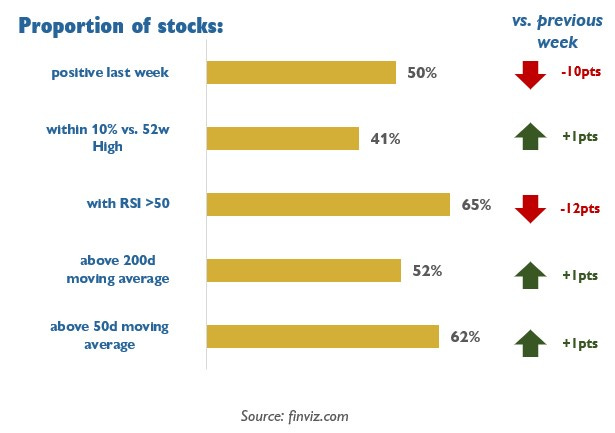
4. SP500 Breadth
While the index traded flat for the week, most individual stocks hold their respective 200-day and 50-day moving averages, which is constructive in the short term. 41% of the SP500 stocks are trading within 10% of their 52-week highs, improving by 8 points in March.
Read more about market breadth
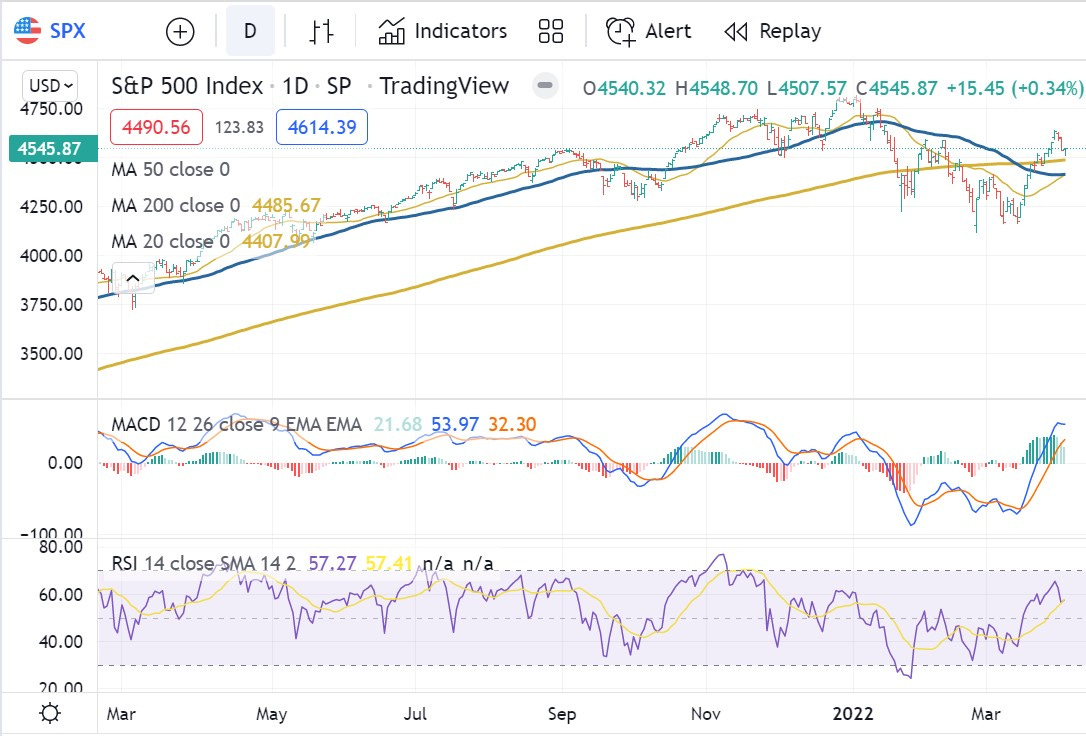
5. SP500 Daily Chart
The SP500 consolidated this week and found resistance around the February high. The index closed above its 200-day moving average for the second week in a row. A successful retest of the moving average could fuel another leg up for the markets, especially as we start the most favorable month of the year historically.
6. Market Sentiment
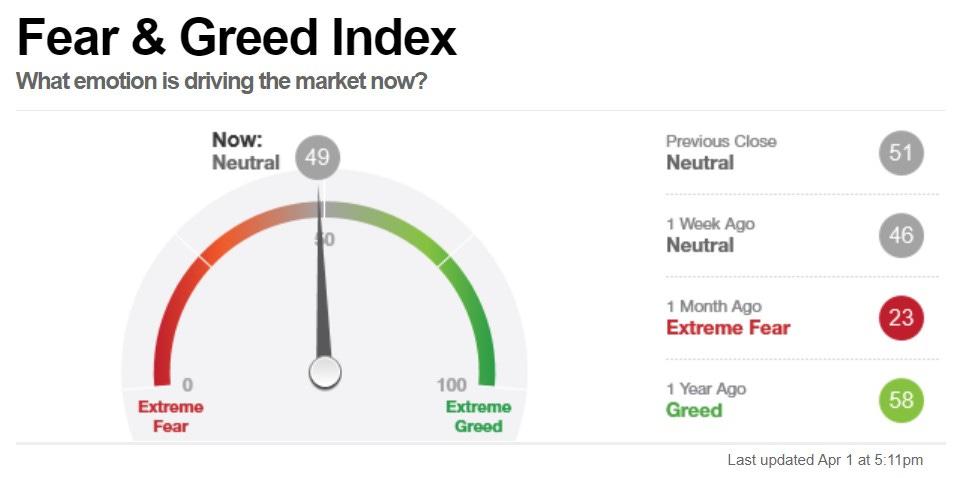
Fear & Greed Index
CNN's Fear & Greed Index tracks seven investor sentiment indicators and is published daily.
Read more about the Fear & Greed Index.
On Friday, the indicator closed at the “Neutral” level (49), gradually improving since hitting a 2022 low mid-march. The VIX finally closed the week below 20, and volatility is normalizing in the markets.
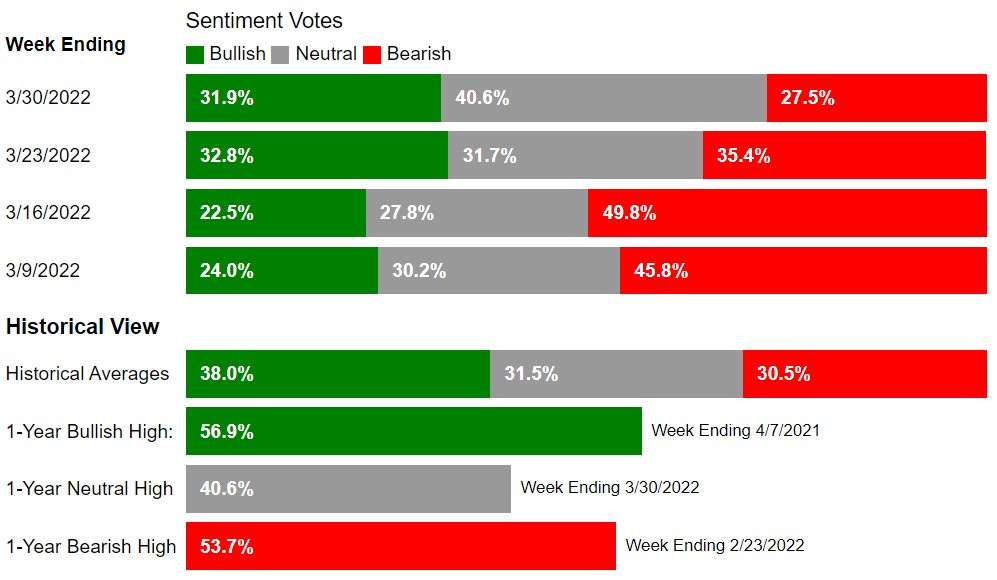
AAII Investor Sentiment Survey
The American Association of Individual Investors surveys each week its members on the direction of the stock market for the next six months. The results are published weekly on Wednesdays.
Read more about the AAII sentiment survey
The last AAII survey reported on March 30th that 28% of the respondents had a bearish outlook for the markets, resuming its decline since mid-march. The “neutral” view is at a 1-year high, signaling that market participants may be more in a wait-and-see position after poor Q1 performance but a strong rally over the last three weeks.
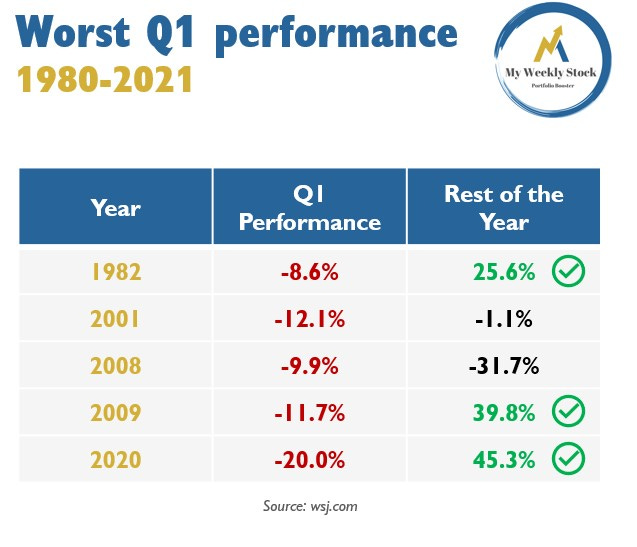
7. Our Chart of the Week
The SP500 closed the first quarter down 4.6%, only the 14th time finishing Q1 negative since 1980 (33% of instances). 2022 is the 6th worst Q1 performance since 1980, and in the five other instances, the index largely recovered during the remaining of the year except in 2008.
8. Our Favorite Analysis of the Week
Momentum reversal continues
The reversal of momentum in the past few weeks is visible in many indicators like the one chosen by Dan Russo. For the first time in 2022, more than half of the NYSE stocks are trading above their 50-day moving averages.


Rate inversion
Yield-curve inversion may be a good indicator of future economic recession, but it does not mean stock markets have to go down. Liz Young shows that the last 8 yield-curve inversions led to an average 11.5% return for the SP500.


SP500’s most and least rate-sensitive industries
As the market expects a total of 8 quarter-point rate increases from the FED, Gina Martin Adams shares below how industries performed during the last 4 rate hikes.


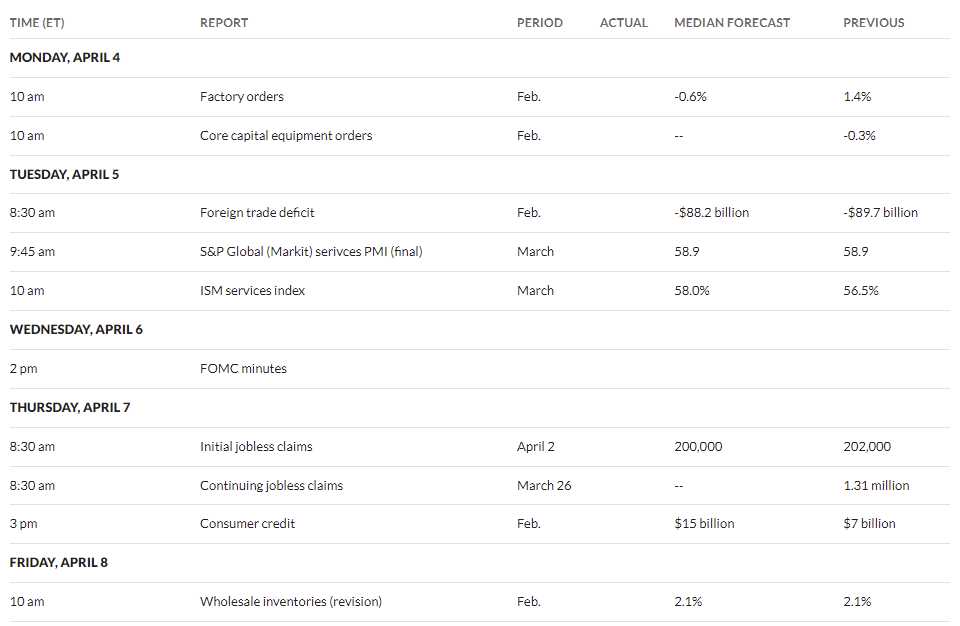
9. The Week Ahead
Few earnings reports next week as this earning season is approaching its end. The main reports will be Levi Strauss, Constellation Brands, and Conagra.

No significant economic report is expected next week. The minutes from the last Fed meeting will be released next week and could give us more insights into the Federal Reserve plans.
Beyond earnings and economic reports, the investors will monitor the developments around Ukraine.
10. My Weekly Stock Pick
Our stock pick was TRV, and it finished the week down 1.5% (Monday open to Friday close). In 2022, My Weekly Stock’s picks are up 33% cumulatively (no leverage, buy and hold five days), and our options trading is up 189%.
Access our performance tracking here.
For the coming week, we will trade a stock in the consumer defensive sector that was up double-digits in March and is trading less than 1% from its 52-week high. You can learn more about our trading approach in the article below:
Read more about our trading approach here.
Join us to unlock My Weekly Stock’s pick, access our trading plan, and receive timely buy/sell alerts. Leverage our 14-day free trial to learn more about our approach!
That’s all for My Weekly Stock’s debrief for week #13 of 2022 (Mar. 25 - Apr 1st).
If you enjoy reading our newsletter, you can share it via the link below:
You can also follow us on Twitter where we post many more charts during the week.
Finally, if you have any feedback or question about the newsletter, you can reply directly to this email.
Have a lovely trading week,
My Weekly Stock
Disclaimer
My Weekly Stock shares information and content on our websites, social networks, or newsletters only for educational purposes. The information contained in our publications has been prepared based on publicly available information and proprietary research. The author does not guarantee the correctness, accuracy, or completeness of the information provided.
All information provided by My Weekly Stock or its affiliates is impersonal and not tailored to your needs, your investment objectives, or your financial situation. Nothing contained in the report shall constitute financial advice or an investment recommendation.
You are solely responsible for your own investment decisions. We recommend consulting with a registered investment advisor, broker-dealer, or financial advisor. If you choose to invest, with or without seeking advice, then any consequences resulting from your investments are your sole responsibility. We are neither liable nor responsible for any profits or losses arising from any investment decision you have taken or made based on information we provide on our websites, social networks, or newsletters.
By using this site, newsletter, or any information provided herein, you indicate your consent and agreement to the terms of this disclaimer.