


My Weekly Stock Debrief - Mar 4-11th

Dear subscribers,
Welcome to My Weekly Stock’s debrief for week #10 of 2022 (Mar 4-11th),
Our free weekly newsletter reviews the market performance this week in 10 points:
Marker Performance
SP500 Sector Performance
SP500 Top / Bottom Stock Performers
SP500 Breadth
SP500 Daily Chart
Market Sentiment
Our Chart of the Week
Our Favorite Analysis of the Week
The Week Ahead
My Weekly Stock’s pick
1. Market Performance
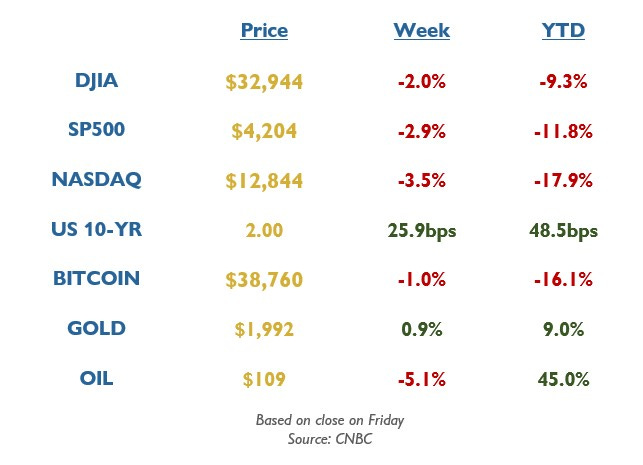
The Dow Jones closed a 5th consecutive negative week, down 2%, while the SP500 and the NASDAQ lost 2.9% and 3.5%, respectively. Tie war in Ukraine, inflation, and oil prices were again the main concerns this week. The oil prices briefly passed the $130 mark during the week before pairing gains. The consumer price index came in at 7.9% in February, and economists expect an even higher level in March.
Year-to-date, the SP500 is again in correction territory, down 12% in 2022. Riskier assets like the Nasdaq and Bitcoin continue to underperform, while Oil and Gold are up this year.
2. SP500 Sector Performance
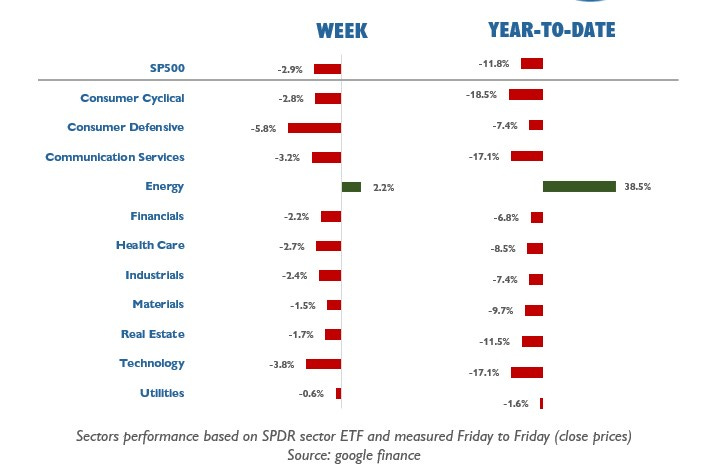
Quite a broad-based decline in the SP500 with all sectors, except Energy, posting a negative week. The consumer defensive sector, usually a safer bet in an uncertain environment, was the worst performer, losing more than 5%.
The energy sector is still the only positive sector in 2022, while Technology, Communication Services, and Consumer Cyclical remain deeply in correction territory.
3. SP500 Top / Bottom Stock Performers
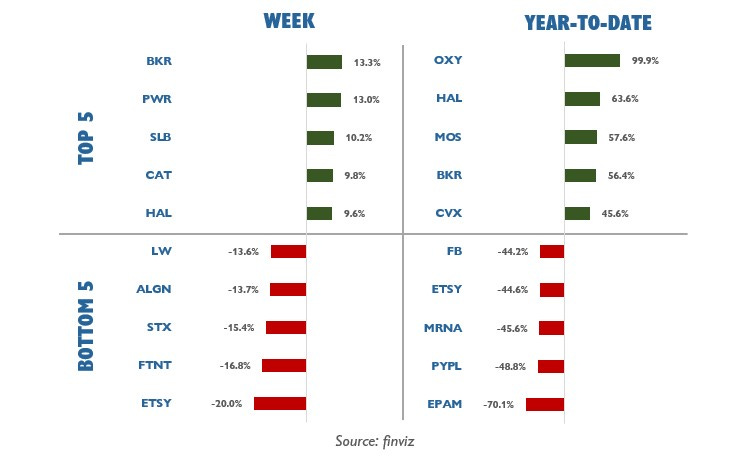
Oil service companies like Baker Hughes (BKR) or Schlumberger (SLB) were among the top performers of the SP500. These stocks benefitted from the ban of Russian oil imports from the US and the expectations of higher production in the US.
ETSY was the worst performer of the SP500. The stock dropped more than 10% on Friday after Deutsche Bank initiated a coverage with a hold rating and a price target with little upside.
Unsurprisingly, the best performers in 2022 are energy stocks. The worst performers remain mostly technology stocks, with Facebook (FB) and Netflix (NFLX) down more than 40% so far in 2022. EPAM lost 70% of its value as the software company has large software development sites in Ukraine, Russia, and Belarus
4. SP500 Breadth
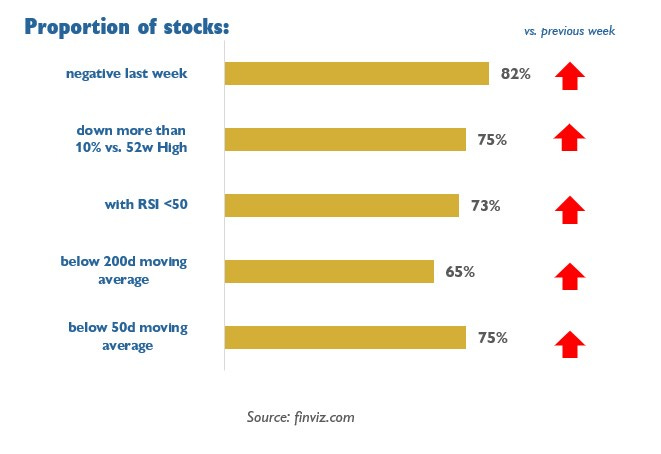
82% of the SP500 components were negative in the last five days. Breadth remains relatively poor with three-quarters of the SP500 in correction territory and all the indicators worsening v. the previous week.
Read more about market breadth
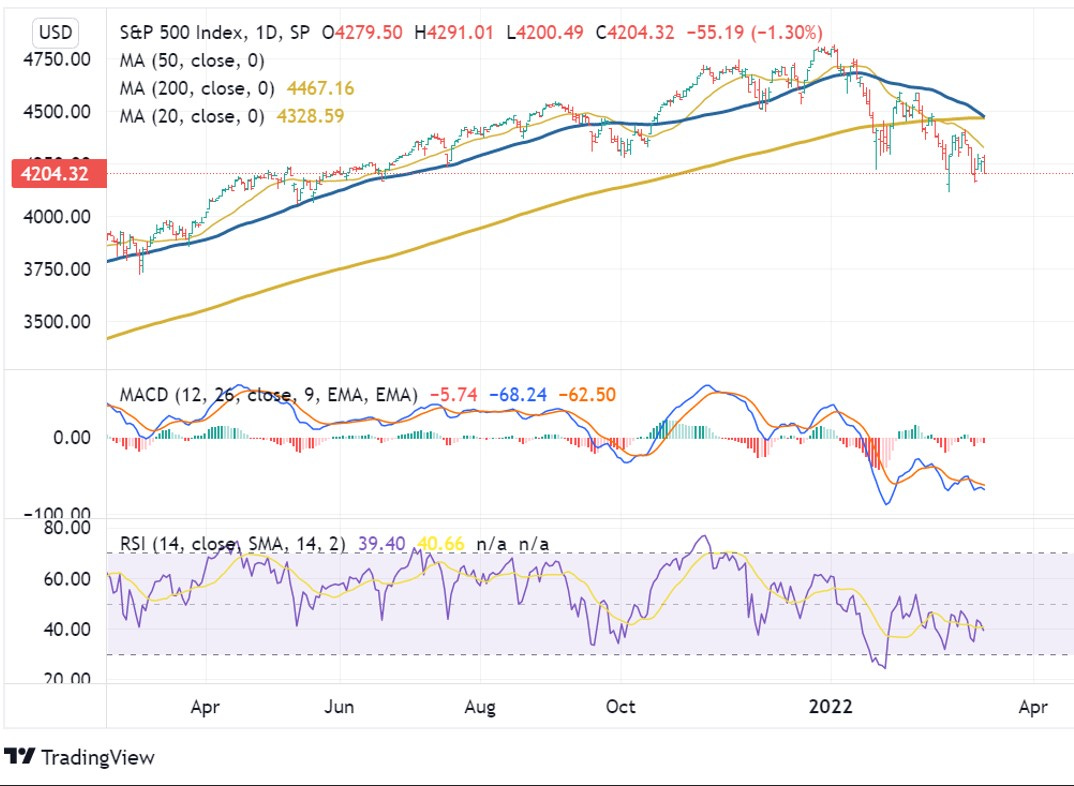
5. SP500 Daily Chart
The SP500 remained below its 20, 50, and 200-day moving averages. The 50-day moving average is very close to crossing the 200-day one, signaling potentially more downside ahead. On the bright side, this crossing, known as the death cross, is rather a lagging indicator. The last time it happened, in March 2020, it actually signaled the bottom of the Covid sell-off.
Overall, neither moving averages nor the technical indicators like the MACD or RSI are flashing any sign of trend change, and the current market momentum is on the downside.
6. Market Sentiment
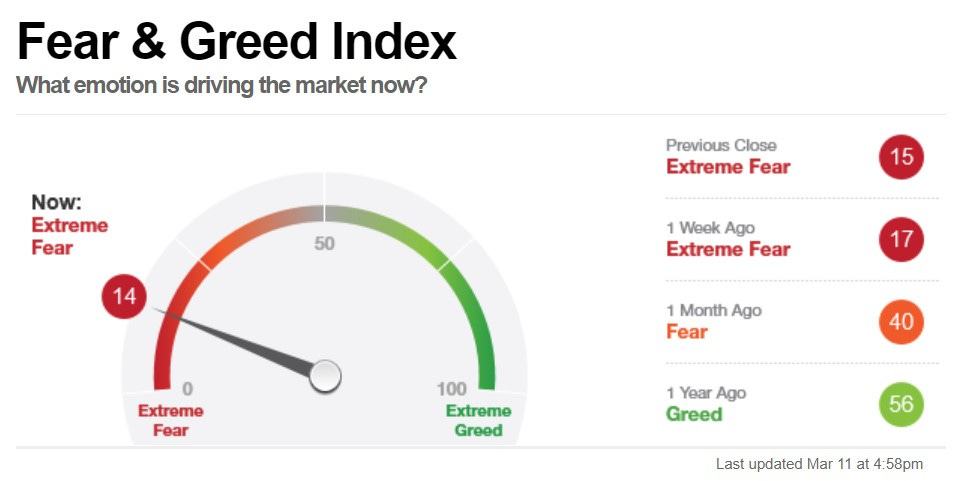
Fear & Greed Index
CNN's Fear & Greed Index tracks seven investor sentiment indicators and is published daily.
Read more about the Fear & Greed Index
On Friday, the index closed at the “Extreme Fear” level (14), the lowest level of 2022 and worsening vs. from the previous week. The VIX is still above 30 and points out for more volatility ahead.
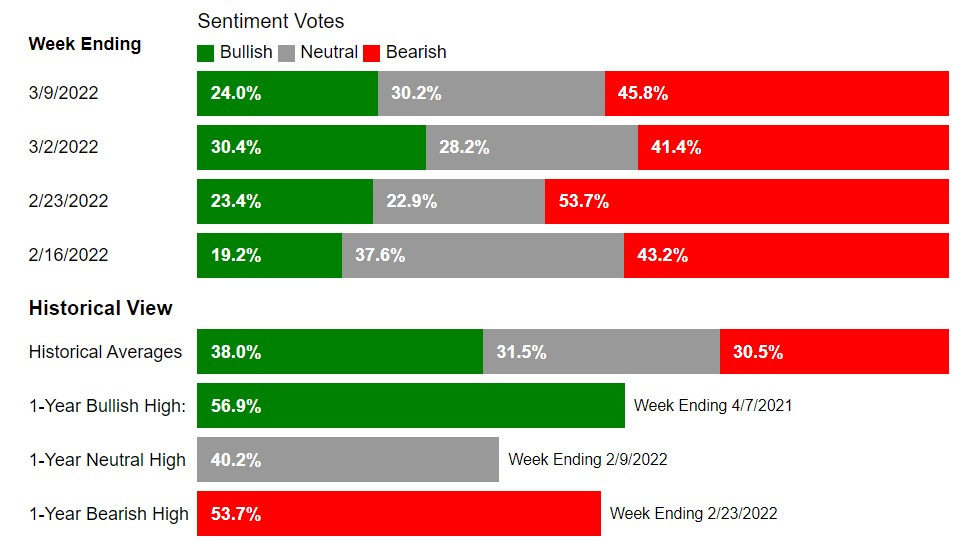
AAII Investor Sentiment Survey
The American Association of Individual Investors surveys each week its members on the direction of the stock market for the next six months. The results are published weekly on Wednesdays.
Read more about the AAII sentiment survey
The last AAII survey reported on March 9th that 46% of the respondents had a bearish outlook for the markets. The reading is deteriorating vs. the previous week but remains below the high struck at the end of February. Currently, the bullish sentiment is below the historical average of 38% for the 16th consecutive week.
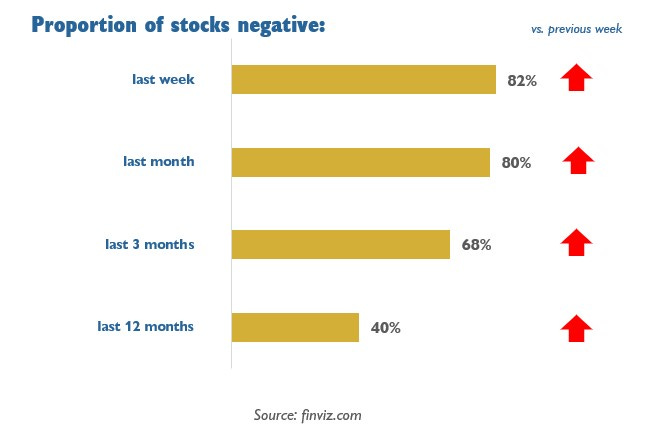
7. Our Chart of the Week
This market correction is picking up steam as 80% of the SP500 declined last month. On the positive side, the majority of the stocks are still positive in the past 12 months.
8. Our Favorite Analysis of the Week
Correction & 50-day moving average
This correction is quite unusual as many stocks remain above their 50-day moving average. Dean Christians points out that more stock capitulation may be seen before a bottom is finally struck.


When will the market bottom?
A great article from Joseph Fahmy published on YahooFinance reviewing the five things that need to happen before the market can finally turn around.


Mid Term Year
It is pretty common to see corrections in midterm years, and the performance in 2022, while painful, is still below the historical average of midterm years. On the positive side, as pointed out by Ryan Detrick, the returns a year later are usually excellent.


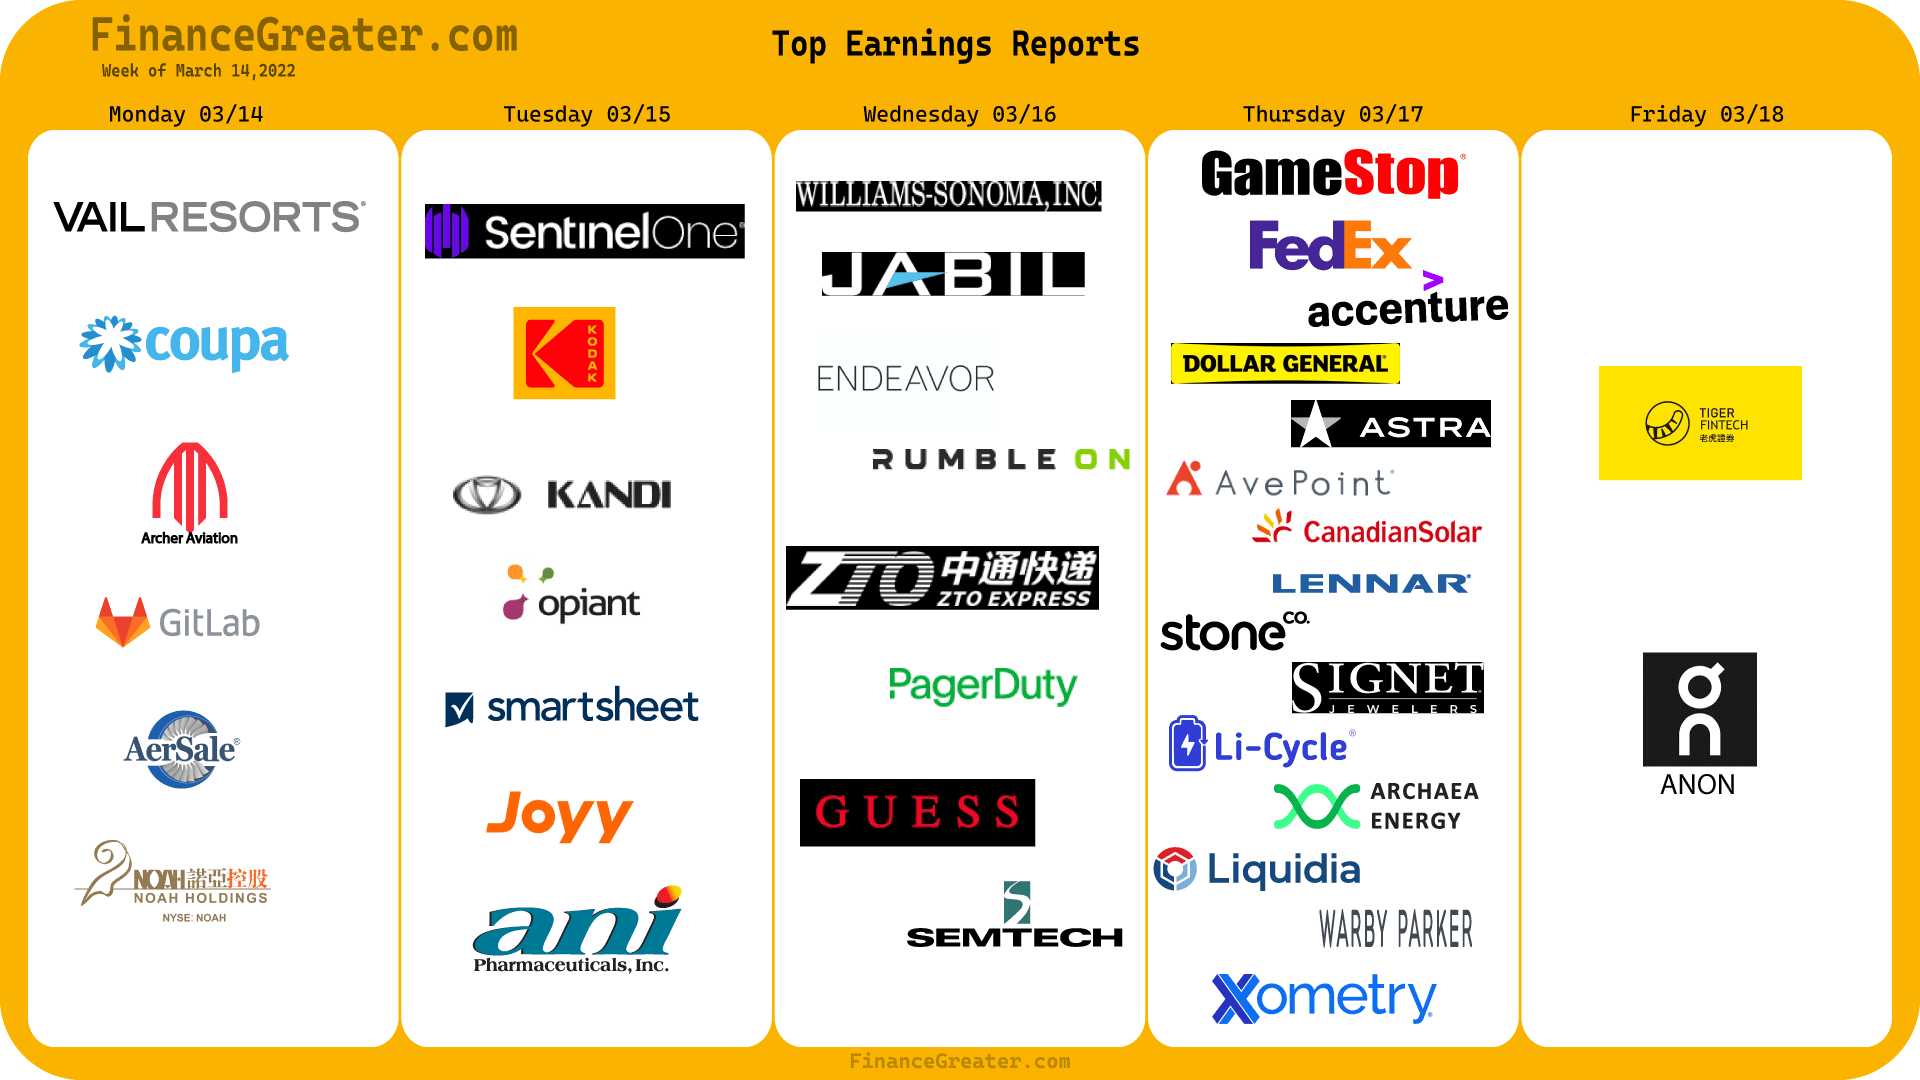
9. The Week Ahead
The earning season is approaching its end. Next week will be relatively calm, with the main reports being GameStop, FedEx, and Dollar General on Thursday.
Access the earnings calendar here
All eyes will be on the Fed meeting starting Tuesday. The FOMC rate decision is expected on Wednesday at 2 pm ET and will be followed by the press conference by the Fed Chairman. While a quarter rate hike is expected, the market will be watching any comment from the FED on the recent hot inflation reports and the trajectory of future rate increases.

Access the economic calendar here
Beyond earnings and economic reports, the investors will continue to monitor the situation in Ukraine. The European Union is hinting that further sanctions are coming. Overall, we expect another volatile week for the equity markets, and we will trade with caution.
10. My Weekly Stock Pick
Our stock pick finished the week up 6.9% (Monday open to Friday close). In 2022, My Weekly Stock’s picks are up 34% (no leverage, buy and hold five days), and our options trading is up 218%.
Access here our performance tracking
We will trade a stock from the energy sector for the coming week. Join us to unlock My Weekly Stock’s pick, access our trading plan, and receive timely buy/sell alerts. We currently have a 14-day free trial!
That’s all for My Weekly Stock’s debrief for week #10 of 2022 (Mar. 4-11th).
If you enjoy reading our newsletter, please share it via the link below:
You can also follow us on Twitter where we post many more charts during the week.
Finally, if you have any feedback or question about the newsletter, you can reply directly to this email.
Have a lovely trading week,
My Weekly Stock
Disclaimer
My Weekly Stock shares information and content on our websites, social networks, or newsletters only for educational purposes. The information contained in our publications has been prepared based on publicly available information and proprietary research. The author does not guarantee the correctness, accuracy, or completeness of the information provided.
All information provided by My Weekly Stock or its affiliates is impersonal and not tailored to your needs, your investment objectives, or your financial situation. Nothing contained in the report shall constitute financial advice or an investment recommendation.
You are solely responsible for your own investment decisions. We recommend consulting with a registered investment advisor, broker-dealer, or financial advisor. If you choose to invest, with or without seeking advice, then any consequences resulting from your investments are your sole responsibility. We are neither liable nor responsible for any profits or losses arising from any investment decision you have taken or made based on information we provide on our websites, social networks, or newsletters.
By using this site, newsletter, or any information provided herein, you indicate your consent and agreement to the terms of this disclaimer.