


Weekly Market Recap (Apr 14-17): Sideways Price Action Keeps Bulls and Bears on Edge
Everything you need to know about last week's markets performance and what to expect next.
Dear readers,
Welcome back to My Weekly Stock, where in-depth market analysis meets proven momentum-based trading strategies. My mission? To help you win in the markets with unbiased, data-driven insights you can act on.
Friday means it's time to review the week in the markets. Each week, I dedicate hours to curating this market recap, preparing insightful analysis with clear visuals and a structured layout—making it easy for you to find exactly what you need, week after week. And because it's easy to get swayed by personal bias, I like to let the data do most of the talking.
Before we dive into this week’s analysis, I’m excited to share a special Easter offer! 🎉Until Monday, you can get 50% off your first year subscription of My Weekly Stock. As a paid subscriber, you’ll gain exclusive access to my winning portfolios—and so much more: A Clear Investing Framework, Momentum-Based Analysis and Live Portfolio Updates
If you’re ready to give it a try—or just want to support my work—this is your chance!
Let's dive in!
SUMMARY
Here are this week's highlights and what to look out for next:
1. The markets were negative this week, with the S&P 500 down -1.5%, the Nasdaq -2.6%, and the Dow Jones -2.7%. Real Estate (+3.9%) and Energy (+3.3%) were the best-performing sectors.
2. The S&P 500's long-term trend is negative, and the short-term momentum is mixed. 5,500 is the next resistance, while 5,220 is support.
3. The Q1 earnings season has started and 59 companies from the S&P 500 index have released their quarterly results, with 68% beating estimates. Earnings are expected to be up 8% in Q1 and 10% in 2025.
4. Market sentiment is at the "Extreme Fear" level (21/100) as measured by CNN’s Fear & Greed indicator, while VIX is at a very high value of 29.
5. Earnings reports from Alphabet and Tesla, and the latest PMI data are scheduled for next week.
My take:
After 2 weeks of extreme volatility, markets attempted to stabilize. We still saw large intra-day moves but the equity indices failed to break through either last week's high or low. While this did not provide much new insight, it confirmed for me that it's still too early to say that the worst is over. Markets remain nervous, with several moving pieces in play—from tariffs and inflation to economic slowdown—all of which are influencing what could come next from the Fed.
So for now, my view on the S&P 500 hasn’t changed much. I’d like to see a move above 5,500, which has capped gains over the past two weeks, and eventually a reclaim of the 30-week EMA—my favorite long-term trend line. Until then, I’m staying cautious and keeping an eye out for the possibility of another leg down.

PERFORMANCE RECAP
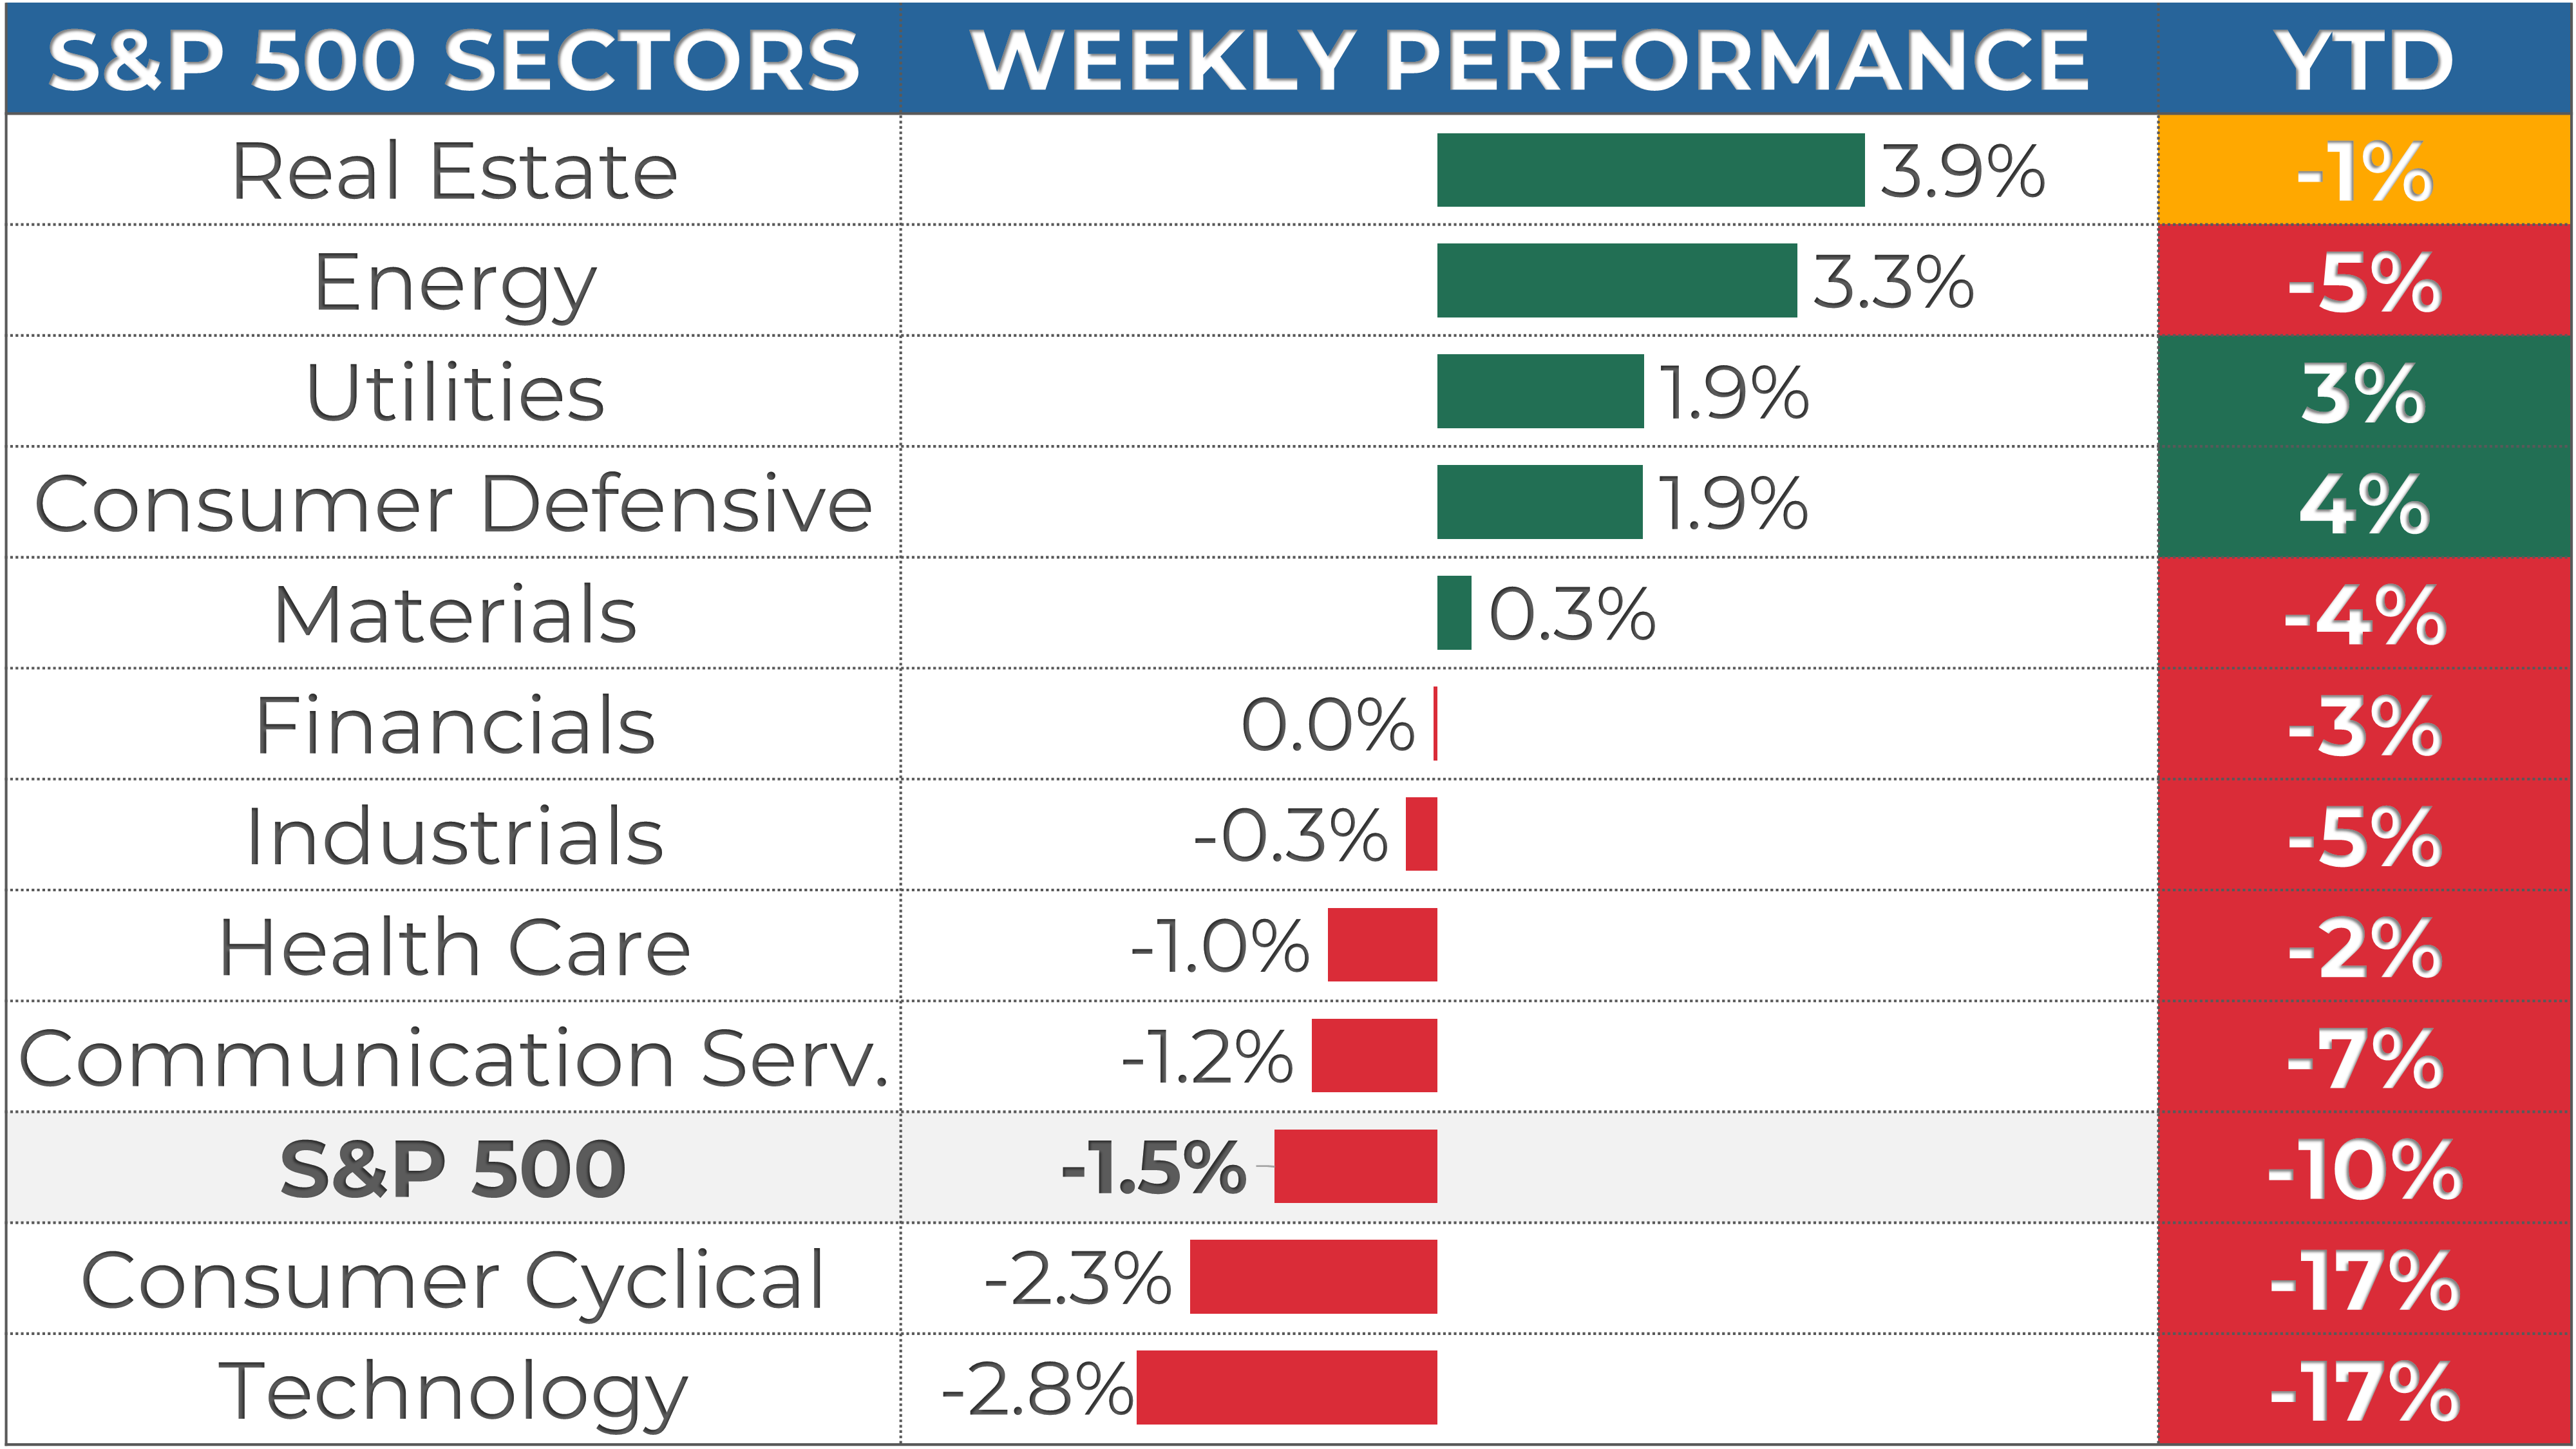
1. S&P 500 Sector Performance
This week, 5 out of the 11 S&P 500 sectors posted gains. Real Estate led the market with a 3.9% increase, while Technology was the laggard, dropping 2.8%.
Year-to-date, 2 sectors have achieved positive performance. Consumer Defensive is the top-performing sector with a 4.2 % gain, while Consumer Cyclical lags behind, with a 17.4 % loss.
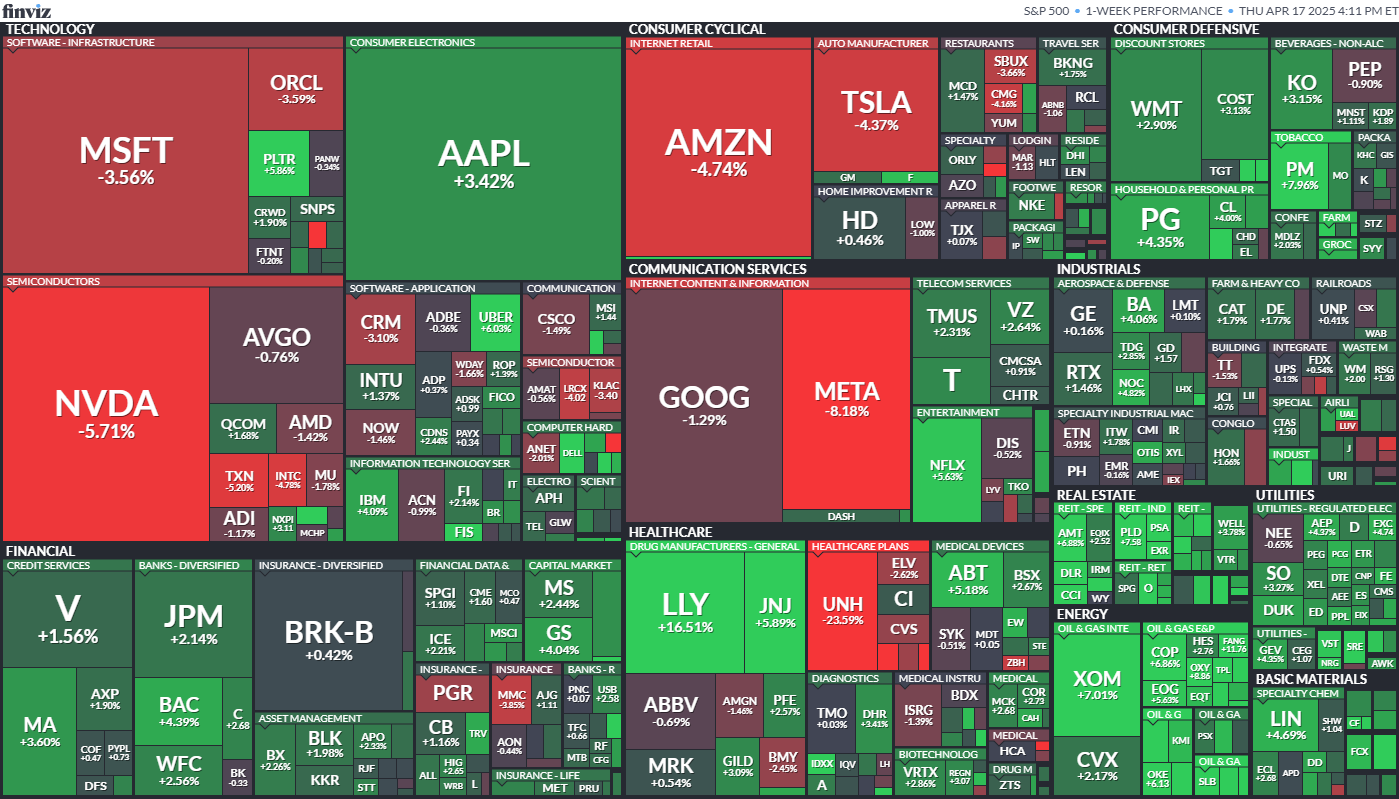
2. S&P 500 Top & Worst Performers
Over the last five trading days, 77% of the stocks in the S&P 500 index rose in value.
Top Performers:
$LLY (Lilly(Eli) & Co): 16.5%
$MOS (Mosaic Company): 12.7%
$FANG (Diamondback Energy Inc): 11.8%
$HAL (Halliburton Co): 11.2%
$APA (APA Corporation): 10.3%
Worst Performers:
$SMCI (Super Micro Computer Inc): -6.5%
$META (Meta Platforms Inc): -8.2%
$DVA (DaVita Inc): -8.7%
$HUM (Humana Inc): -8.9%
$GPN (Global Payments, Inc): -16.6%
In addition, 2 stock within the S&P 500 reached a new 52-week high, while 9 stocks set new lows. The majority of this week’s lows came from the Healthcare sector.
Notable Highs:
$ATO (Atmos Energy Corp)
$TJX (TJX Companies, Inc)
Notable Lows:
$CVX (Chevron Corp)
$MRK (Merck & Co Inc)
$TXN (Texas Instruments Inc)
$ZBH (Zimmer Biomet Holdings Inc)
$JBHT (J.B. Hunt Transport Services, Inc)

MARKET MOMENTUM
1. Momentum Review
To evaluate the market's current health, I examine 4 key elements: performance, breadth, trends, and key levels. Healthy bull markets typically feature indices setting new highs, broad market participation, and ascending trend lines.
Performance (WEAK 🔴): evaluating recent market performance to gauge the momentum’s strength. Ideally i want to see returns accelerating short-term and index trading less than 5% from its 1-year high
1-month performance: -7.2% 🔴
3-month performance: -11.0% 🔴
vs. 1-year high: -14%🔴
Breadth (WEAK 🔴): assessing market participation to understand the health of the trend. Extreme levels (above 80% or below 20%) may indicate overextended trends.
% of stocks above 200-day moving average: 30% (up from 28% last week) 🔴
% of stocks above 20-day moving average: 27% (up from 20% last week) 🔴
Trends: analyzing trend strength across multiple timeframes using exponential moving averages, scored on a scale of 1 to 5. A score of 3 or above suggests solid trends and supports holding a position.
Weekly chart: WEAK ⭐️ (stable vs last week)

Daily chart: WEAK ⭐️ (stable vs last week)

4-hour chart: MIXED ⭐️⭐️ (worst than vs last week)

Key levels: identifying critical price zones to confirm the current trend or signal a potential reversal.
Support:
$4,800 (-9.1%)
$4,950 (-6.3%)
$5,220 (-1.2%)
Resistance:
$5,500 (+4.1%)
$5,775 (+9.3%)
$6,000 (+13.6%)
Enjoying the analysis so far? There’s so much more in the paid version, where I cover 70+ stocks and ETFs every month. Subscribe now to learn how I connect strategy to insights and, ultimately, portfolio decisions.
2. Post of the Week
This week's momentum analysis focuses on extended trends in the S&P 500, employing the Relative Strength Index (RSI) to filter stocks. The RSI is a valuable tool for spotting stocks that are potentially "oversold" (RSI below 30) or "overbought" (RSI above 70). Although I wouldn't rely solely on RSI, it helps identify stocks in extended trends that may be approaching a turning point.
EARNINGS & ECONOMIC REPORTS RECAP
1. Earnings Outlook
Q1 Earnings: S&P 500 earnings are expected to grow by 8%, rising to 10% when excluding the energy sector.
2025 Full-Year Outlook: Earnings are expected to increase by 9%, in line with the 10-year average growth of 9%.
Analyst Revisions: Over the past month, 28% of all earnings revisions by analysts have been upward adjustments to their outlook.
Valuation: The forward 4-quarter P/E ratio stands at 19.2, mostly in line with the 5-year and 10-year historical averages.

2. Earnings Season Recap
Out of 59 S&P 500 companies that have reported first-quarter earnings, 68% exceeded EPS expectations. It is below with the four-quarter average of 77% and in line the historical average of 67%.
Below are some notable companies that reported earnings last week. I’ve highlighted their EPS and revenue performance vs estimate, as well as their stock return this week.
One highlight of the week was UnitedHealth, which missed on Revenues and EPS, and issued a weak guidance that shocked investors. The stock sold off 24% for the week.

3. Economic Reports
March retail sales figures came in stronger than expected, with Core Retail Sales (MoM) rising 0.5%, beating the 0.4% forecast (though down from February’s 0.7%). Headline Retail Sales (MoM) jumped 1.4%, ahead of the 1.3% forecast and a significant acceleration from February’s modest 0.2%.
In his midweek remarks, Chair Jerome Powell expressed a cautious tone, acknowledging that tariff-driven inflation and signs of a slowing economy could pose challenges for the Federal Reserve’s policy path.

MARKET SENTIMENT
Measures of investor sentiment can be helpful as they provide insight into the views and opinions of professional or individual investors. While not definitive predictors of market direction, these measures can serve as a valuable complement to other indicators and analysis tools, helping to paint a more comprehensive picture of the market's current state.
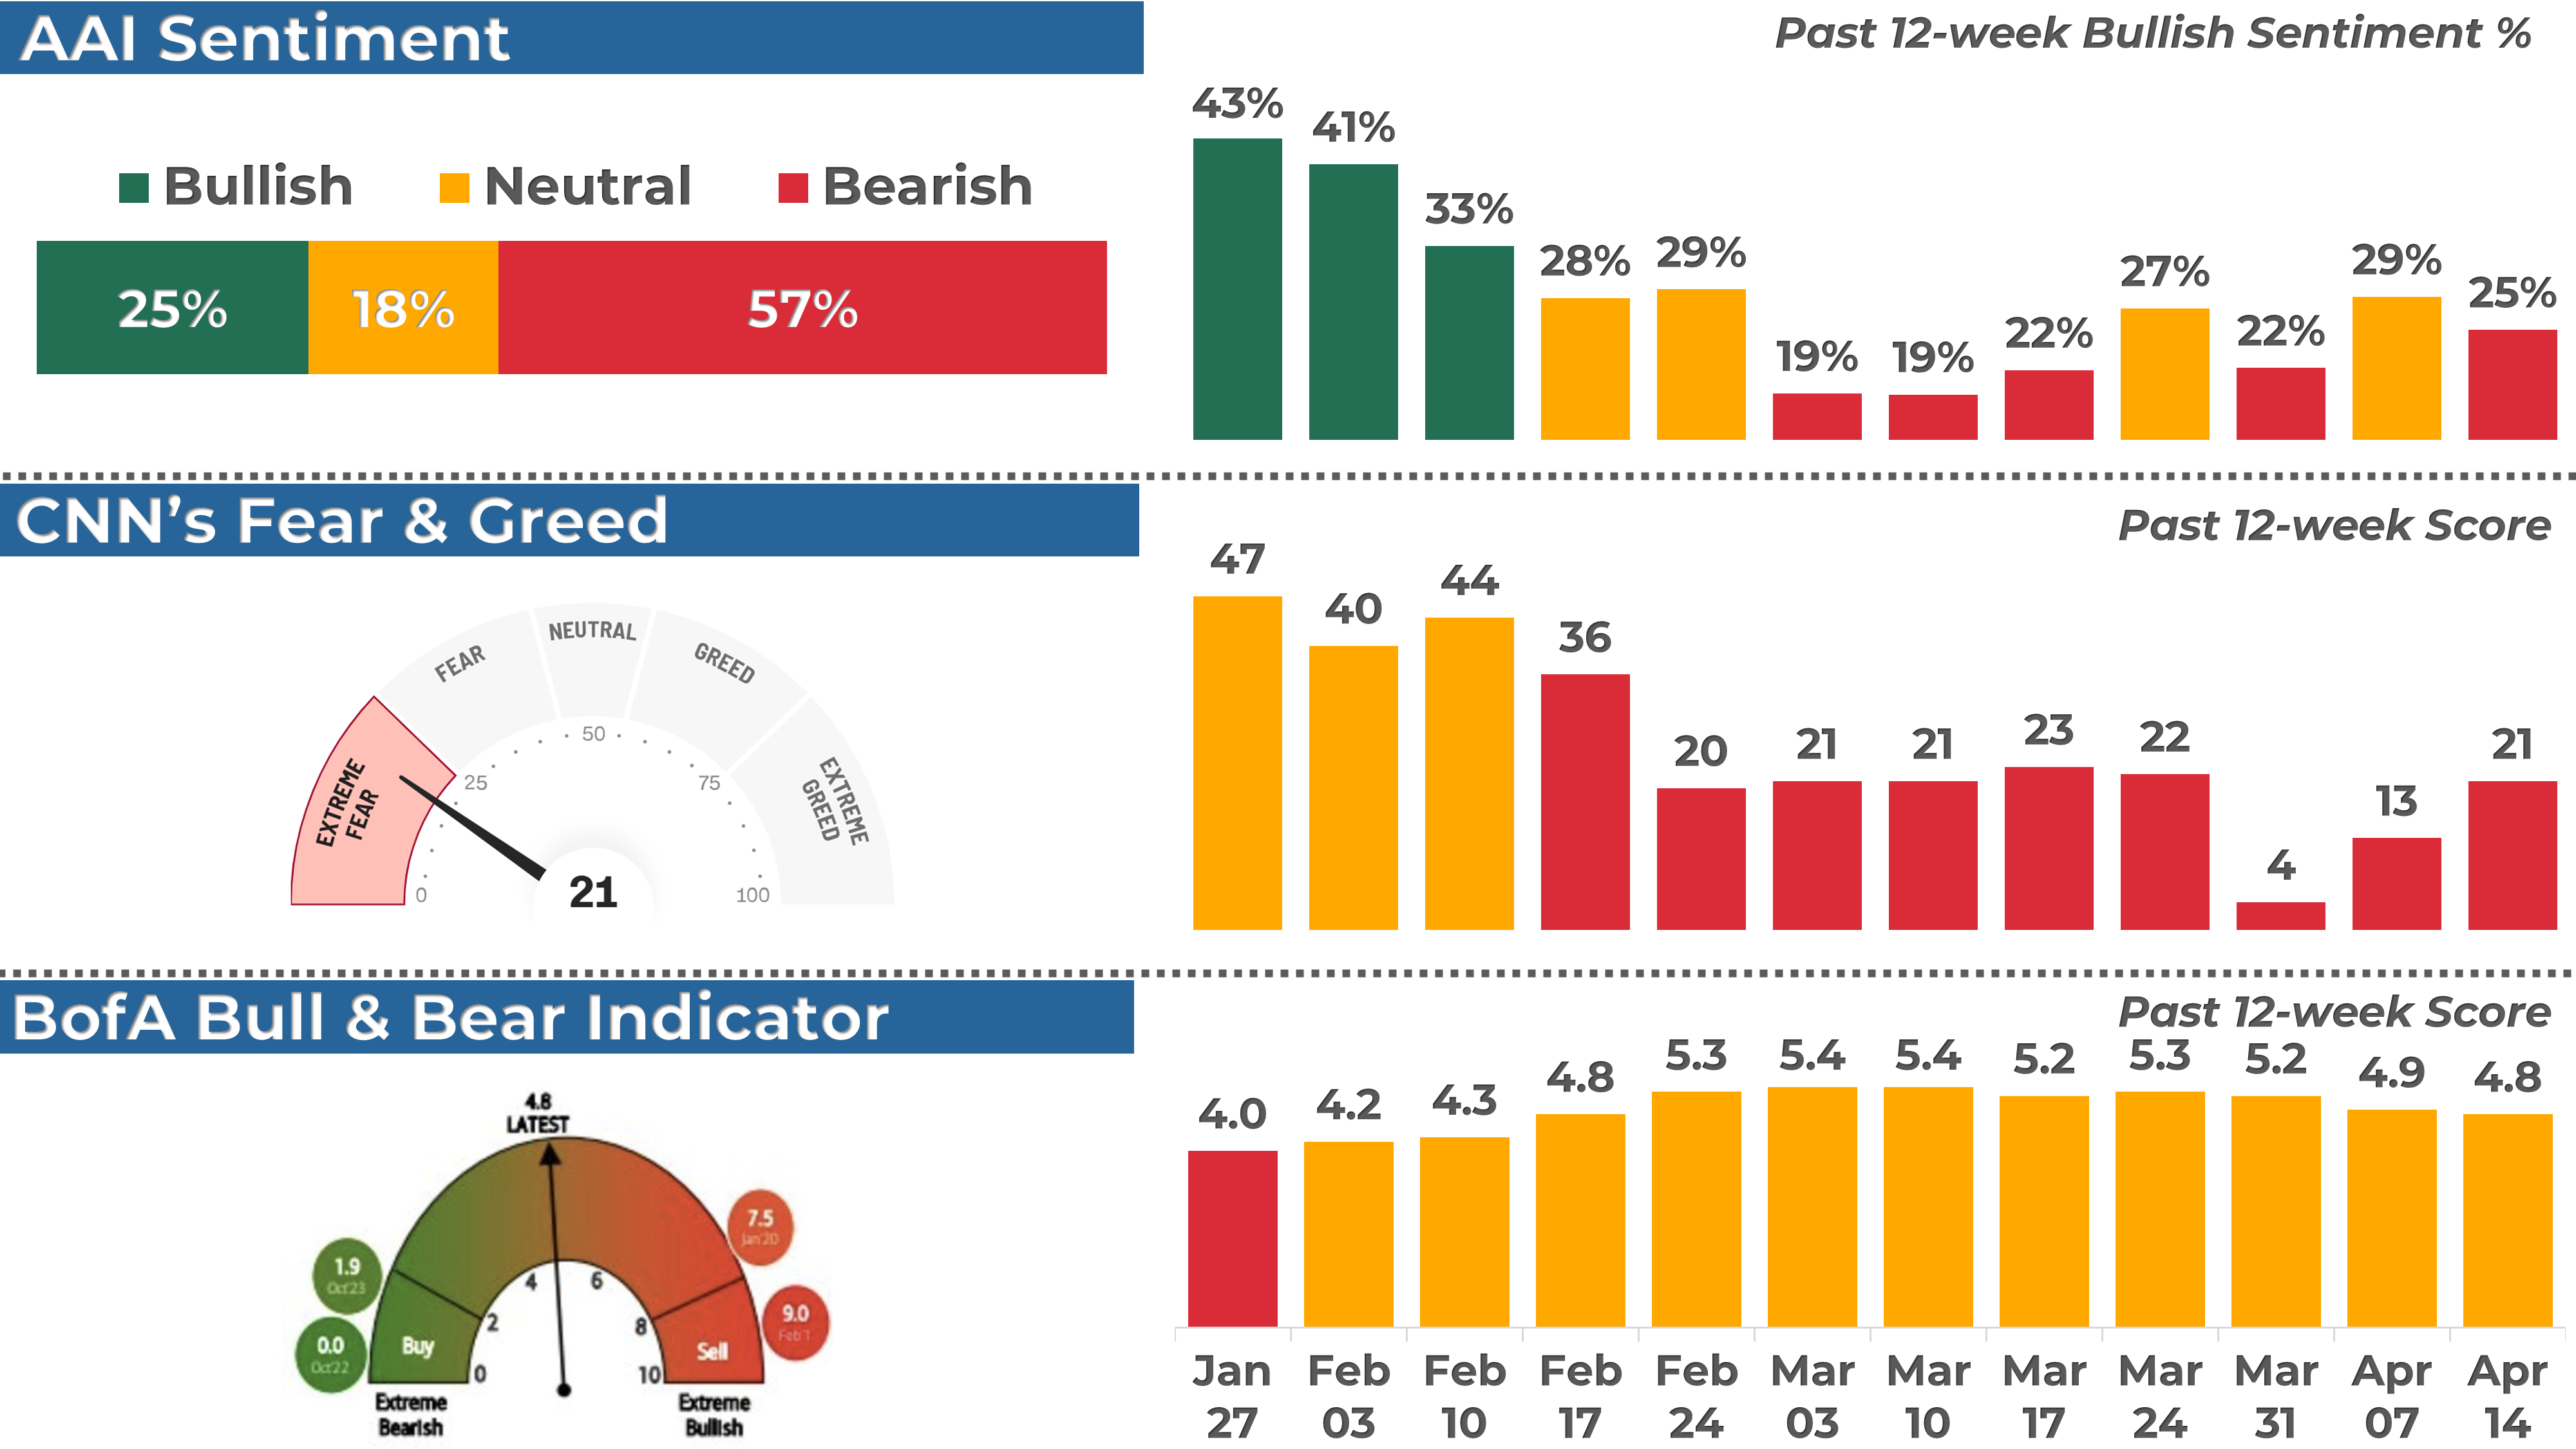
1. AAII Sentiment Survey (Individual Investors)
The American Association of Individual Investors (AAII) conducts a weekly survey to gauge members' expectations for the stock market over the next six months. Results are published every Wednesday.
In the latest survey, 25% of respondents had a bullish outlook, down from 29% the previous week.
2. BofA Bull & Bear Indicator (Institutional Investors)
The Bank of America Bull-Bear Indicator measures investor sentiment based on fund managers' and institutional investors' views. Scores range from 0 (extremely bearish) to 10 (extremely bullish).
The most recent reading was 4.8, a neutral sentiment.
3. CNN Fear & Greed Index (Technical)
This daily measure analyzes seven indicators to assess how emotions drive market decisions. Scores range from Extreme Fear to Extreme Greed.
The index closed at 21 (Extreme Fear), up from 13 last Friday.
THE WEEK AHEAD
1. Economic Calendar
On the agenda next week is the Purchasing Managers' Index (PMI). This index indicates the health of the manufacturing and service sector, directly reflecting economic outlook sentiments from purchasing managers. Set your sights on Wednesday.

2. Earnings Calendar
The earnings season continues next week, and 114 companies from the S&P 500, including Alphabet and Tesla, are expected to release their quarterly results.

Below are notable stocks reporting earnings next week, along with several key indicators I like to monitor:
Stock Indicators:
3-Month Performance: Assessing recent stock trends.
RSI (Relative Strength Index): A reading above 70 suggests overbought conditions, while below 30 indicates oversold.
P/E Ratio: A value below 25 often points to a "cheap" valuation or low growth expectations.
Stock Price Reactions to Earnings:
1-Day Stock Return on Earnings: How the stock performs on its earnings release day.
Implied Volatility: The options market's forecast for the expected 1-day stock move after earnings.

3. Stock Analysis of the Week
Every week, I share my analysis of 1 stock that has reported earnings in recent weeks, focusing on implications for long-term investors. This week, I prepared an analysis of CarMax ($KMX).
👨💻 My View: PASS
CarMax has spent the past two years in a (wide) sideways range, roughly between $56 and $88. After failing to keep momentum in early 2025, the stock is back toward the bottom of that range.
The long-term trend remains weak, with the price below the 30-week EMA. And the latest earnings didn't bring any relief, with the stock continuing its free fall.
If the bottom of the range fails to hold, we could be looking at a major breakdown. But if support holds and a bounce follows, it could offer a good trading opportunity within the range, and maybe more finally. But until then, I prefer to stay on the sidelines.
Check out the post for more details about $KMX performance, trend and key levels.
CONCLUSION
Thank you for reading my Weekly Market Recap, which, I hope, got you ready for the week ahead.
If you want to take your investing journey to the next level, consider upgrading to a paid subscription. Subscribe now and learn more about my holistic, end-to-end momentum approach to investing.
Your first month is free, so this is the perfect opportunity to explore the full value of My Weekly Stock with no commitment!
Thanks again, and I look forward to sharing my market recap with you next week.
Happy investing!
My Weekly Stock
DISCLAIMER
The information provided in this newsletter is for informational purposes only and should not be taken as financial advice. Any investments or decisions made based on the information provided in this newsletter are the reader's sole responsibility. We recommend that readers conduct their own research and consult a qualified financial professional before making investment decisions. The author does not assume any responsibility for any losses or damages arising from using the information provided in this newsletter.