


Weekly Market Recap (Apr 21-25): Bulls Follow Through, Yet Major Hurdles Remain
Everything you need to know about last week's markets performance and what to expect next.
Dear readers,
Welcome back to My Weekly Stock, where in-depth market analysis meets proven momentum-based trading strategies. My mission? To help you win in the markets with unbiased, data-driven insights you can act on.
Friday means it's time to review the week in the markets. Each week, I dedicate hours to curating this market recap, preparing insightful analysis with clear visuals and a structured layout—making it easy for you to find exactly what you need, week after week. And because it's easy to get swayed by personal bias, I like to let the data do most of the talking.
If you want the full experience, consider upgrading your subscription. Paid members get access to all my portfolios, real-time trade alerts, in-depth analysis, and a clear momentum-based framework you can follow and learn from.
Start today. Your first month is completely FREE—no commitment, no pressure. Just a chance to explore the full value of My Weekly Stock.
If you’re ready to give it a try—or just want to support my work—this is your chance!
Let's dive in!
SUMMARY
Here are this week's highlights and what to look out for next:
1. The markets were positive this week, with the S&P 500 up 4.6%, the Nasdaq 6.7%, and the Dow Jones 2.5%. Technology (+8.1%) and Consumer Cyclical (+6.6%) were the best-performing sectors.
2. The S&P 500's long-term trend is negative, but the short-term momentum is improving. 5,550 is the next resistance, while 5,100 is support.
3. The Q1 earnings season is under way and 179 companies from the S&P 500 index have released their quarterly results, with 63% beating estimates. Earnings are expected to be up 10% in Q1 and 9% in 2025.
4. Market sentiment is at the "Fear" level (36/100) as measured by CNN’s Fear & Greed indicator, while VIX is at a very high value of 24.
5. Earnings reports from Apple, Microsoft, Amazon and Meta, the latest PCE inflation data and the Non-Farm Payroll report are scheduled for next week.
My take:
We saw good follow-through from the bulls this week, and encouragingly, the growth segment is showing some leadership again. We'll need more confirmation, and next week's mega-cap earnings can help bring more clarity.
The price action has been constructive, and short-term momentum is gradually improving. However, I still watch the 5,500-50 resistance area that has capped our gain this week. Clearing that level would open the door for a retest of the 30-week EMA—my favorite long-term trend line and the real test ahead for the bulls.
Discipline and patience remain critical in this headline-driven market that can swing sharply in either direction within minutes. While we should celebrate this positive week, it's still too early to say we're entirely out of the woods.

PERFORMANCE RECAP
1. S&P 500 Sector Performance
This week, 10 out of the 11 S&P 500 sectors posted gains. Technology led the market with a 8.1% increase, while Consumer Defensive was the laggard, dropping 1.3%.
Year-to-date, 3 sectors have achieved positive performance. Utilities is the top-performing sector with a 3.3 % gain, while Consumer Cyclical lags behind, with a 11.9 % loss.

2. S&P 500 Top & Worst Performers
Over the last five trading days, 73% of the stocks in the S&P 500 index rose in value.
Top Performers:
$NOW (ServiceNow Inc): 22.4%
$MCHP (Microchip Technology, Inc): 21.6%
$PLTR (Palantir Technologies Inc): 20.3%
$TSLA (Tesla Inc): 18.1%
$APH (Amphenol Corp): 16.6%
Worst Performers:
$ENPH (Enphase Energy Inc): -10.9%
$LKQ (LKQ Corp): -11%
$TMUS (T-Mobile US Inc): -11.2%
$ERIE (Erie Indemnity Co): -12%
$NOC (Northrop Grumman Corp): -12.4%

In addition, 9 stock within the S&P 500 reached a new 52-week high, while 14 stocks set new lows. The majority of this week’s lows came from the Healthcare sector.
Notable Highs:
$NFLX (Netflix Inc)
$KO (Coca-Cola Co)
$PM (Philip Morris International Inc)
$KR (Kroger Co)
$TTWO (Take-Two Interactive Software, Inc)
Notable Lows:
$UNH (Unitedhealth Group Inc)
$PG (Procter & Gamble Co)
$PEP (PepsiCo Inc)
$CMCSA (Comcast Corp)
$PCAR (Paccar Inc)

MARKET MOMENTUM
1. Momentum Review
To evaluate the market's current health, I examine 4 key elements: performance, breadth, trends, and key levels. Healthy bull markets typically feature indices setting new highs, broad market participation, and ascending trend lines.
Performance (WEAK 🔴): evaluating recent market performance to gauge the momentum’s strength. Ideally i want to see returns accelerating short-term and index trading less than 5% from its 1-year high
1-month performance: -3.2% 🔴
3-month performance: -9.4% 🔴
vs. 1-year high: -10%🔴
Breadth (MIXED 🟡): assessing market participation to understand the health of the trend. Extreme levels (above 80% or below 20%) may indicate overextended trends.
% of stocks above 200-day moving average: 33% (up from 30% last week) 🔴
% of stocks above 20-day moving average: 68% (up from 27% last week) 🟢
Trends: analyzing trend strength across multiple timeframes using exponential moving averages, scored on a scale of 1 to 5. A score of 3 or above suggests solid trends and supports holding a position.
Weekly chart: WEAK ⭐️ (stable vs last week)

Daily chart: MIXED ⭐️⭐️ (improving vs last week)

4-hour chart: POSITIVE ⭐️⭐️⭐️ (improving vs last week)

Key levels: identifying critical price zones to confirm the current trend or signal a potential reversal.
Support:
$4,950 (-10.4%)
$5,100 (-7.7%)
$5,220 (-5.5%)
Resistance:
$5,550 (+0.4%)
$5,700 (+3.2%)
$5,775 (+4.5%)
2. Post of the Week
This week's momentum analysis is about the Consumer Defensive sector. Using a combination of performance metrics and technical indicators, I've developed a proprietary algorithm to rank 10 stocks from this sector. Based on this approach, I've identified Kroger ($KR) and Coca-Cola ($KO) as having the best relative momentum currently.
EARNINGS & ECONOMIC REPORTS RECAP
1. Earnings Outlook
Q1 Earnings: S&P 500 earnings are expected to grow by 10%, rising to 12% when excluding the energy sector.
2025 Full-Year Outlook: Earnings are expected to increase by 9%, in line with the 10-year average growth of 9%.
Analyst Revisions: Over the past month, 31% of all earnings revisions by analysts have been upward adjustments to their outlook.
Valuation: The forward 4-quarter P/E ratio stands at 20.1, above the 5-year and 10-year historical averages.
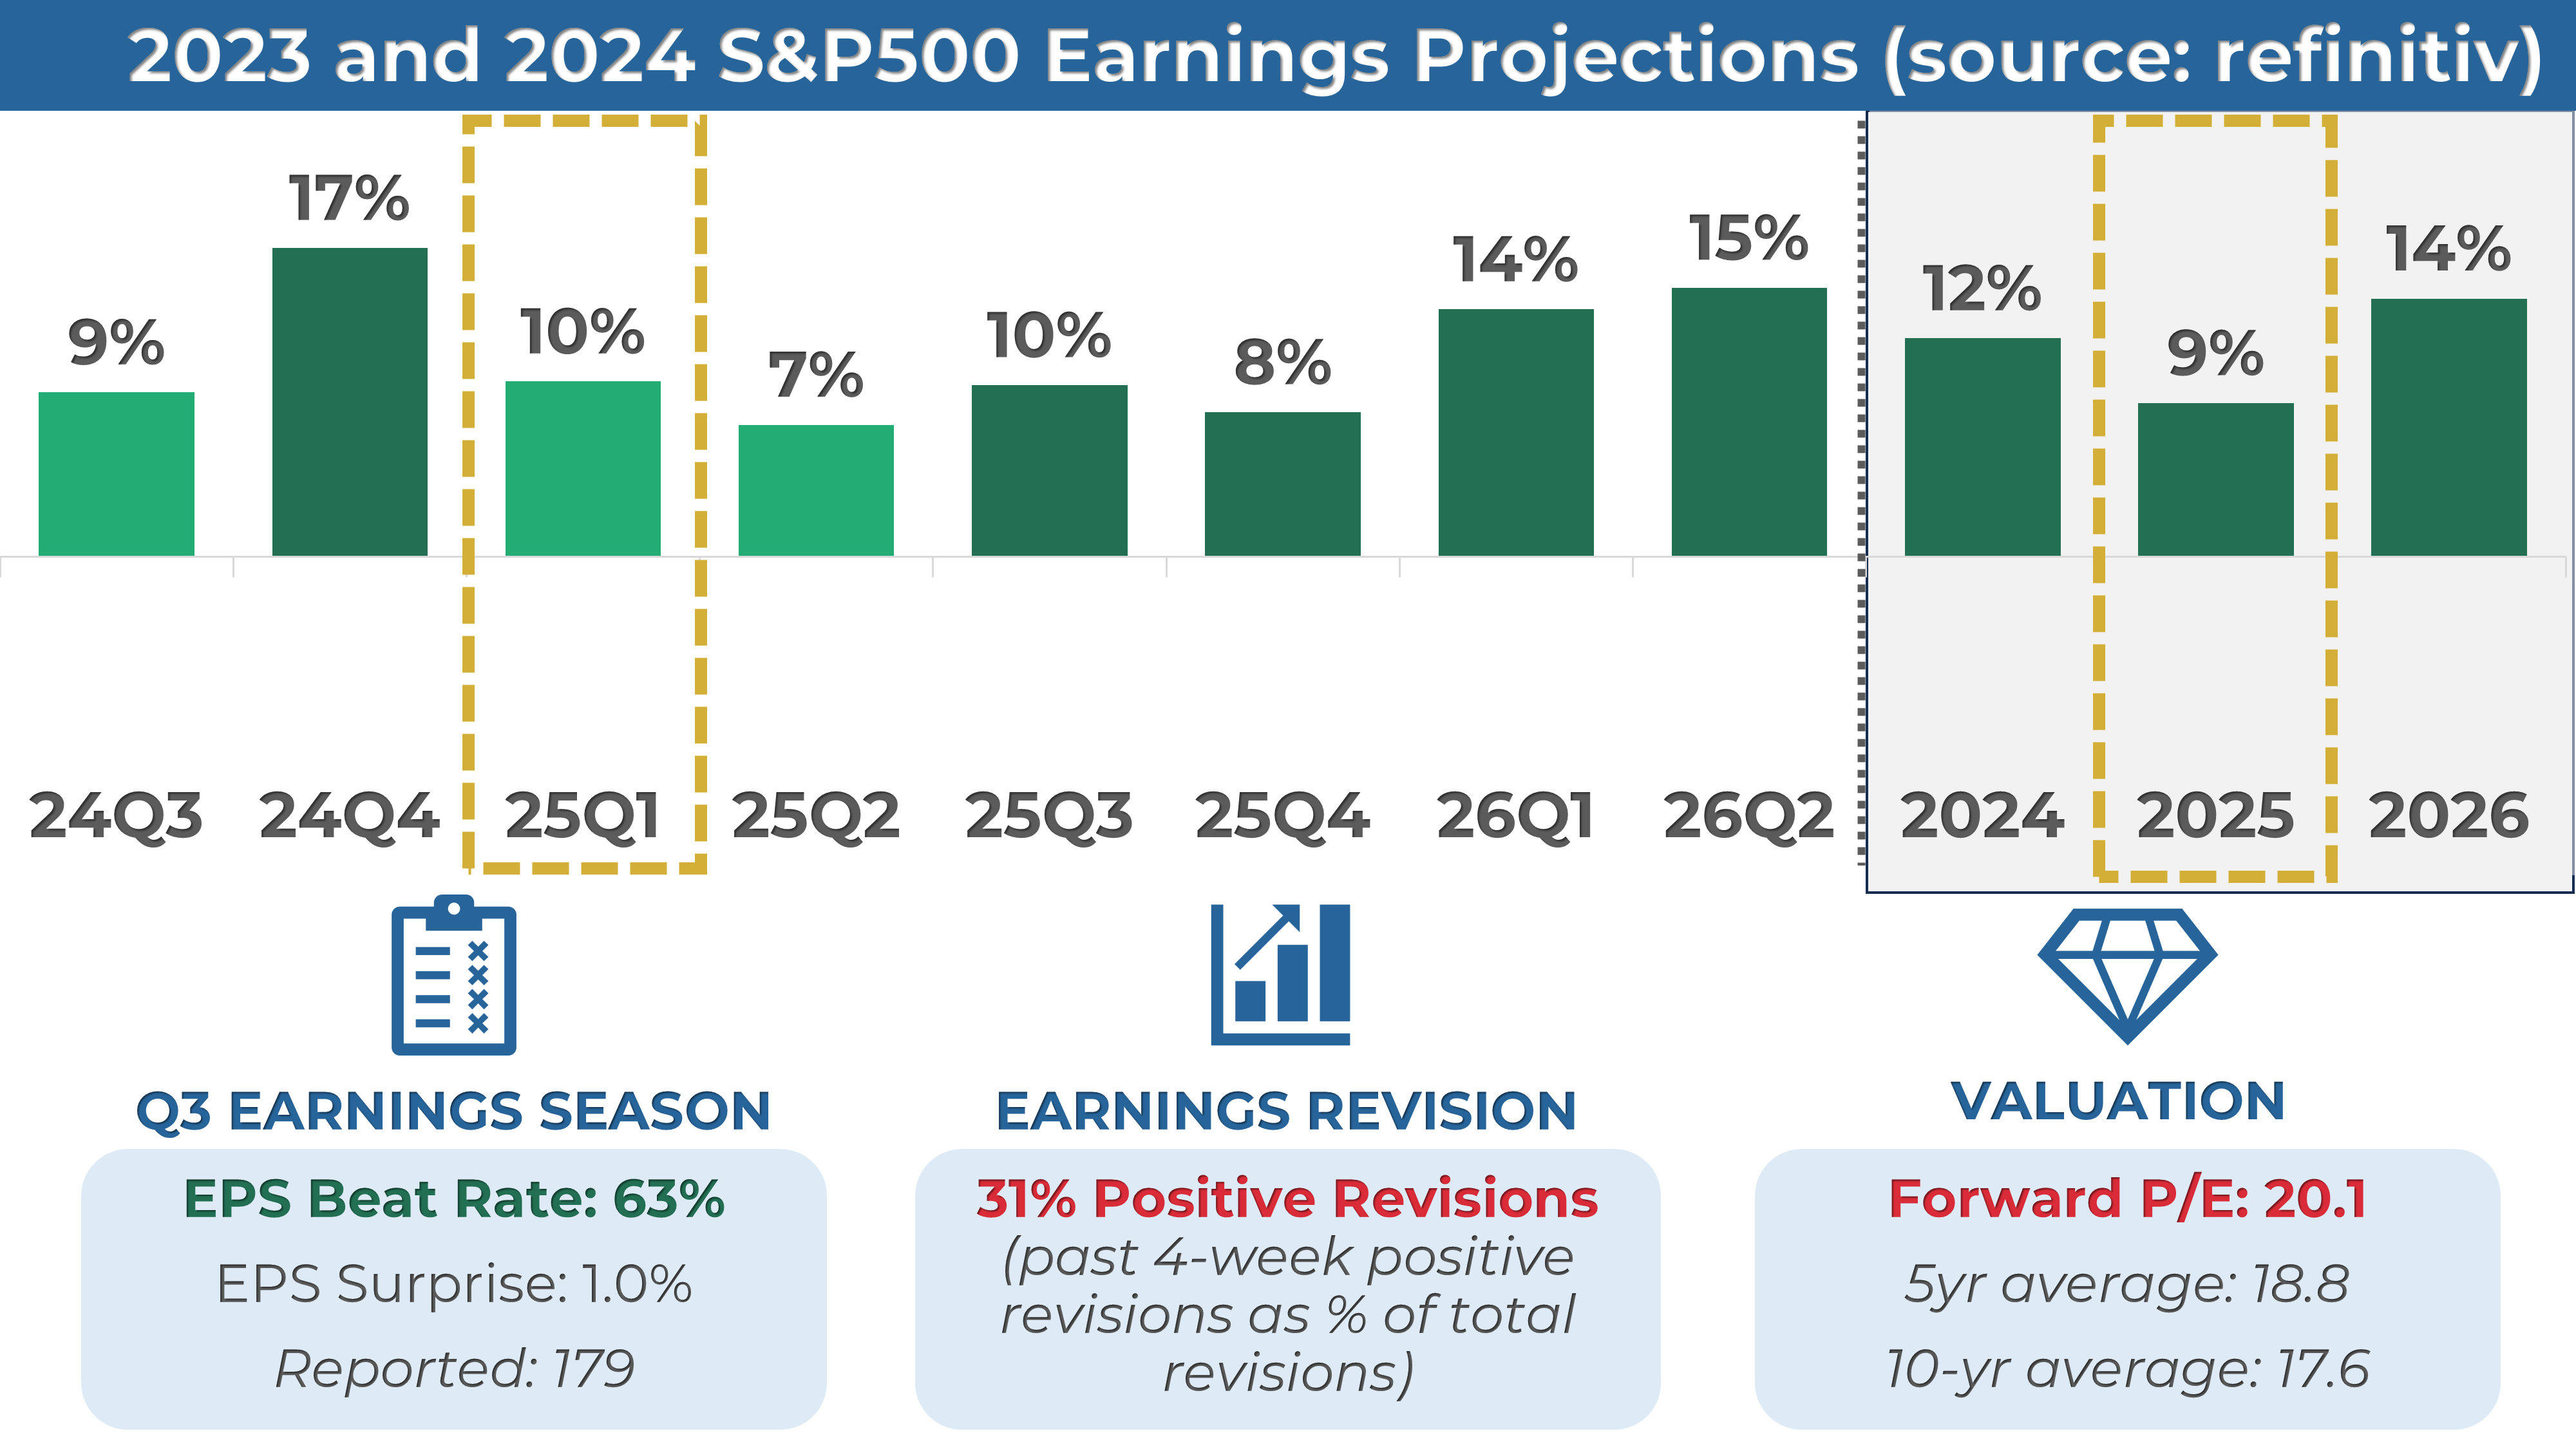
2. Earnings Season Recap
Out of 179 S&P 500 companies that have reported first-quarter earnings, 63% exceeded EPS expectations. It is below with the four-quarter average of 77% and the historical average of 67%.
Below are some notable companies that reported earnings last week. I’ve highlighted their EPS and revenue performance vs estimate, as well as their stock return this week.
One highlight of the week was Tesla that surged despite a double miss on revenues and EPS. The stock gained 18% for the week.

3. Economic Reports
April’s S&P Global Manufacturing PMI came in at 50.7, beating expectations (49.0) and indicating a return to expansion. Meanwhile, the Services PMI dropped to 51.4, missing forecasts (52.8) and down from the prior month’s 54.4.

MARKET SENTIMENT
Measures of investor sentiment can be helpful as they provide insight into the views and opinions of professional or individual investors. While not definitive predictors of market direction, these measures can serve as a valuable complement to other indicators and analysis tools, helping to paint a more comprehensive picture of the market's current state.
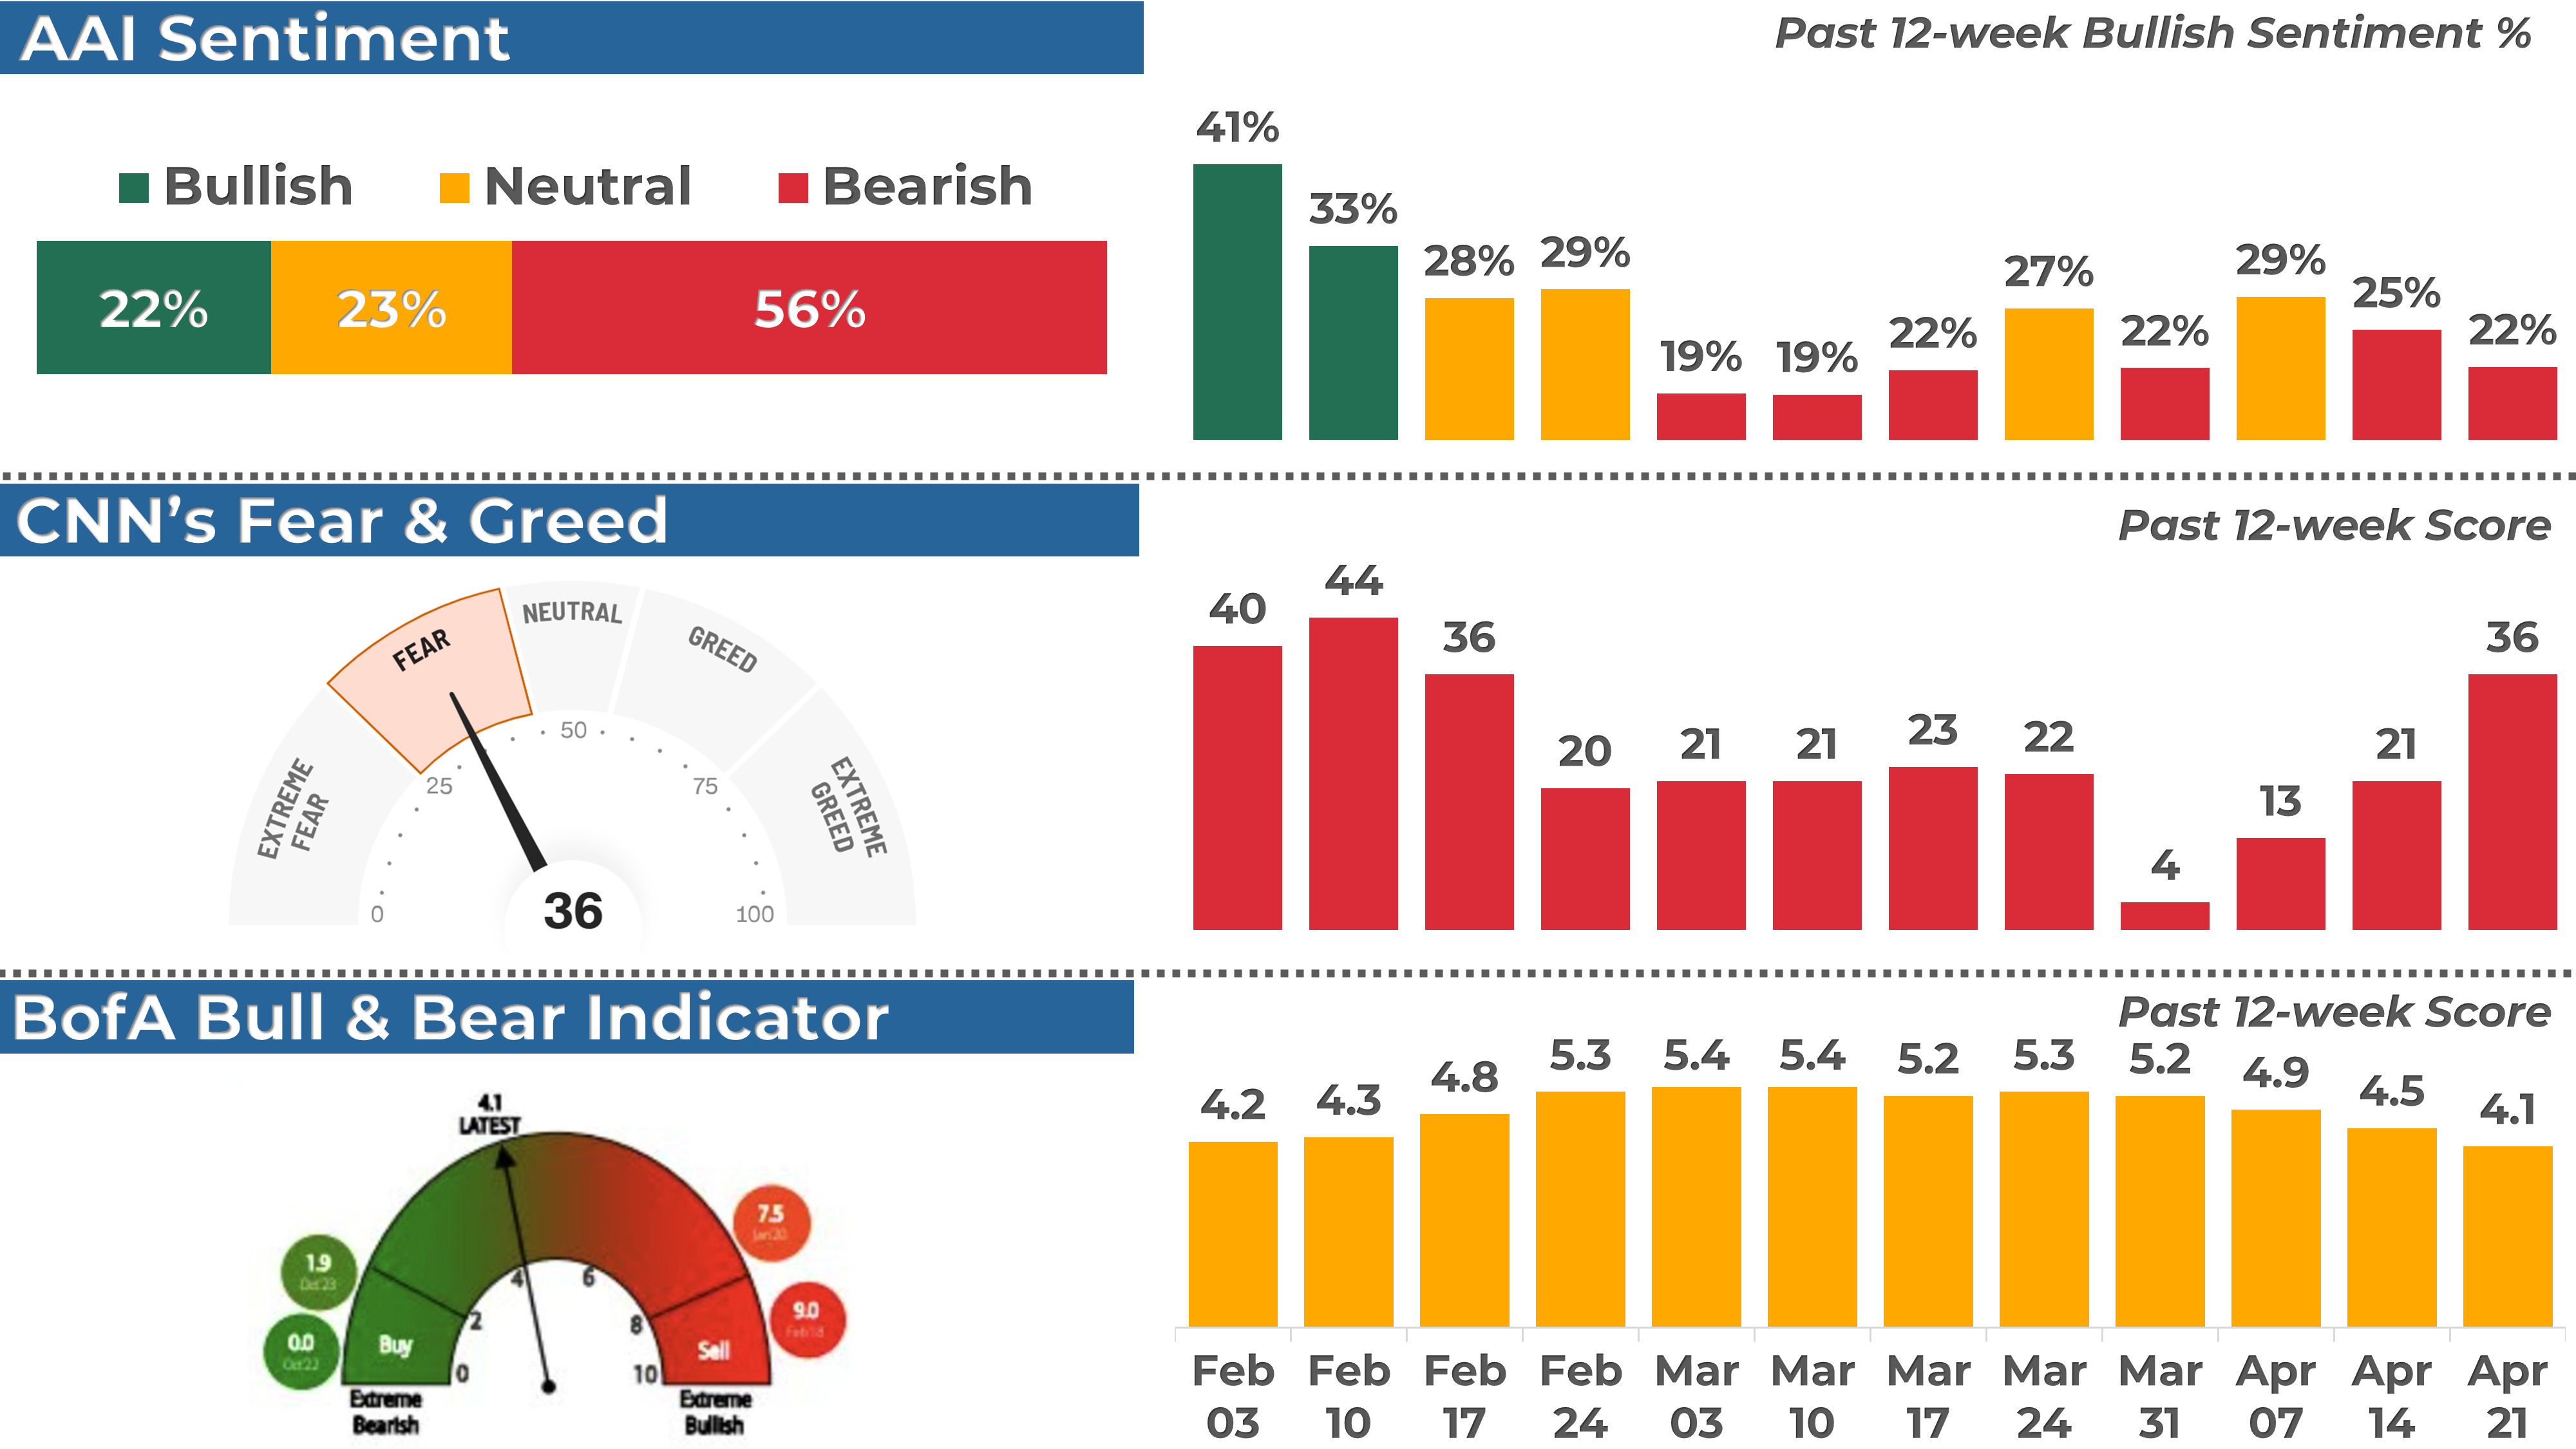
1. AAII Sentiment Survey (Individual Investors)
The American Association of Individual Investors (AAII) conducts a weekly survey to gauge members' expectations for the stock market over the next six months. Results are published every Wednesday.
In the latest survey, 22% of respondents had a bullish outlook, down from 25% the previous week.
2. BofA Bull & Bear Indicator (Institutional Investors)
The Bank of America Bull-Bear Indicator measures investor sentiment based on fund managers' and institutional investors' views. Scores range from 0 (extremely bearish) to 10 (extremely bullish).
The most recent reading was 4.5, a neutral sentiment.
3. CNN Fear & Greed Index (Technical)
This daily measure analyzes seven indicators to assess how emotions drive market decisions. Scores range from Extreme Fear to Extreme Greed.
The index closed at 36 (Fear), up from 21 last Friday.
THE WEEK AHEAD
1. Economic Calendar
It's shaping up to be a busy week for macro data, with several high-impact releases that could move markets:
Core PCE (Wednesday) – The Fed's preferred inflation gauge will be in focus. The previous month's YoY reading reached 2.8%, with MoM inflation cooling to 0.1%.
Non-Farm Payrolls (Friday) – April's jobs report is the week's big-ticket event. After a very strong March (+228K), the forecast for April is a slowdown to 130K, with unemployment expected to hold at 4.2%.
Other notable data points:
Consumer Confidence (Tuesday)
GDP Q1 Estimate (Wednesday)
Chicago PMI, ADP Jobs, and ISM Manufacturing PMI (midweek)
Initial Jobless Claims (Thursday)

2. Earnings Calendar
The earnings season continues next week, and 180 companies from the S&P 500, including Apple, Microsoft, Amazon and Meta, are expected to release their quarterly results.

Below are notable stocks reporting earnings next week, along with several key indicators I like to monitor:
Stock Indicators:
3-Month Performance: Assessing recent stock trends.
RSI (Relative Strength Index): A reading above 70 suggests overbought conditions, while below 30 indicates oversold.
P/E Ratio: A value below 25 often points to a "cheap" valuation or low growth expectations.
Stock Price Reactions to Earnings:
1-Day Stock Return on Earnings: How the stock performs on its earnings release day.
Implied Volatility: The options market's forecast for the expected 1-day stock move after earnings.
One report I’ll look closely at is Amazon. It has lagged behind the other tech names, and a positive report could lead to a catch-up.

3. Stock Analysis of the Week
Every week, I share my analysis of 1 stock that has reported earnings in recent weeks, focusing on implications for long-term investors. This week, I prepared an analysis of Netflix ($NFLX).
👨💻 My View: HOLD
Netflix ($NFLX) is emerging as one of the strongest tech names. It held up nicely during the recent turmoil and is now breaking out to fresh all-time highs. That's what strong leadership looks like.
With a bullish MACD crossover and a push into price discovery mode, this move could have more upside—especially if the broader market recovery gains traction.
Netflix is my best-performing long-term holding right now; to me, it's a clear "hold".
Check out the post for more details about $NFLX performance, trend and key levels.
CONCLUSION
Thank you for reading my Weekly Market Recap, which, I hope, got you ready for the week ahead.
If you want to take your investing journey to the next level, consider upgrading to a paid subscription. Subscribe now and learn more about my holistic, end-to-end momentum approach to investing.
Your first month is free, so this is the perfect opportunity to explore the full value of My Weekly Stock with no commitment!
Thanks again, and I look forward to sharing my market recap with you next week.
Happy investing!
My Weekly Stock
DISCLAIMER
The information provided in this newsletter is for informational purposes only and should not be taken as financial advice. Any investments or decisions made based on the information provided in this newsletter are the reader's sole responsibility. We recommend that readers conduct their own research and consult a qualified financial professional before making investment decisions. The author does not assume any responsibility for any losses or damages arising from using the information provided in this newsletter.