


Weekly Market Recap (Apr 7-11): Markets Bounce Back Hard – V-Shaped Recovery or Just a Bear Market Rally?
Everything you need to know about last week's markets performance and what to expect next.
Dear readers,
Welcome back to My Weekly Stock, where in-depth market analysis meets proven momentum-based trading strategies. My mission? To help you win in the markets with unbiased, data-driven insights you can act on.
Friday means it's time to review the week in the markets. Each week, I dedicate hours to curating this market recap, preparing insightful analysis with clear visuals and a structured layout—making it easy for you to find exactly what you need, week after week. And because it's easy to get swayed by personal bias, I like to let the data do most of the talking.
If you want the full experience, consider upgrading your subscription. Paid members get access to all my portfolios, real-time trade alerts, in-depth analysis, and a clear momentum-based framework you can follow and learn from.
Start today. Your first month is completely FREE—no commitment, no pressure. Just a chance to explore the full value of My Weekly Stock.
Let's dive in!
SUMMARY
Here are this week's highlights and what to look out for next:
1. The markets were positive this week, with the S&P 500 up 5.7%, the Nasdaq 7.3%, and the Dow Jones 5%. Technology (+8.8%) and Industrials (+6.6%) were the best-performing sectors.
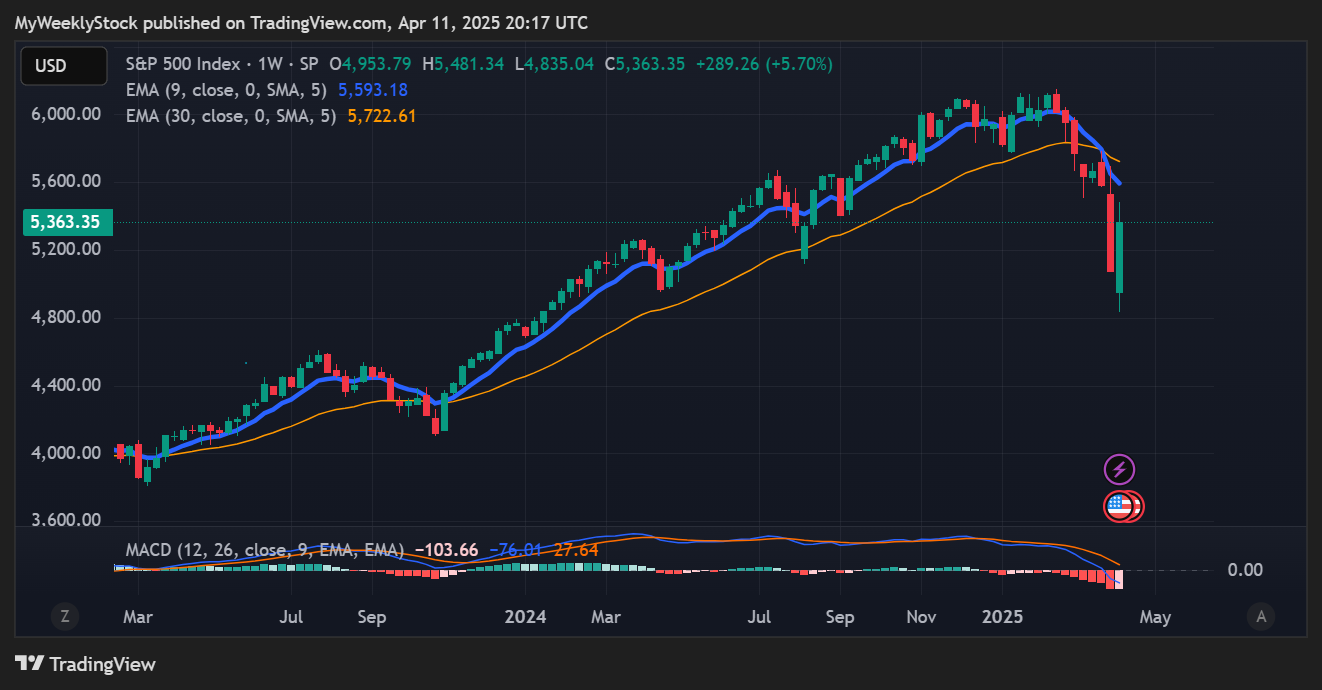
2. The S&P 500's long-term trend is negative, and the short-term momentum is mixed. 5,500 is the next resistance, while 4,950 is support.
3. The Q1 earnings season has started and 29 companies from the S&P 500 index have released their quarterly results, with 66% beating estimates. Earnings are expected to be up 8% in Q1 and 10% in 2025.
4. Market sentiment is at the "Extreme Fear" level (13/100) as measured by CNN’s Fear & Greed indicator, while VIX is at an extremely high value of 38.
5. Earnings reports from UnitedHealth and Netflix, and the latest Retail Sales data are scheduled for next week.
My take:
Wild week on Wall Street as the indices started on the wrong foot, but Trump’s 90-day tariff pause sparked a rally for the history books—sending the S&P 500 to one of its top three daily gains since World War II. While volatility remained high the rest of the week, it was enough to break the market’s losing streak.
But are we in the clear? It’s still too early to say—especially when one man can swing the market 10% in a matter of hours. I remain cautious, particularly because the weakness in price action arguably started even before last week’s shocking tariff announcement. The big question now: Was this week’s low the bottom, and are we setting up for a V-shaped recovery? That’s possible—but bear markets are known for sharp counter-rallies. What matters now is follow-through. And while this week’s action was encouraging, confidence will take time to rebuild after the damage we’ve seen.

PERFORMANCE RECAP
1. S&P 500 Sector Performance
This week, 10 out of the 11 S&P 500 sectors posted gains. Technology led the market with a 8.8% increase, while Real Estate was the laggard, dropping 0.1%.
Year-to-date, 2 sectors have achieved positive performance. Consumer Defensive is the top-performing sector with a 2.2 % gain, while Consumer Cyclical lags behind, with a 15.4 % loss.

2. S&P 500 Top & Worst Performers
Over the last five trading days, 75% of the stocks in the S&P 500 index rose in value.
Top Performers:
$NEM (Newmont Corp): 24.4%
$AVGO (Broadcom Inc): 24.4%
$CEG (Constellation Energy Corporation): 21.8%
$PLTR (Palantir Technologies Inc): 19.7%
$GEV (GE Vernova Inc): 18.4%
Worst Performers:
$LW (Lamb Weston Holdings Inc): -7.2%
$BMY (Bristol-Myers Squibb Co): -8.3%
$ENPH (Enphase Energy Inc): -9.4%
$APTV (Aptiv PLC): -9.6%
$KMX (Carmax Inc): -9.7%

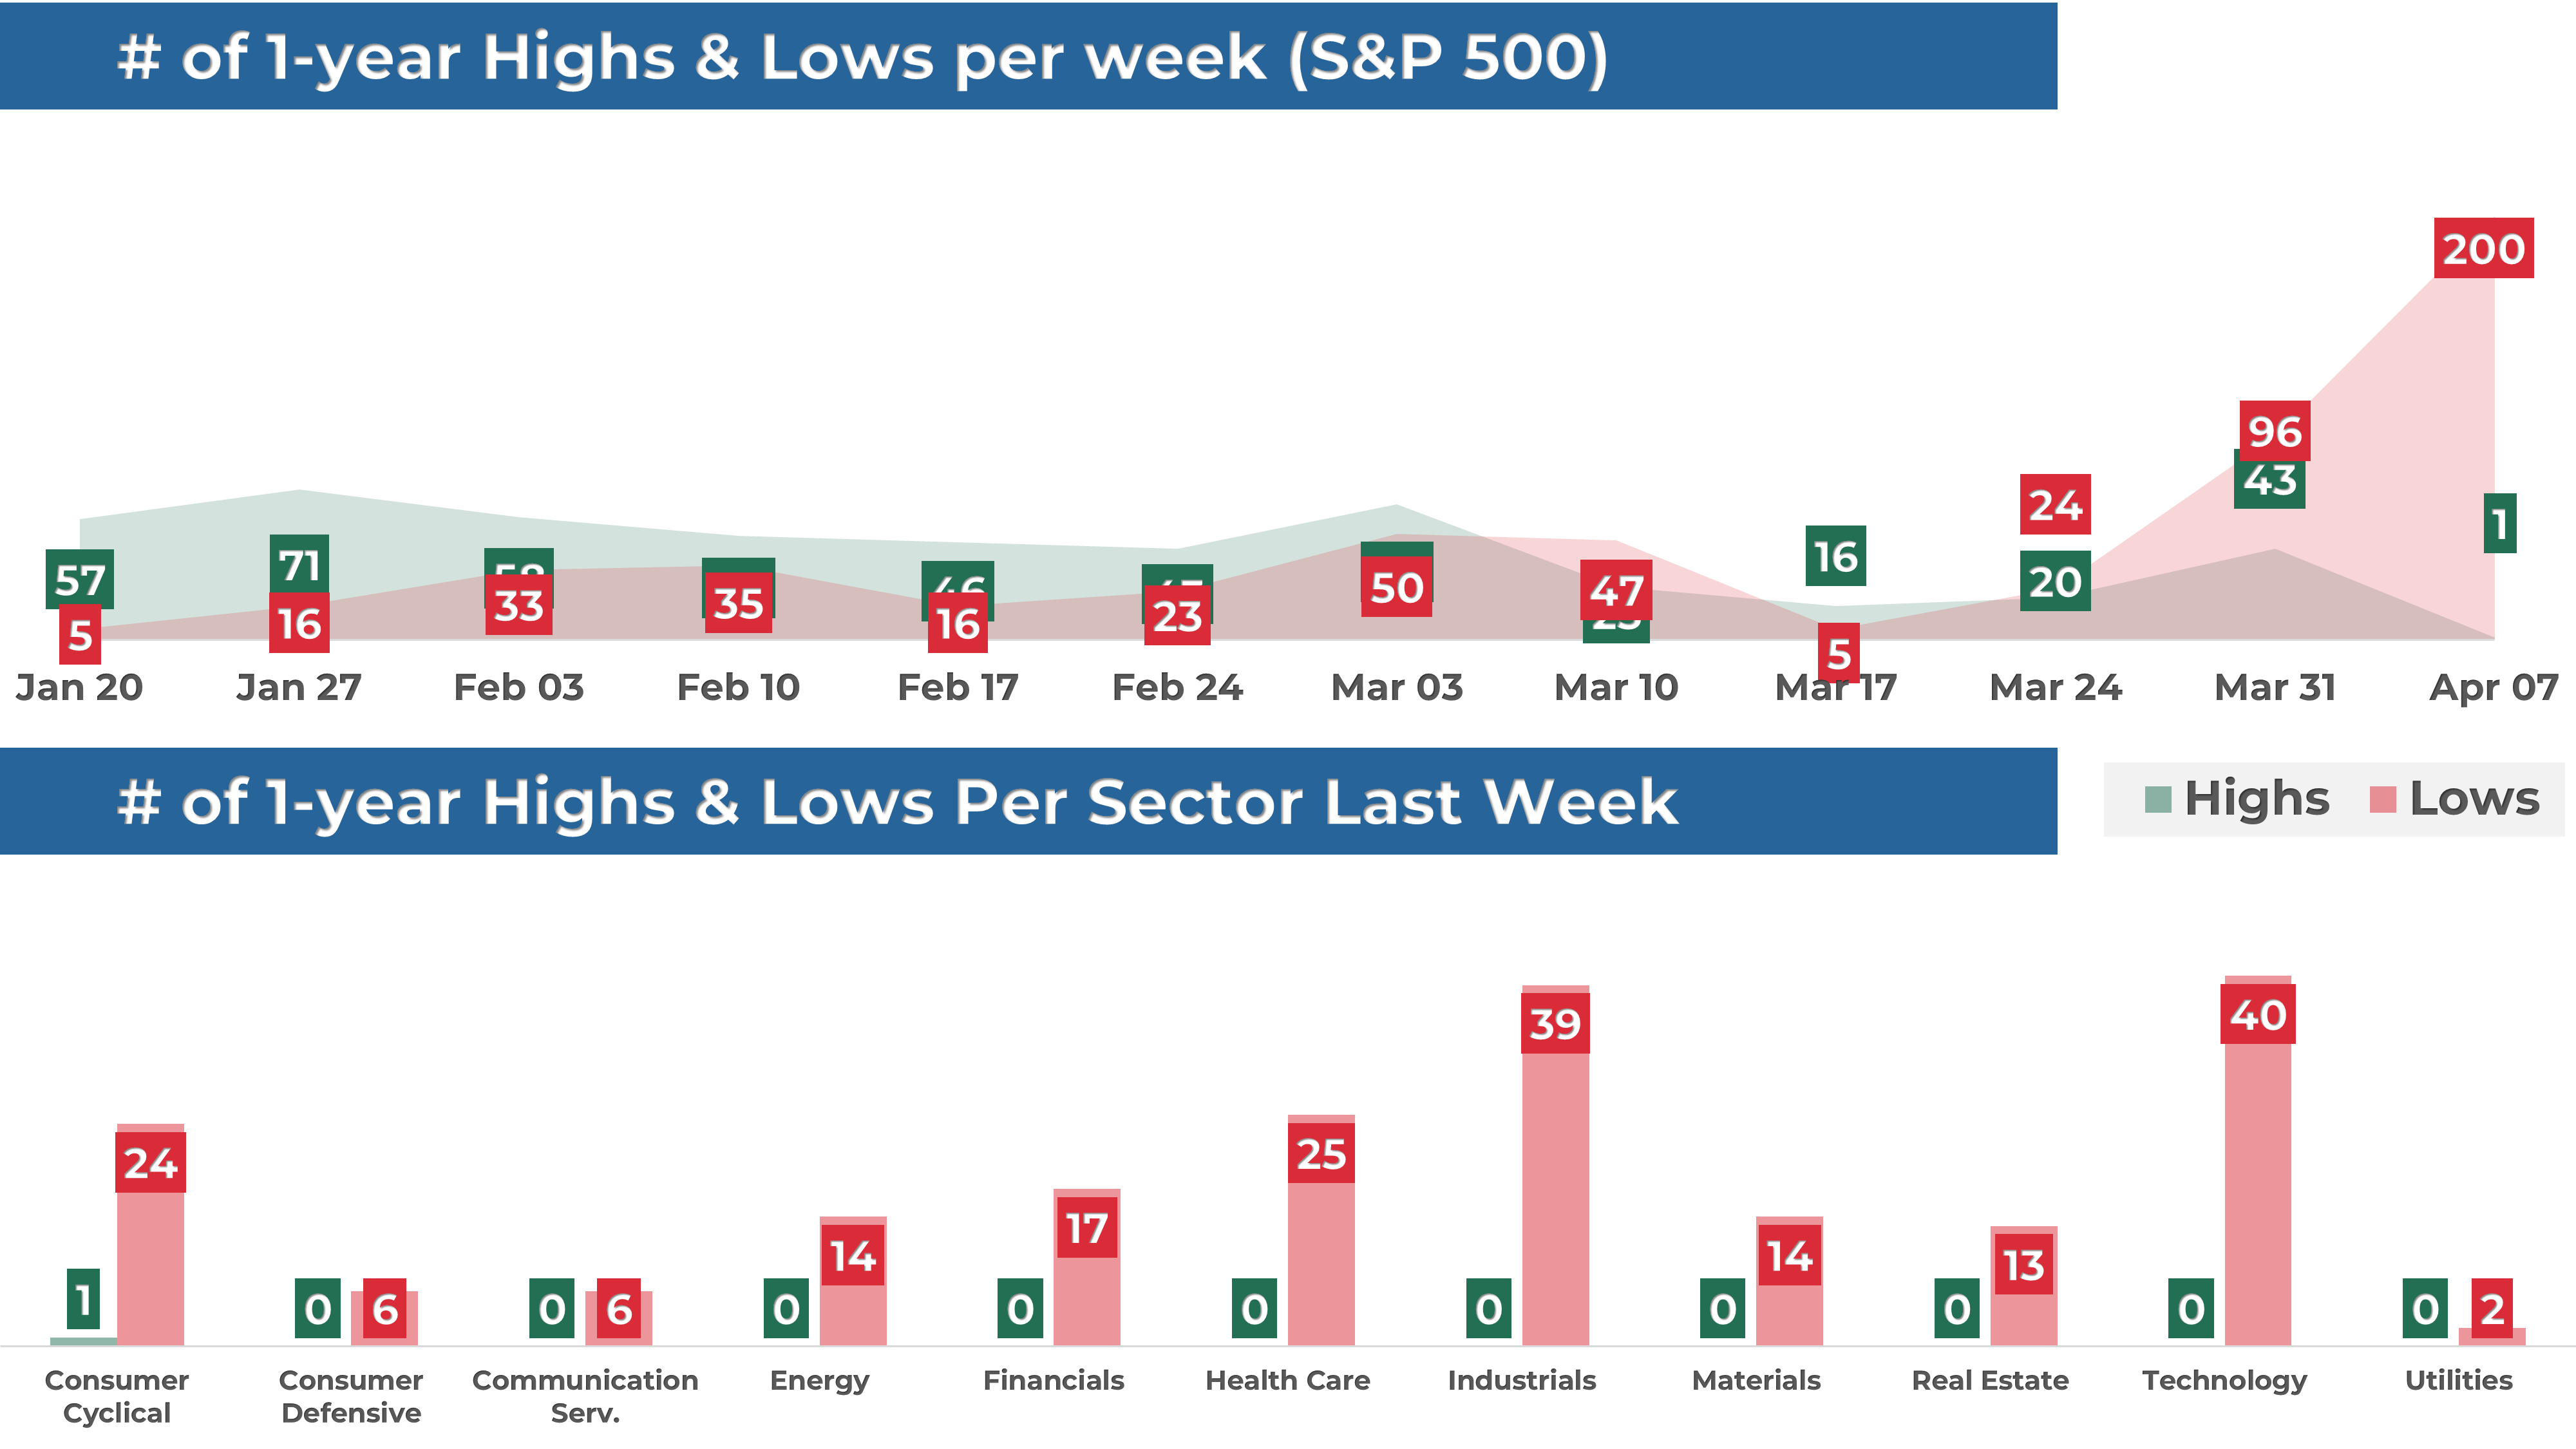
In addition, 1 stock within the S&P 500 reached a new 52-week high, while 200 stocks set new lows. The majority of this week’s lows came from the Technology sector.
Notable Highs:
$TJX (TJX Companies, Inc)
Notable Lows:
$MSFT (Microsoft Corporation)
$GOOG (Alphabet Inc)
$LLY (Lilly(Eli) & Co)
$XOM (Exxon Mobil Corp)
$BAC (Bank Of America Corp)
MARKET MOMENTUM
1. Momentum Review
To evaluate the market's current health, I examine 4 key elements: performance, breadth, trends, and key levels. Healthy bull markets typically feature indices setting new highs, broad market participation, and ascending trend lines.
Performance (WEAK 🔴): evaluating recent market performance to gauge the momentum’s strength. Ideally i want to see returns accelerating short-term and index trading less than 5% from its 1-year high
1-month performance: -3.2% 🔴
3-month performance: -8.0% 🔴
vs. 1-year high: -12.9%🔴
Breadth (WEAK 🔴): assessing market participation to understand the health of the trend. Extreme levels (above 80% or below 20%) may indicate overextended trends.
% of stocks above 200-day moving average: 28% (up from 21% last week) 🔴
% of stocks above 20-day moving average: 20% (up from 6% last week) 🔴
Trends: analyzing trend strength across multiple timeframes using exponential moving averages, scored on a scale of 1 to 5. A score of 3 or above suggests solid trends and supports holding a position.
Weekly chart: WEAK ⭐️ (stable vs last week)
Daily chart: WEAK ⭐️ (improving vs last week)

4-hour chart: MIXED ⭐️⭐️ (improving vs last week)

Key levels: identifying critical price zones to confirm the current trend or signal a potential reversal.
Support:
$4,800 (-10.5%)
$4,950 (-7.7%)
$5,220 (-2.7%)
Resistance:
$5,500 (+2.6%)
$5,775 (+7.7%)
$6,000 (+11.9%)
Enjoying the analysis so far? There’s so much more in the paid version, where I cover 70+ stocks and ETFs every month. Subscribe now to learn how I connect strategy to insights and, ultimately, portfolio decisions.
2. Post of the Week
This week's momentum analysis is about the Health Care industry. Using a combination of performance metrics and technical indicators, I've developed a proprietary algorithm to rank 9 stocks from this industry. Based on this approach, I've identified Abbott ($ABT) and Johnson & Johnson ($JNJ) as having the best relative momentum currently.
EARNINGS & ECONOMIC REPORTS RECAP
1. Earnings Outlook
Q1 Earnings: S&P 500 earnings are expected to grow by 8%, rising to 10% when excluding the energy sector.
2025 Full-Year Outlook: Earnings are expected to increase by 10%, above the 10-year average growth of 9%.
Analyst Revisions: Over the past month, 31% of all earnings revisions by analysts have been upward adjustments to their outlook.
Valuation: The forward 4-quarter P/E ratio stands at 19.0, mostly in line with the 5-year and 10-year historical averages.

2. Earnings Season Recap
Out of 29 S&P 500 companies that have reported first-quarter earnings, 66% exceeded EPS expectations. It is below with the four-quarter average of 78% and in line the historical average of 67%.
Below are some notable companies that reported earnings last week. I’ve highlighted their EPS and revenue performance vs estimate, as well as their stock return this week.
One highlight of the week was JP Morgan, which topped Revenues and EPS estimates, and rallied 12% for the week.

3. Economic Reports
This week’s main reports were consumer and producer inflation, both of which came in lower than forecasts and the previous month—a reading that was welcomed by the markets.

MARKET SENTIMENT
Measures of investor sentiment can be helpful as they provide insight into the views and opinions of professional or individual investors. While not definitive predictors of market direction, these measures can serve as a valuable complement to other indicators and analysis tools, helping to paint a more comprehensive picture of the market's current state.

1. AAII Sentiment Survey (Individual Investors)
The American Association of Individual Investors (AAII) conducts a weekly survey to gauge members' expectations for the stock market over the next six months. Results are published every Wednesday.
In the latest survey, 29% of respondents had a bullish outlook, up from 22% the previous week.
2. BofA Bull & Bear Indicator (Institutional Investors)
The Bank of America Bull-Bear Indicator measures investor sentiment based on fund managers' and institutional investors' views. Scores range from 0 (extremely bearish) to 10 (extremely bullish).
The most recent reading was 4.9, a neutral sentiment.
3. CNN Fear & Greed Index (Technical)
This daily measure analyzes seven indicators to assess how emotions drive market decisions. Scores range from Extreme Fear to Extreme Greed.
The index closed at 13 (Extreme Fear), up from 4 last Friday.
THE WEEK AHEAD
1. Economic Calendar
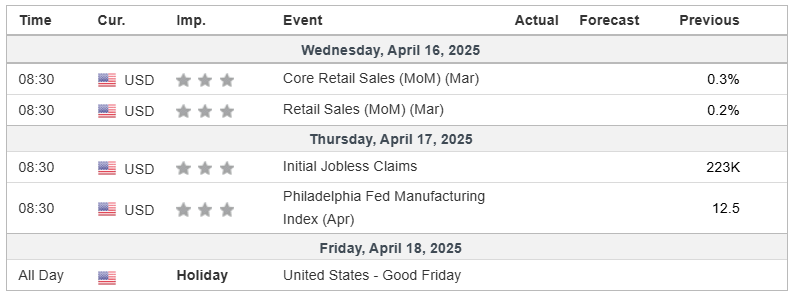
Next week will be a short trading week as markets will be closed on Friday for the Easter holiday. The main economic report will be the Retail Sales data, expected on Wednesday. As concerns about a potential economic slowdown are mounting, the market will likely be closely watching the latest reading on consumer spending.
2. Earnings Calendar
Earnings season starts next week, and 31 companies from the S&P 500, including UnitedHealth and Netflix, are expected to release their quarterly results.

Below are notable stocks reporting earnings next week, along with several key indicators I like to monitor:
Stock Indicators:
3-Month Performance: Assessing recent stock trends.
RSI (Relative Strength Index): A reading above 70 suggests overbought conditions, while below 30 indicates oversold.
P/E Ratio: A value below 25 often points to a "cheap" valuation or low growth expectations.
Stock Price Reactions to Earnings:
1-Day Stock Return on Earnings: How the stock performs on its earnings release day.
Implied Volatility: The options market's forecast for the expected 1-day stock move after earnings.

3. Stock Analysis of the Week
Every week, I share my analysis of 1 stock that has reported earnings in recent weeks, focusing on implications for long-term investors. This week, I prepared an analysis of Delta Air Lines ($DAL).
👨💻 My View: PASS
Delta has been under pressure for weeks, with a steep decline pushing the stock 44% below its 1-year high. After eight weeks of free fall, we finally saw a bit of a reaction, with a decent bounce off the $35 area—right at the August 2024 low.
It’s too early to call a bottom, especially as we remain well below the 30-week EMA. Still, a couple more constructive weeks could help rebuild the setup for a longer-term recovery.
Check out the post for more details about $DAL performance, trend and key levels.
CONCLUSION
Thank you for reading my Weekly Market Recap, which, I hope, got you ready for the week ahead.
If you want to take your investing journey to the next level, consider upgrading to a paid subscription. Subscribe now and learn more about my holistic, end-to-end momentum approach to investing.
Your first month is free, so this is the perfect opportunity to explore the full value of My Weekly Stock with no commitment!
Thanks again, and I look forward to sharing my market recap with you next week.
Happy investing!
My Weekly Stock
DISCLAIMER
The information provided in this newsletter is for informational purposes only and should not be taken as financial advice. Any investments or decisions made based on the information provided in this newsletter are the reader's sole responsibility. We recommend that readers conduct their own research and consult a qualified financial professional before making investment decisions. The author does not assume any responsibility for any losses or damages arising from using the information provided in this newsletter.