


Weekly Market Recap (Aug 12-16): Bulls on a Roll: Time to Catch Our Breath or Keep Pushing?
Everything you need to know about last week's markets performance and what to expect next.
Dear subscribers,
Welcome to My Weekly Stock, where we blend in-depth market analysis with proven momentum-based trading strategies. My mission? Help you navigate the financial markets with unbiased, data-driven insights you can act on!
Every week, I spend hours curating this market recap, producing insightful analyses with clear visuals and a structured layout so you can easily find what you need, week after week. And because it's easy to get swayed by personal bias, I like to let the data do most of the talking.
Remember to upgrade your subscription to access all my trading and investing portfolios, and see how I protect my gains in these turbulent times!
Let’s get started!
SUMMARY
Here are this week's highlights and what to look out for next:
1. The markets were positive this week, with the S&P 500 up 3.9%, the Nasdaq 5.3%, and the Dow Jones 2.9%. Technology (+7.7%) and Consumer Cyclical (+5%) were the best-performing sectors.
2. The S&P 500's long-term trend is positive, and the short-term momentum has also turned positve. 5,575 is the next resistance, while 5,500 is support.
3. The earnings season is well under way and 463 companies from the S&P 500 index have released their Q2 results, with 79% beating estimates. Earnings are expected to be up 13% in Q2 2024 and 10% in 2024.
4. Market sentiment is at the "Fear" level (35) as measured by CNN’s Fear & Greed indicator, while VIX is at a low value of 15.
5. Earnings reports from Intuit and Lowe’s, as well as the FOMC meeting minutes are scheduled for next week.
My take:
A nearly perfect week for the bulls just unfolded, driven by two inflation reports that came in below or in line with expectations. Coming into the week, I was looking for more follow-through, which started with the S&P 500 moving above the 3,380-3,400 area and reclaiming its 21-day EMA. Both of these happened during the week, and the astounding retreat in the VIX, now down to 15, is also a positive sign for the markets.
After an almost vertical move, with the market up 8 out of the last 9 days and bouncing 8% from its Aug 5th lows, some consolidation could be warranted. However, as long as we don’t lose a significant support level or a short-term trendline, momentum will likely remain on the upside, and the index could revisit its previous highs.

PERFORMANCE RECAP
1. S&P 500 Sector Performance
Over the week, all the 11 S&P 500 sectors have achieved gains. Technology led the way, rising by 7.7%. By contrast, Real Estate was the weakest, still gaining 0.1%.
Year-to-date, all the sectors have seen positive results. Communication Services has been the most successful sector, with a 19% gain. On the other hand, Consumer Cyclical has been trailing behind.

2. S&P 500 Top & Worst Performers
In the last 5 trading days, 85% of the stocks in the S&P 500 index rose in value.
The best-performing stocks were:
Starbucks Corp. (SBUX, 26%)
Super Micro Computer Inc (SMCI, 24%)
NVIDIA Corp (NVDA, 19%)
Meanwhile, the worst-performing stocks were:
Charter Communications Inc. (CHTR, -3%)
Hershey Company (HSY, -4%)
Chipotle Mexican Grill (CMG, -6%)
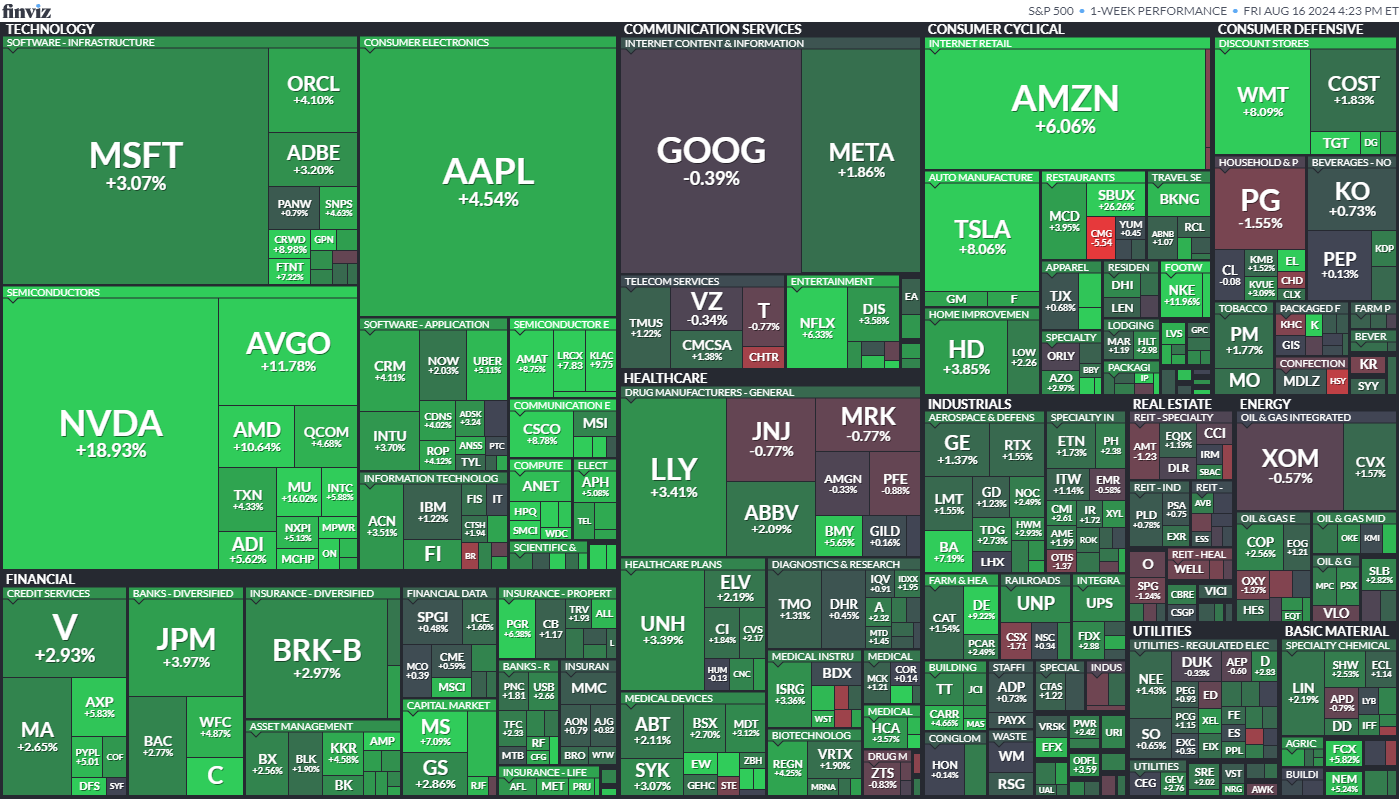
In addition, 41 stocks within the S&P 500 reached a new 52-week high, while 10 set new lows. Most of the highs this week came from the Healthcare sector.

MARKET TRENDS & MOMENTUM
1. S&P 500 Long-Term Trend
The long-term trend for the S&P 500 is positive. I base this evaluation on the 9 and 30-week exponential moving averages (EMAs). To determine if the trend is strongly positive, I look for the following conditions (the 1st is the most important):
9-week EMA is above the 30-week EMA: 🟢
Price is trading above the 9-week EMA: 🟢
Price is trading above the 30-week EMA: 🟢
The 9-week EMA trend line is rising: 🟡
The 30-week EMA trend line is rising: 🟢
I also use the MACD as an additional tool to detect trend changes. The MACD is below its signal line, a negative indication for the index.

2. S&P 500 Technical Analysis
Healthy bull markets typically see the index set several new highs, broad market participation, and ascending trend lines. That's why I've created a four-part scorecard – a straightforward tool to give us a comprehensive view of these essential health indicators.
Momentum: The index is flat over the past month, up 5% in the last three months, and is trading 2% away from its 52-week high.
Breadth: Market participation remains healthy in the long term, as 72% of S&P 500 stocks are trading above their 200-day moving average (SMA). Meanwhile, 75% of the stocks are trading above their 20-day SMA, up from 47% the previous week. A reading above 80% or below 20% typically indicates an overextended trend.
Trends: The trend on the 1-day chart is flipping positive, with the index reclaiming its 21-period exponential moving average this week.
Key levels: The next resistance level is 5,575. On the other hand, the next support areas are at 5,500, followed by 5,380.

3. Momentum Analysis of the Week
This week's momentum analysis focuses on extended trends in the S&P 500, employing the Relative Strength Index (RSI) to filter stocks. The RSI is a valuable tool for spotting stocks that are potentially "oversold" (RSI below 30) or "overbought" (RSI above 70). Although I wouldn't rely solely on RSI, it helps identify stocks in extended trends that may be approaching a turning point.

EARNINGS RECAP
1. Q2 and Full Year 2024 Expected EPS & Revenue Growth
Q2 2024 earnings for the S&P 500 are expected to be up 12.5%. Excluding the energy sector, the figure is +13%.
Earnings are projected to grow by 10% in 2024, higher than the 9% growth seen on average over the last decade. In the past four weeks, 56% of earnings revisions made by analysts were to increase their outlook.
The forward 4-quarter P/E ratio is 21.5, higher than the average over the past five and ten years.

2. Q2 Earnings Season Summary
463 companies from the S&P 500 index have released their Q2 2024 earnings, with 79% posting higher EPS than expectations. This is in line with the previous four-quarter average of 79% and higher than the historical average of 67%.
MARKET SENTIMENT
Measures of investor sentiment can be helpful as they provide insight into the views and opinions of professional or individual investors. However, it's important to note that these measures are not perfect predictors of market movements. They should be combined with other indicators and analysis tools for a complete market picture.

1. AAII Sentiment Survey (Individual Investors)
The American Association of Individual Investors (AAII) conducts a weekly survey among its members to gauge their expectations for the stock market over the next six months. The results are published every Wednesday.
According to the most recent AAII survey, 43% of the respondents had a bullish outlook on the stock market, increasing by 2 points from the previous week.
2. BofA Bull & Bear Indicator (Institutional Investors)
The Bank of America Bull-Bear Indicator is a proprietary measure of investor sentiment developed by Bank of America. It is based on a survey of fund managers and institutional investors, and it tracks the percentage of respondents who are bullish, bearish, or neutral on the stock market. Results are published in the form of a score ranging from 0 (extremely bearish) to 10 (extremely bullish)
The indicator increased from 6.3 to 6.6, a slightly bullish sentiment reading.
3. CNN Fear & Greed Index (Technical)
The CNN Fear & Greed Index is a daily measure that analyzes seven market indicators to assess how emotions influence investors' decisions. The index is scored out of 100 and categorizes results into five stages: Extreme Fear, Fear, Neutral, Greed, and Extreme Greed.
The index closed at 35 or a “Fear” level, up from 24 last Friday.
THE WEEK AHEAD
1. Economic Calendar
The highlight for the upcoming week will be the FOMC meeting minutes. The document, expected on Wednesday, will shed more light on the Federal Reserve's latest discussions and the potential for rate cuts at its next meeting.

2. Earnings Calendar
Earnings season continues next week, and 16 companies from the S&P 500, including Intuit and Lowe’s, are expected to release their quarterly results.
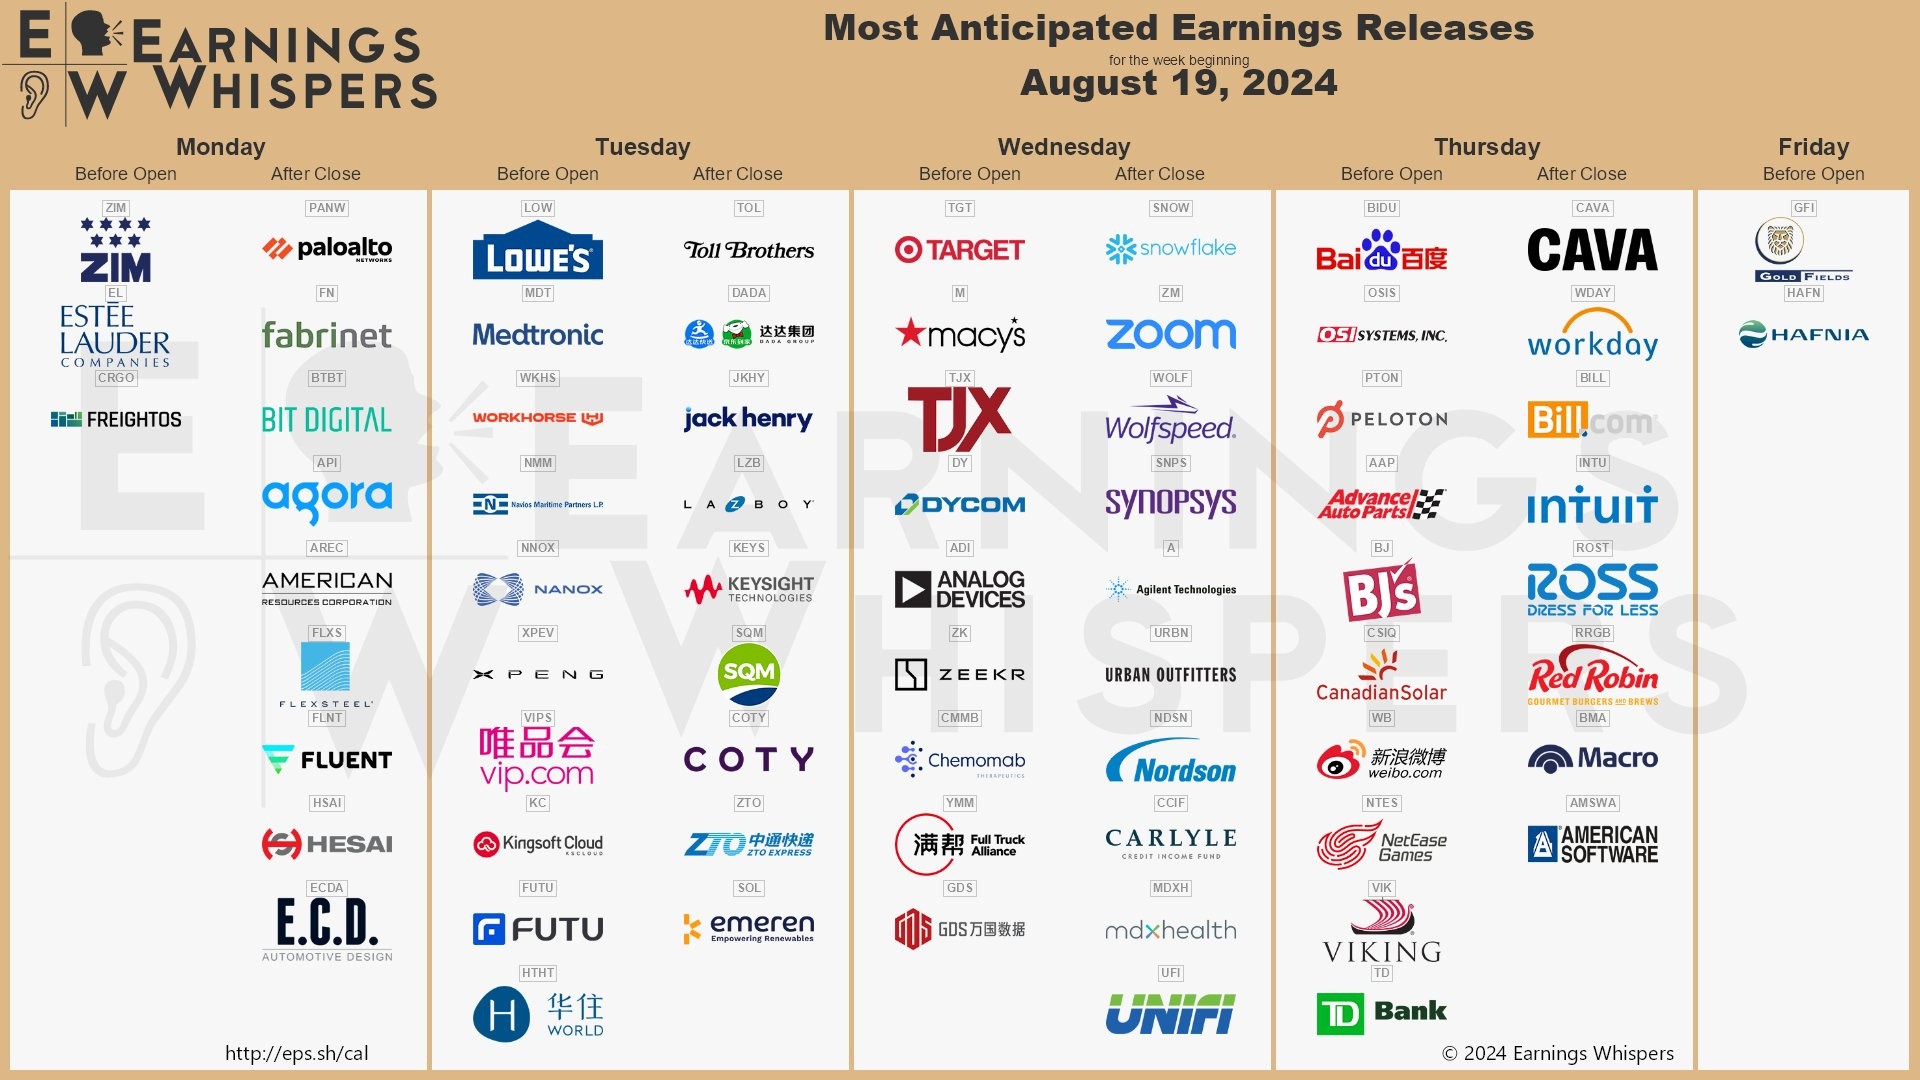
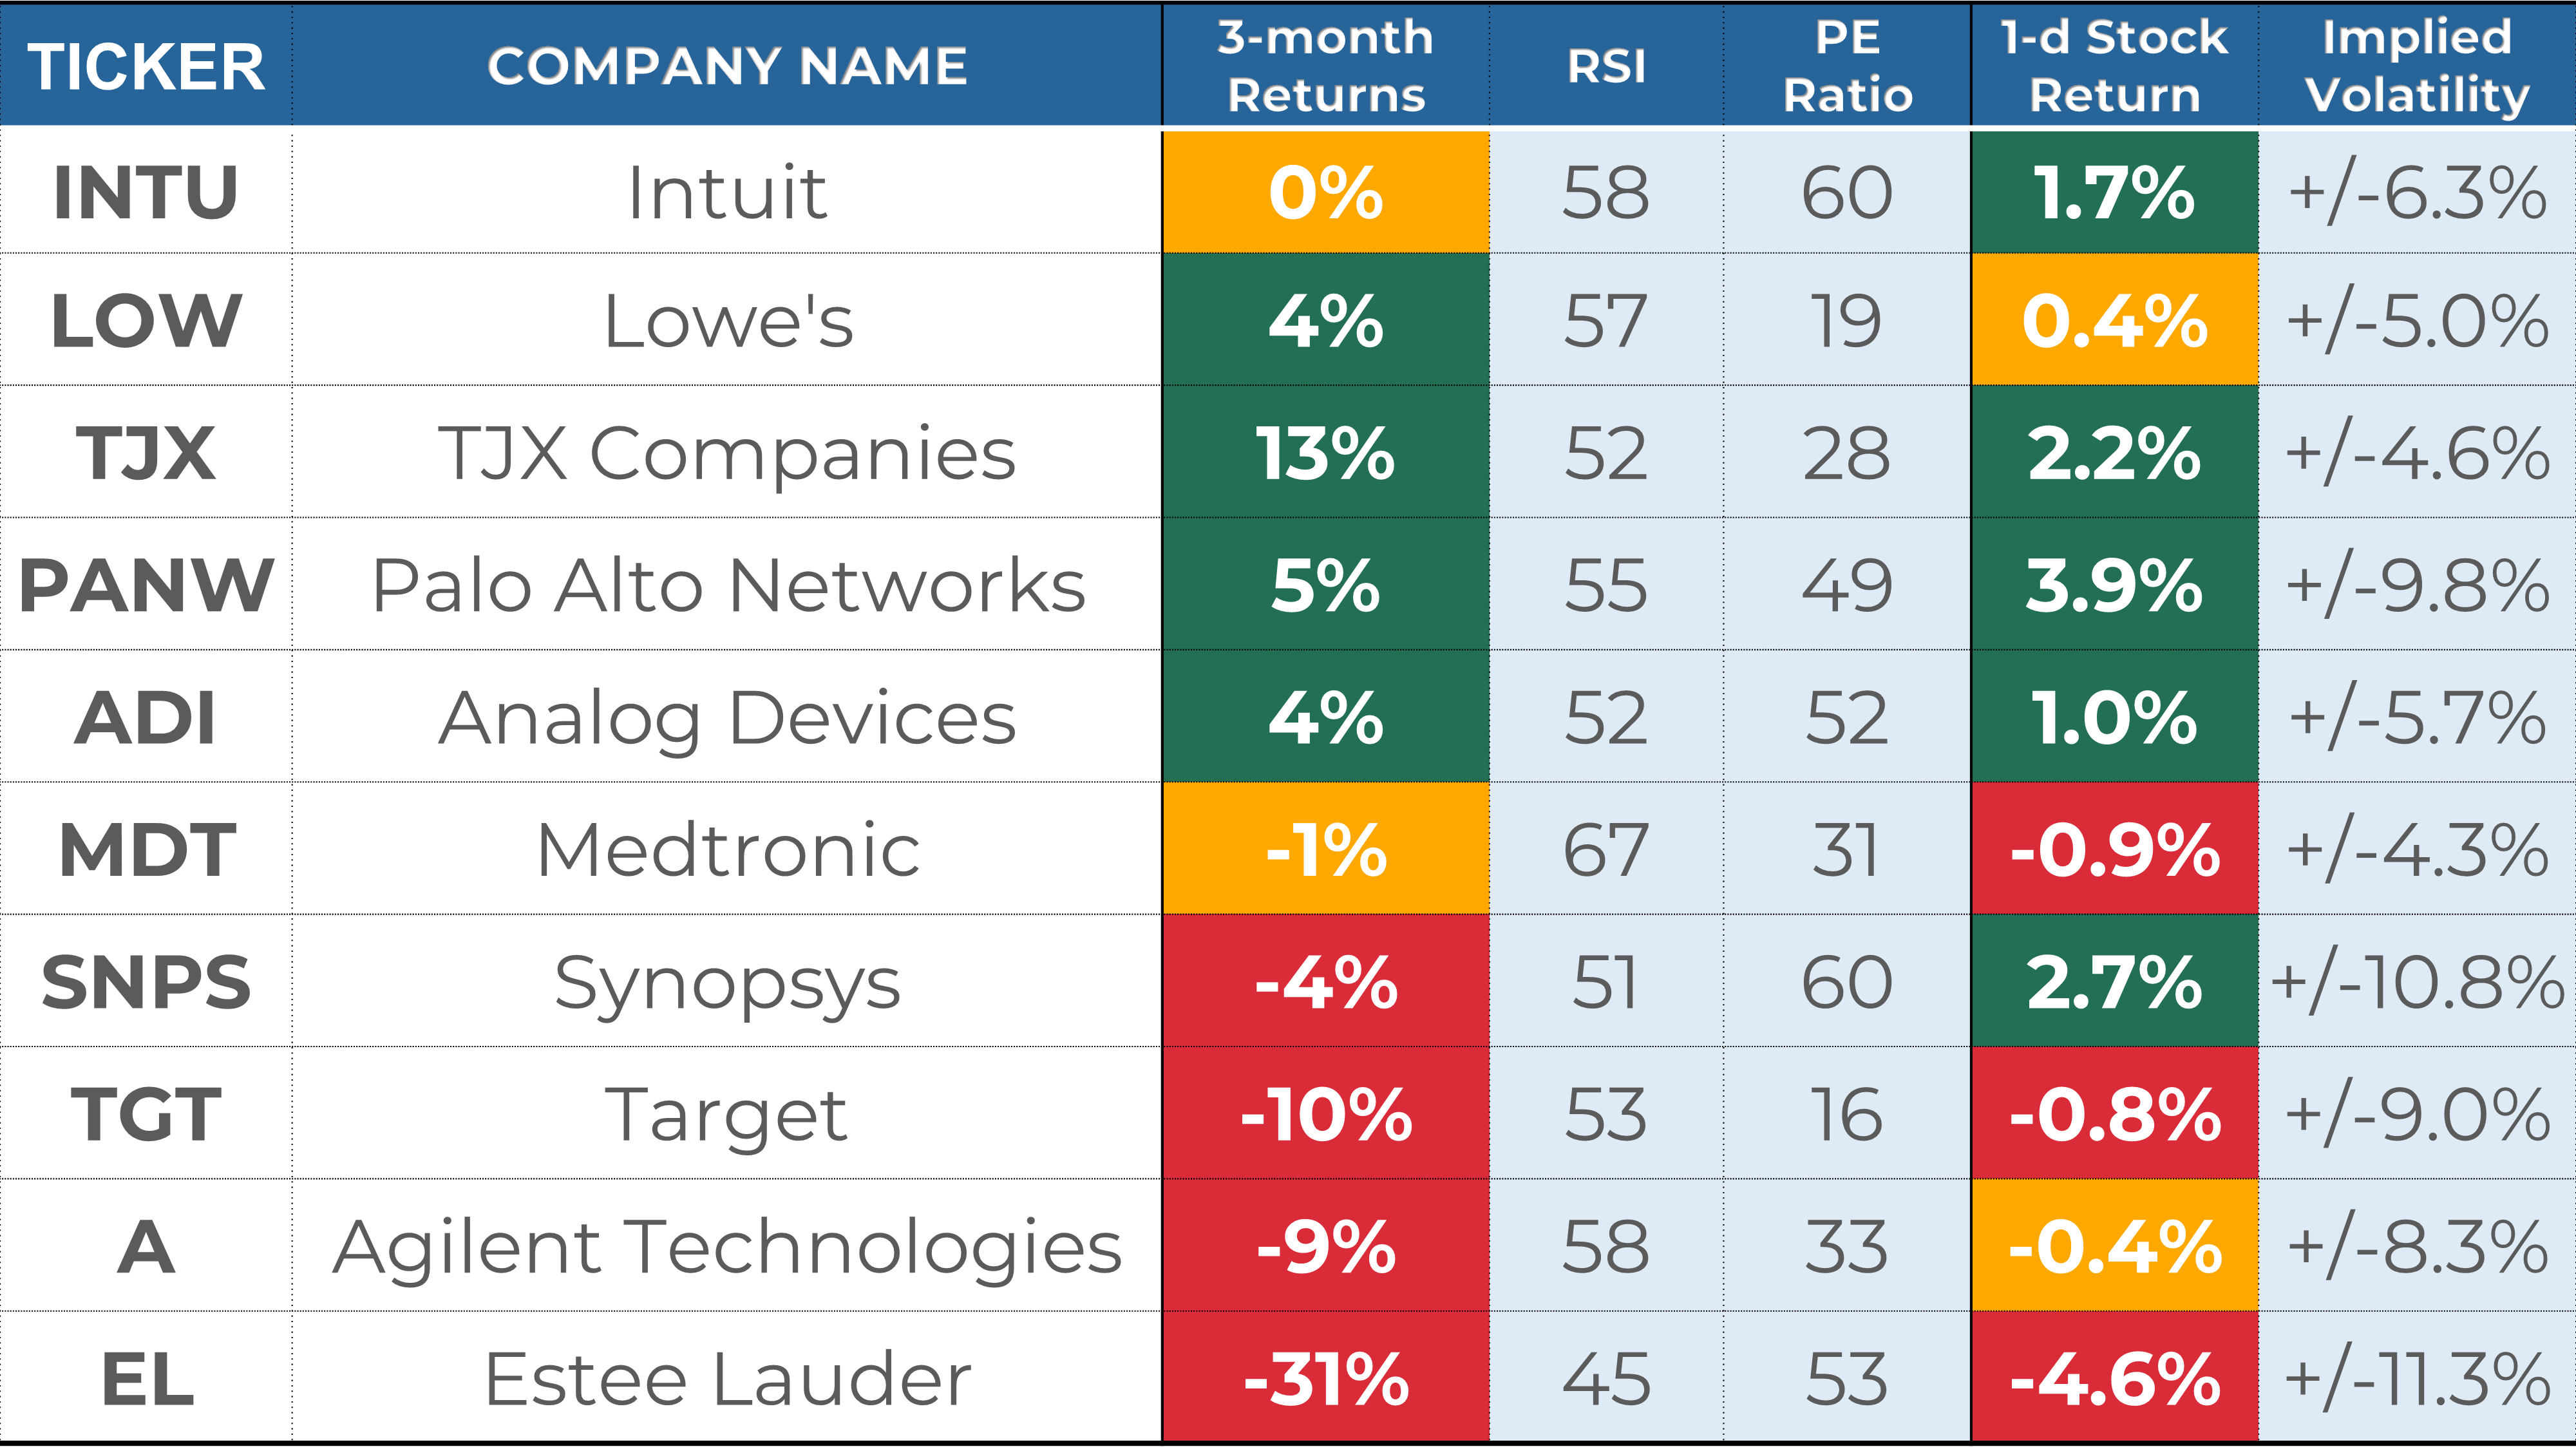
3. Next Week’s Earnings Watchlist
Below is my watchlist of stocks reporting week next week, along with several key indicators I like to review:
Stock Indicators:
Stock performance in the last 3 months.
RSI, where a reading of 70 indicates overbought status and a reading of 30 oversold.
PE ratio, where a reading below 25 indicates a "cheap" valuation and/or low growth expectations.
Stock Price Reactions to Earnings:
1-day Stock Return on Earnings is the stock performance on the earnings release date.
Implied volatility is the expected 1-day stock change after earnings are released, as assessed by the options markets.
Every week, I share my analysis of 1 stock reporting earnings in the coming days, focusing on implications for long-term investors. This week, I prepared an in-depth overview of Intuit ($INTU). In this post, I break down key data points around Intuit’s fundamentals, stock returns, analyst ratings, and past earnings performance to help you make informed investment decisions. Check out the post and learn why I gave a “BUY” rating to Intuit.

That’s a wrap for this week’s recap! I hope it helped you understand the market better.
If you enjoyed this post, you should explore the premium section: I provide my short-term trading and analysis of over 20 US large caps and share my long-term investing portfolios. Upgrade your subscription to unlock all the exclusive features and insights.
If you have any questions or feedback, please don't hesitate to email me or comment on this post. Your support helps me create high-quality content and is greatly appreciated!
Have a great week!
My Weekly Stock
DISCLAIMER
The information provided in this newsletter is for informational purposes only and should not be taken as financial advice. Any investments or decisions made based on the information provided in this newsletter are the reader's sole responsibility. We recommend that readers conduct their own research and consult a qualified financial professional before making investment decisions. The author does not assume any responsibility for any losses or damages arising from using the information provided in this newsletter.
Great report. Perfect week for the bulls indeed. Tough time to be a permabear.