


Weekly Market Recap (Dec 16-20): The Fed Sends Markets Lower But The Santa Rally Is Not (Yet) Canceled
Everything you need to know about last week's markets performance and what to expect next.
Dear subscribers,
Welcome to My Weekly Stock, where we blend in-depth market analysis with proven momentum-based trading strategies. My mission? Help you navigate the financial markets with unbiased, data-driven insights you can act on!
Every week, I spend hours curating this market recap, producing insightful analyses with clear visuals and a structured layout so you can easily find what you need, week after week. And because it's easy to get swayed by personal bias, I like to let the data do most of the talking.
Remember to upgrade your subscription if you want access to my 3 winning portfolios—and so much more: a clear investing framework, momentum-based analysis and live portfolio updates
If you’re ready to give it a try—or just want to support my work—this is your chance!
It is the final Weekly Market Recap of the year, and I’d like to take this opportunity to wish you all a joyful and relaxing holiday season. The next market recap will be released on Jan 10th, with some exciting improvements. Until then, take care, enjoy the holidays, and I’ll see you in the new year!
SUMMARY
Here are this week's highlights and what to look out for next:
1. The markets were negative this week, with the S&P 500 down -2%, the Nasdaq -1.7%, and the Dow Jones -2.3%. Technology (-1.3%) and Utilities (-1.6%) were the best-performing sectors.
2. The S&P 500's long-term trend is positive, and the short-term momentum is negative. 5,980 is the next resistance, while 5,850 is support.
3. The Q3 earnings season is over and all the companies from the S&P 500 index have released their Q3 results, with 76% beating estimates. Earnings are expected to be up 9% in Q3 2024 and 10% in 2024.
4. Market sentiment is at the "Fear" level (28) as measured by CNN’s Fear & Greed indicator, while VIX is at a medium value of 18.
5. We have a holiday-shortened week ahead with no significant earnings or economic reports expected.
My take:
As I noted last week, the S&P 500 was coiled tight, trading within a narrow 70-point range. Unfortunately, it resolved to the downside after a disappointing rates outlook from the Fed. The index tumbled to the post-election gap at 5,850, cutting through key support levels along the way. Friday's pre-market looked particularly alarming, with the market appearing on the verge of breaking down further and retracing all election gains. However, a better-than-expected PCE report helped markets stage a strong comeback.
Now what? The 5,850–6,100 range has become a noisy zone. We could rally back to the upper end, especially if breadth improves and strength extends beyond tech. On the flip side, support at 5,850 has now been tested twice, and may not hold on another test. With year-end holidays approaching, markets are likely to slow down, but January promises a busy start with a new earnings season, a new president taking office, and more economic reports. Until then, wishing you all a wonderful holiday season!

PERFORMANCE RECAP
1. S&P 500 Sector Performance
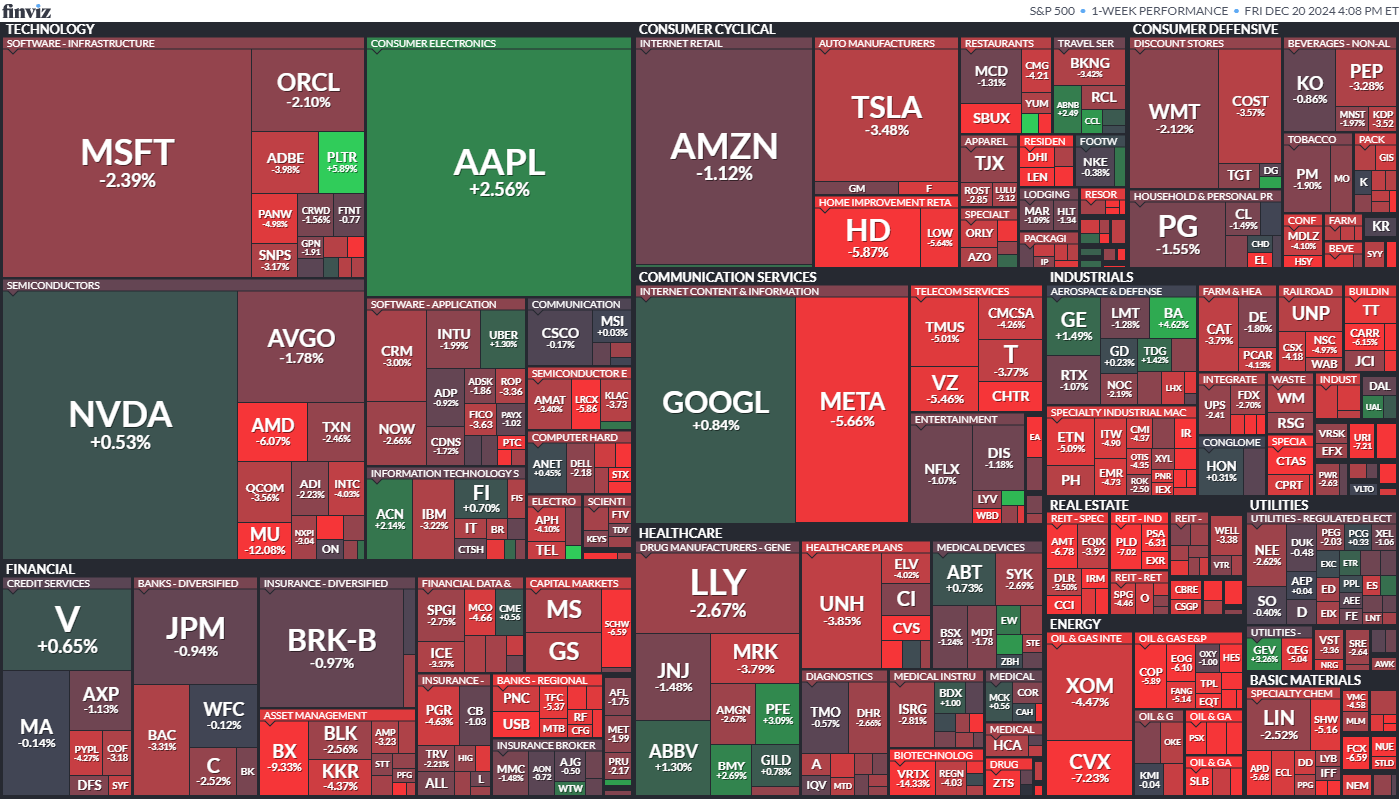
Over the week, none of the 11 S&P 500 sectors have achieved gains. Technology led the way, still declining by -1.3%. By contrast, Energy was the weakest, falling by -5.7%.
Year-to-date, 10 sectors have seen positive results. Communication Services has been the most successful sector, with a 35% gain. On the other hand, Energy has been trailing behind.

2. S&P 500 Top & Worst Performers
In the last 5 trading days, 13% of the stocks in the S&P 500 index rose in value.
The best-performing stocks were:
Darden Restaurants, Inc (DRI, 12%)
Match Group Inc (MTCH, 7%)
Jabil Inc (JBL, 7%)
Meanwhile, the worst-performing stocks were:
Vertex Pharmaceuticals, Inc (VRTX, -14%)
Amentum Holdings Inc (AMTM, -17%)
Lamb Weston Holdings Inc (LW, -22%)
In addition, 19 stocks within the S&P 500 reached a new 52-week high, while 42 set new lows. Most of the lows this week came from the Healthcare sector.

MARKET TRENDS & MOMENTUM
1. S&P 500 Long-Term Trend
The long-term trend for the S&P 500 is positive. I base this evaluation on the 9 and 30-week exponential moving averages (EMAs). To determine if the trend is strongly positive, I look for the following conditions (the 1st is the most important):
9-week EMA is above the 30-week EMA: 🟡
Price is trading above the 9-week EMA: 🟢
Price is trading above the 30-week EMA: 🟢
The 9-week EMA trend line is rising: 🟢
The 30-week EMA trend line is rising: 🟢
I also use the MACD as an additional tool to detect trend changes. The MACD line is above its signal line, a positive indication for the index.

2. S&P 500 Technical Analysis
Healthy bull markets typically see the index set several new highs, broad market participation, and ascending trend lines. That's why I've created a four-part scorecard – a straightforward tool to give us a comprehensive view of these essential health indicators.
Momentum: The index is flat over the past month, up 4% in the last three months, and is trading 3% away from its 52-week high.
Breadth: Market participation is mixed in the long term, as 55% of S&P 500 stocks are trading above their 200-day moving average (SMA). Meanwhile, 11% of the stocks are trading above their 20-day SMA, down from 29% the previous week. A reading above 80% or below 20% typically indicates an overextended trend.
Trends: The trend on the 1-day chart is negative, with the index trading below its 21-period exponential moving average.
Key levels: The next resistance level is 5,980. On the other hand, the next support area is at 5,850, followed by 5,780.

3. Momentum Analysis of the Week
This week's momentum analysis is about the most oversold stocks in the S&P 500 based on the Relative Strength Index. RSI is a momentum oscillator used to measure the speed and change of price movements. RSI is considered overbought when it is above 70 and oversold when it is below 30. While I would never use RSI alone to make an investment decision, it can be a helpful tool to identify a potential change in trend.

EARNINGS RECAP
1. Q3 and Full Year 2024 Expected EPS & Revenue Growth
Q3 2024 earnings for the S&P 500 are expected to be up 9%. Excluding the energy sector, the figure is +12%.
Earnings are projected to grow by 10% in 2024, slightly higher than the 9% growth seen on average over the last decade. In the past four weeks, 50% of earnings revisions made by analysts were to increase their outlook.
The forward 4-quarter P/E ratio is 23.1, higher than the average over the past five and ten years.
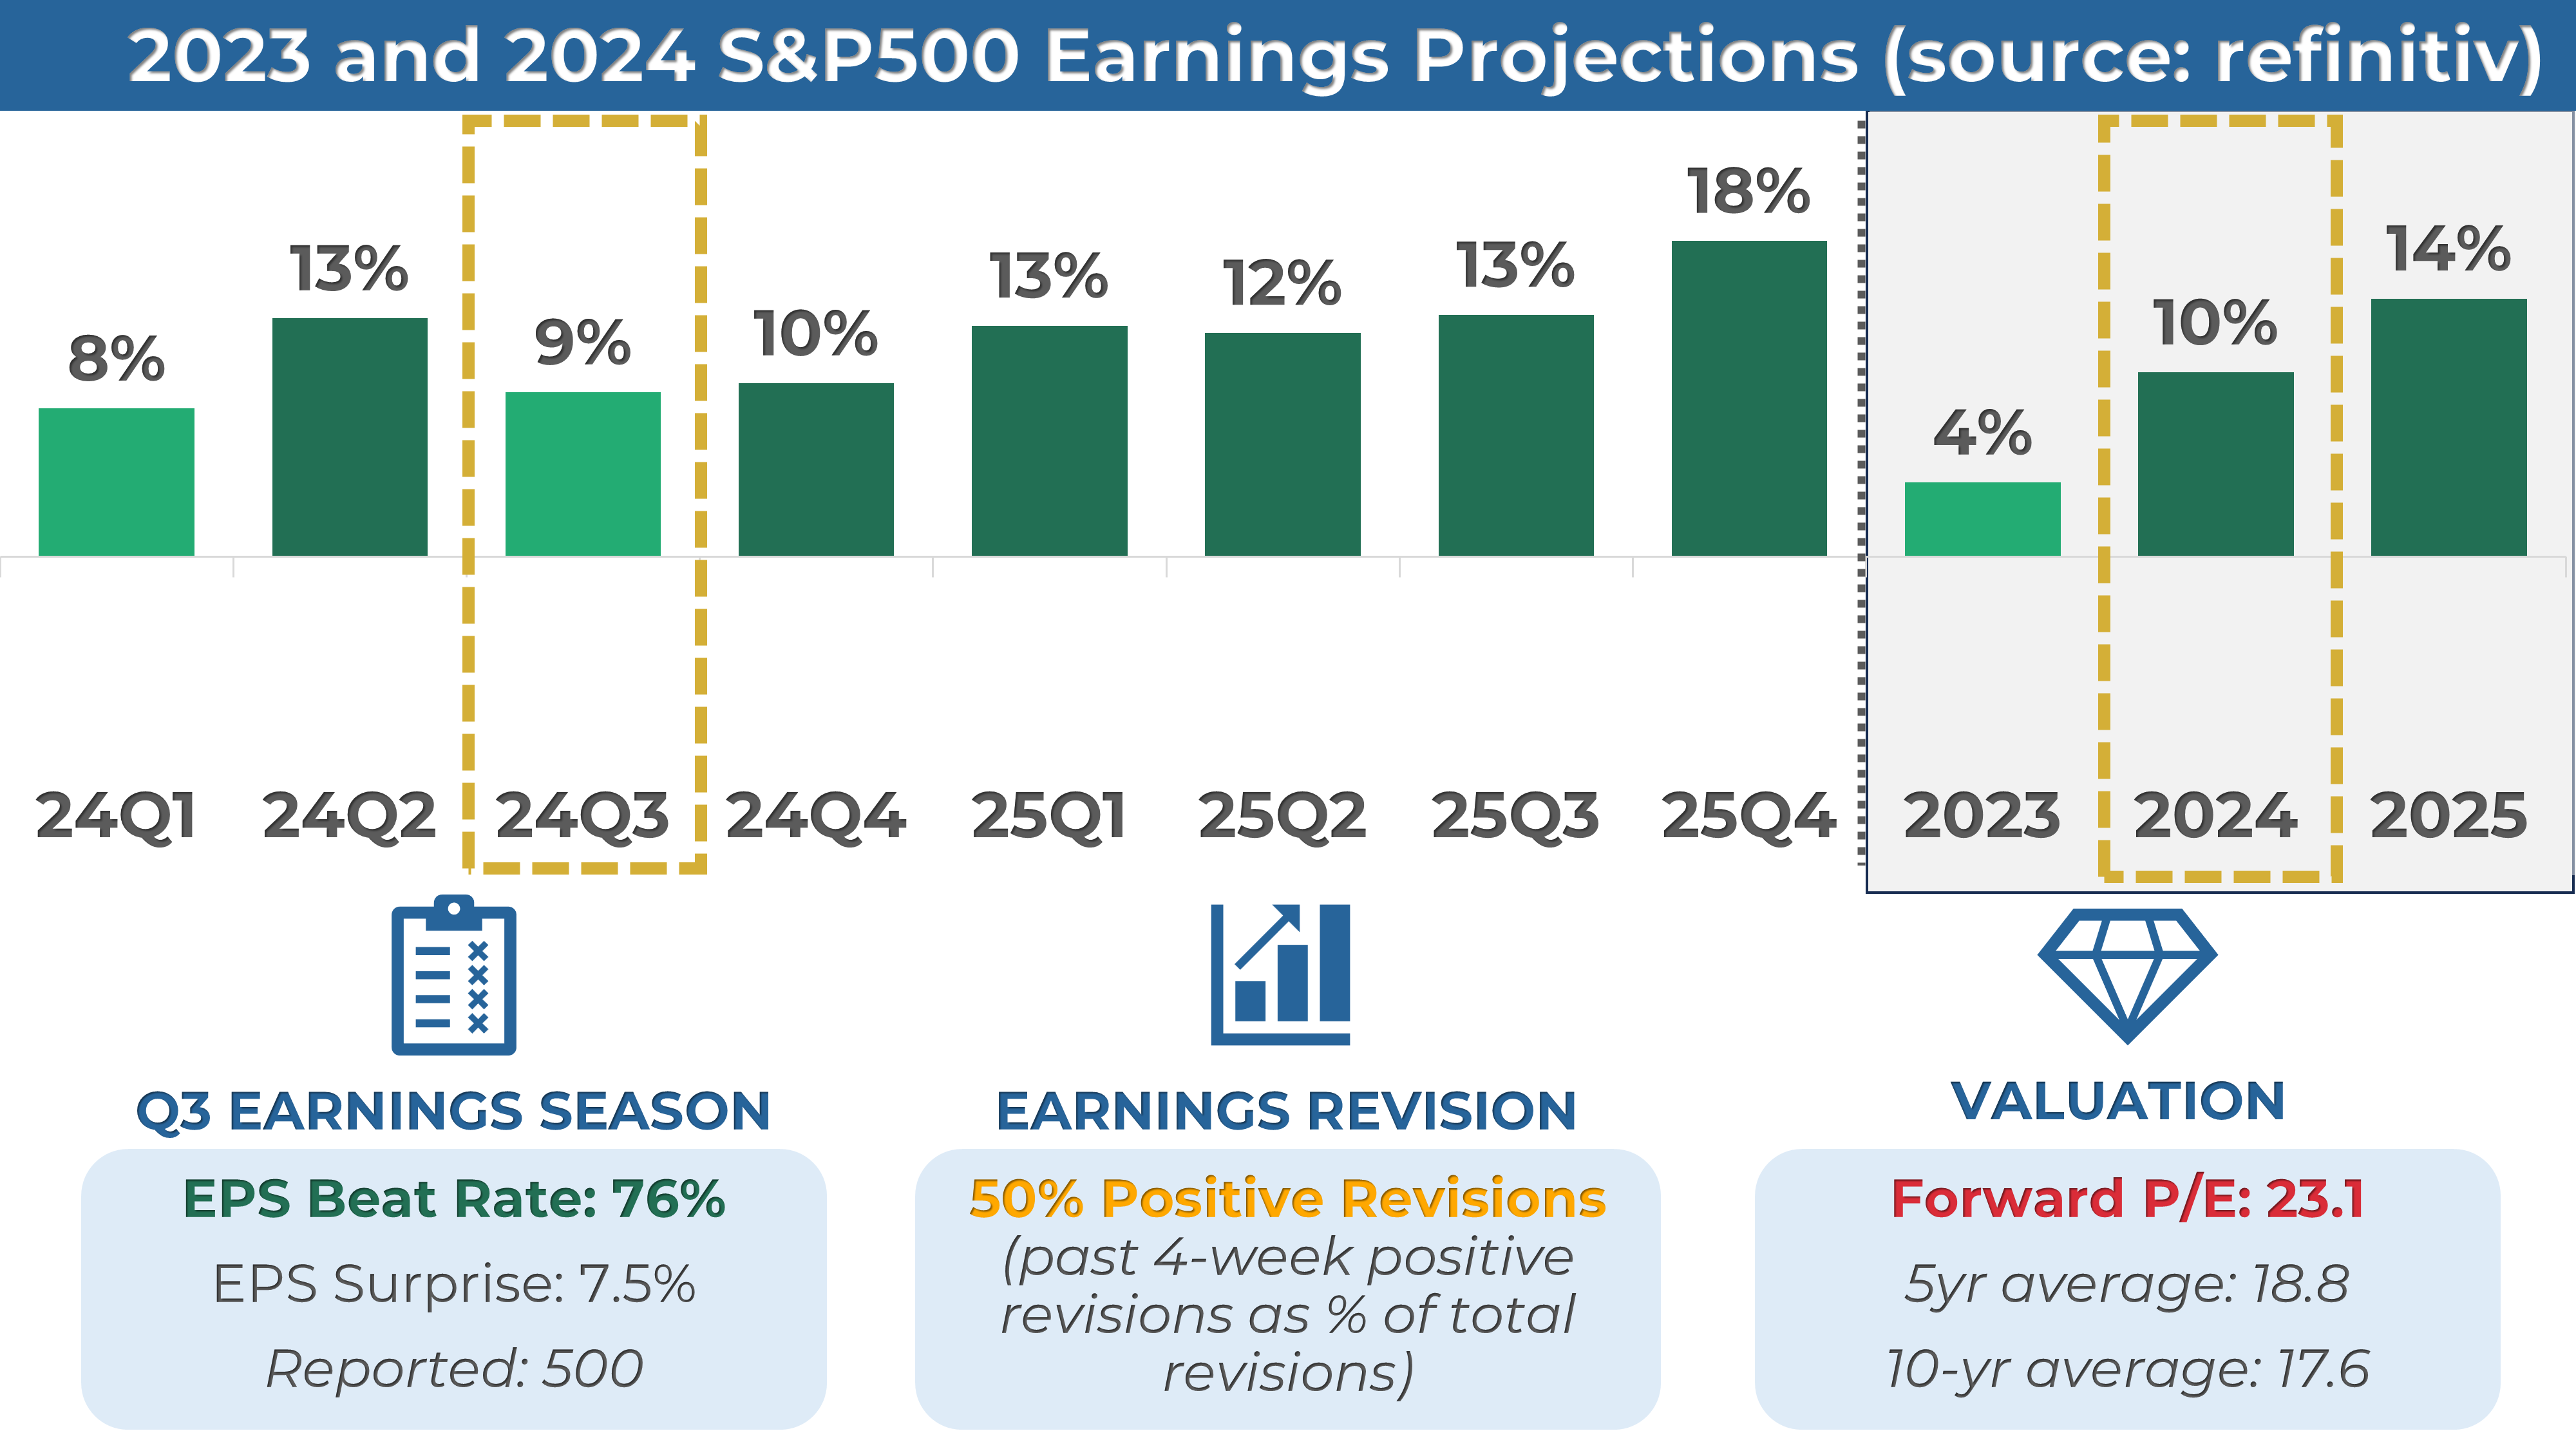
2. Q3 Earnings Season Summary
All companies from the S&P 500 index have released their third-quarter earnings, with 76% posting higher EPS than expectations. This is below the previous four-quarter average of 79% and higher than the historical average of 67%.
MARKET SENTIMENT
Measures of investor sentiment can be helpful as they provide insight into the views and opinions of professional or individual investors. However, it's important to note that these measures are not perfect predictors of market movements. They should be combined with other indicators and analysis tools for a complete market picture.

1. AAII Sentiment Survey (Individual Investors)
The American Association of Individual Investors (AAII) conducts a weekly survey among its members to gauge their expectations for the stock market over the next six months. The results are published every Wednesday.
According to the most recent AAII survey, 41% of the respondents had a bullish outlook on the stock market, decreasing by 2 points from the previous week.
2. BofA Bull & Bear Indicator (Institutional Investors)
The Bank of America Bull-Bear Indicator is a proprietary measure of investor sentiment developed by Bank of America. It is based on a survey of fund managers and institutional investors, and it tracks the percentage of respondents who are bullish, bearish, or neutral on the stock market. Results are published in the form of a score ranging from 0 (extremely bearish) to 10 (extremely bullish)
The latest reading available of the indicator was 3.4, a slightly bearish sentiment reading.
3. CNN Fear & Greed Index (Technical)
The CNN Fear & Greed Index is a daily measure that analyzes seven market indicators to assess how emotions influence investors' decisions. The index is scored out of 100 and categorizes results into five stages: Extreme Fear, Fear, Neutral, Greed, and Extreme Greed.
The index closed at 28, or a “Fear” level, down from 50 last Friday.
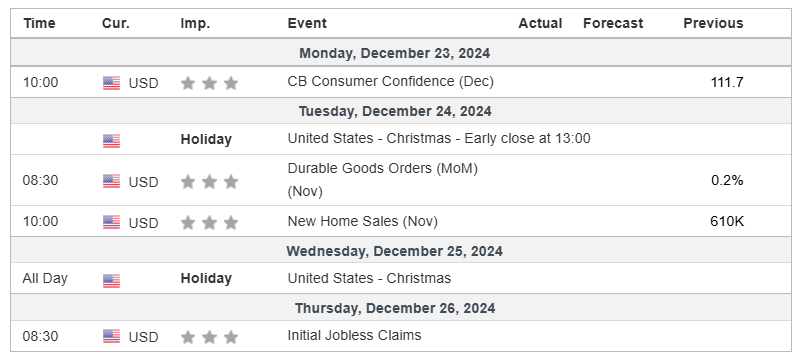
THE WEEK AHEAD
1. Economic Calendar
It should be a calm week ahead, with markets closing on Tuesday afternoon and Wednesday for the Christmas holiday and no significant economic reports expected.
2. Earnings Calendar
Earnings season is over and no major report is expected next week.
If you enjoyed this post, you should explore the premium section: I provide my short-term trading and analysis of over 20 US large caps and share my long-term investing portfolios. Upgrade your subscription to unlock all the exclusive features and insights.
If you have any questions or feedback, please don't hesitate to email me or comment on this post. Your support helps me create high-quality content and is greatly appreciated!
It is the final Weekly Market Recap of the year, and the next recap will be out on Jan 10th. Until then, enjoy the holidays, and see you in the new year!
My Weekly Stock
DISCLAIMER
The information provided in this newsletter is for informational purposes only and should not be taken as financial advice. Any investments or decisions made based on the information provided in this newsletter are the reader's sole responsibility. We recommend that readers conduct their own research and consult a qualified financial professional before making investment decisions. The author does not assume any responsibility for any losses or damages arising from using the information provided in this newsletter.