


Weekly Market Recap (Feb 26-Mar 1): Another Week, Another Record High. When Will the Bears Step In?
Everything you need to know about last week's markets performance and what to expect next.
Dear subscribers,
Welcome to My Weekly Stock, where we blend in-depth market analysis with proven momentum-based trading strategies. My mission? Help you navigate the financial markets with unbiased, data-driven, and actionable insights.
Every week, I spend hours curating this market recap, producing insightful analyses with clear visuals and a structured layout so you can easily find what you need, week after week. And because it's easy to get swayed by personal bias, I like to let the data do most of the talking.
If you value my straightforward approach and are interested in deeper insights or curious about my short- and long-term investment strategies, consider exploring the paid section of this newsletter. The 1st month is on us!
SUMMARY
Here are this week's highlights and what to look out for next:
1. The markets were up for the week, with the S&P 500 up 1%, the Nasdaq 1.7%, and the Dow Jones -0.1%. Technology (+2.7%) and Real Estate (+2.1%) were the best-performing sectors.
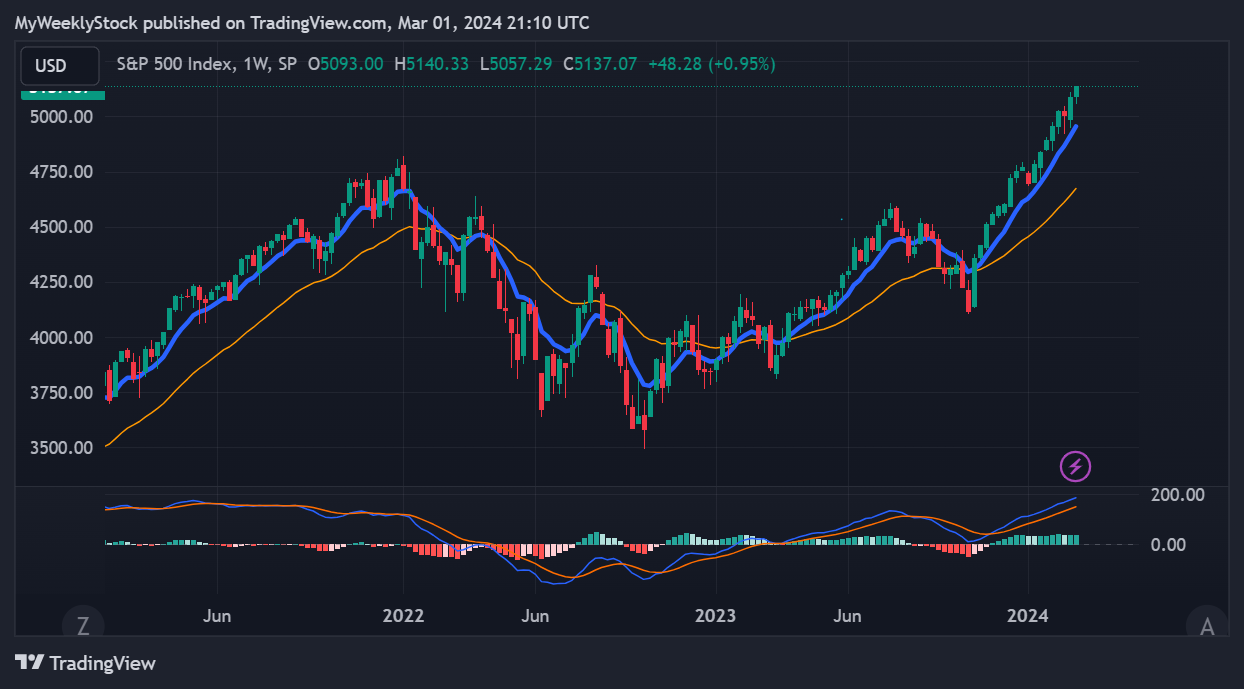
2. The S&P 500's long-term trend is positive. 5,200 is the next resistance, while 4,920 is support.
3. The earnings season is well underway, and 487 companies from the S&P 500 index have released their 4th quarter results, with 76% beating estimates. Earnings are expected to be up 10% in Q4 2023 and 10% in 2024.
4. Market sentiment is at the "Extreme Greed" level (77) as measured by the Fear & Greed indicator, while VIX remains low at 13.
5. Earnings reports from Cosco and Broadcom, the Fed Chair's testimony to Congress, and the latest job report are scheduled for next week.
My take:
This week brought us another record high for the S&P 500, surpassing the 5,100 mark, with still no signs of the bears. The trend remains strong, and many major stocks are breaking above significant psychological levels (NVDA > $800; META > $500). Additionally, we see more risk-on behavior among investors, as seen in the performance of small caps and cryptocurrencies.
Let's bear in mind that the market will inevitably turn at some point. But predicting the exact moment when the market will change direction is practically impossible (and pointless, in my opinion). A more effective strategy is to look for the loss of a major support level and a change in the direction of trend lines. In that regard, I'll closely monitor how the index behaves around the 5,100 level upon any retests. The 4,920 area is the critical zone that could cause further weakness if lost. Until then, let's enjoy the current trend and the profits it brings.

PERFORMANCE RECAP
1. S&P 500 Sector Performance
Over the week, 7 of the 11 S&P 500 sectors have achieved gains. Technology led the way and rose by 2.7%. By contrast, Health Care was the weakest and fell by -1%.
Year-to-date, 9 sectors have seen positive results. Communication Services has been the most successful sector, with a 10% gain. On the other hand, Utilities has been trailing behind.

2. S&P 500 Top & Worst Performers
Last week, 59% of the stocks in the S&P 500 index have risen in value.
The best-performing stocks were:
Constellation Energy Corporation (CEG, 27%)
Netapp Inc (NTAP, 20%)
Norwegian Cruise Line Holdings Ltd (NCLH, 19%)
Meanwhile, the worst-performing stocks were:
Unitedhealth Group Inc (UNH, -7%)
Insulet Corporation (PODD, -8%)
Xcel Energy, Inc. (XEL, -16%)

In addition, 122 stocks within the S&P 500 reached a new 52-week high, while 2 set new lows, indicating the momentum remains on the upside.
The Industrials sector has seen the largest number of new highs this week, while most of the lows were in Utilities and Materials.

MARKET TRENDS & MOMENTUM
1. S&P 500 Long-Term Trend
The long-term trend for the S&P 500 is positive. I base this evaluation on the weekly chart's 9 and 30 exponential moving averages (EMAs). To determine if the trend is strongly positive, I look for the following conditions (the 1st is the most important):
EMA9 is above the EMA30: 🟢
Price is trading above the EMA9: 🟢
Price is trading above the EMA30: 🟢
EMA9 is rising: 🟢
EMA30 is rising: 🟢
I also use the MACD as an additional tool to detect trend changes. The MACD is above its signal line, a positive indication for the index.
2. S&P 500 Technical Analysis
Healthy bull markets typically see the index set several new highs, broad market participation, and ascending trend lines. That's why I've created a four-part scorecard – a straightforward tool to give us a comprehensive view of these essential health indicators.
Momentum: the index is up 6% over the past month and 13% in the last three months, now trading less than 1% shy of its 52-week high.
Breadth: Market participation remains healthy in the long term, as 73% of S&P 500 stocks are trading above their 200-day moving average (SMA). Meanwhile, 73% of stocks are trading above their 20-day SMA, increasing by 1 point compared to the previous week.
Trends: The trend on the 1-day and 4-hour charts is positive, with rising trend lines.
Key levels: We broke from the 5,100 zone on Friday, and the next resistance could be 5,200, where we might finally consolidate. I have no concerns as long as we hold 4,920-40, where we found our footing in February. If we see a more substantial pullback, we could revisit 4,800s.

Have you enjoyed my analysis so far? The premium section offers much more: I provide my short-term trading and analysis of over 20 US large caps and share my long-term investing portfolios. Upgrade your subscription to unlock all the exclusive features and insights!
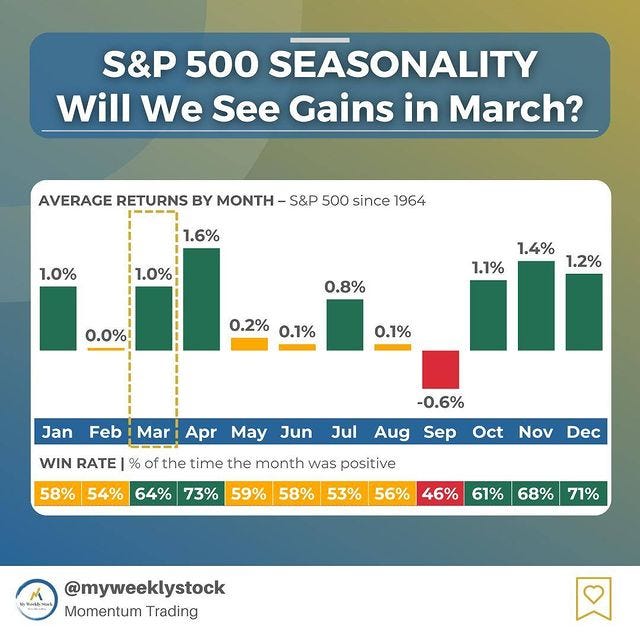
3. Momentum Analysis of the Week
This week's momentum analysis is about the S&P 500 seasonality. As we start the month of March, I took a closer look at the historical performance of the S&P 500. Over the past 60 years, March has been up on average by 1.0% and positive 64% of the time.
EARNINGS RECAP
1. Q4 and 2024 Expected EPS & Revenue Growth
Q4 2023 earnings for the S&P 500 are expected to be up 10%. Excluding the energy sector, the figure is +13%.
The earnings are projected to grow by 10% in 2024, higher than the 9% growth seen on average over the last decade. In the past 4 weeks, 50% of earnings revisions done by analyst were to increase their outlook.
The forward 4-quarter P/E ratio is 21.0, higher than the average over the past five and ten years.

2. Q4 Earnings Season Summary
487 companies from the S&P 500 index have released their Q4 2023 earnings, with 76% posting higher EPS than expectations. This is in line with the previous four-quarter average of 76% and above the historical average of 67%.
MARKET SENTIMENT
Measures of investor sentiment can be helpful as they provide insight into the views and opinions of professional or individual investors. However, it's important to note that these measures are not perfect predictors of market movements. They should be combined with other indicators and analysis tools for a complete market picture.

1. AAII Sentiment Survey (Individual Investors)
The American Association of Individual Investors (AAII) conducts a weekly survey among its members to gauge their expectations for the stock market over the next six months. The results are published every Wednesday.
According to the most recent AAII survey, 47% of the respondents had a bullish outlook on the stock market, up 3 points from the previous week. The bullish sentiment is above the historical average for the 17th week in a row.
2. BofA Bull & Bear Indicator (Institutional Investors)
The Bank of America Bull-Bear Indicator is a proprietary measure of investor sentiment developed by Bank of America. It is based on a survey of fund managers and institutional investors, and it tracks the percentage of respondents who are bullish, bearish, or neutral on the stock market. Results are published in the form of a score ranging from 0 (extremely bearish) to 10 (extremely bullish)
The indicator declined from 6.6 to 6.4, and showing bullish but not yet "extreme" bullish sentiment.
3. CNN Fear & Greed Index (Technical)
The CNN Fear & Greed Index is a daily measure that analyzes seven market indicators to assess how emotions influence investors' decisions. The index is scored out of 100 and categorizes results into five stages: Extreme Fear, Fear, Neutral, Greed, and Extreme Greed.
The index closed at 77, or the “Extreme Greed” level, down from 78 last Friday.
THE WEEK AHEAD
1. Economic Calendar
The upcoming week's highlight will be the Non-Farm Payroll report on Friday, a crucial indicator of the job market's health. Additionally, Fed Chair Jerome Powell is scheduled to testify in front of Congress and will offer more insights about the recent monetary policy actions from the central bank.

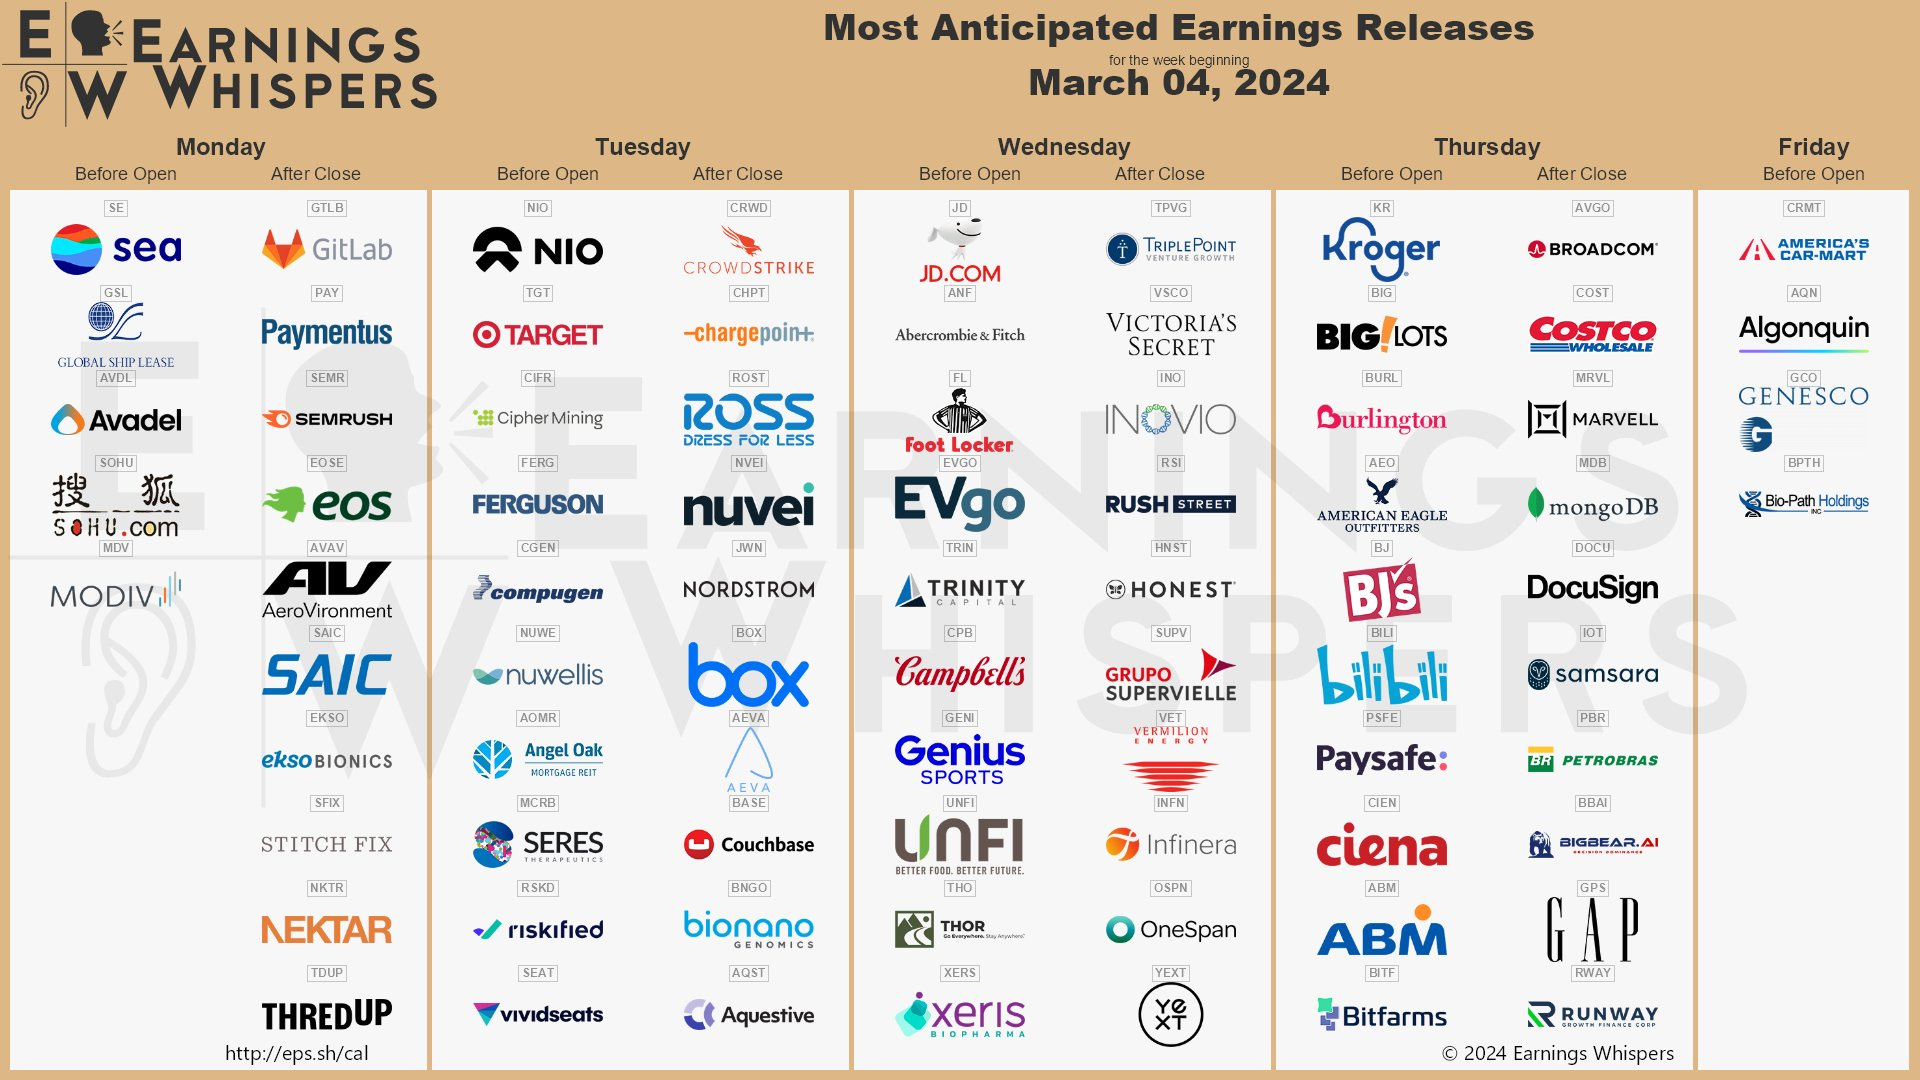
2. Earnings Calendar
The earnings season continues next week, and 6 companies from the S&P 500, including Broadcom and Costco, are expected to release their quarterly results.
3. Next Week’s Earnings Watchlist
Below is my watchlist of stocks reporting week next week, along with several key indicators I like to review:
Stock Indicators:
Stock performance in the last 3 months.
RSI, where a reading of 70 indicates overbought status and a reading of 30 oversold.
PE ratio, where a reading below 25 indicates a "cheap" valuation and/or low growth expectations.
Stock Price Reactions to Earnings:
1-day Stock Return on Earnings is the stock performance on the earnings release date.
Implied volatility is the expected 1-day stock change after earnings are released, as assessed by the options markets.
It is helpful to analyze these indicators to understand better the stocks before their earnings.

Every week, I share a deep dive into 1 stock reporting earnings in the coming days. This week, I prepared an in-depth overview of Broadcom (AVGO). In this post, I break down key data points around Broadcom’s fundamentals, stock returns, analyst ratings, and past earnings performance to help you make informed investment decisions.

Thank you for reading my weekly market recap! I hope you found it helpful in understanding the stock markets better.
Whenever you are ready, here are the practical ways I can help you further:
Upgrade your subscription to access my trading and investing portfolios and more in-depth momentum analysis. And remember, the 1st month is for free!
Book a portfolio audit to get an unbiased, data-driven, and actionable review of your stocks. Please email me at contact@myweeklystock.com, and let’s get started!
If you have any questions or feedback, please don't hesitate to email me or comment on this post. Your support helps me create high-quality content and is greatly appreciated!
Have a great week!
My Weekly Stock
DISCLAIMER
The information provided in this newsletter is for informational purposes only and should not be taken as financial advice. Any investments or decisions made based on the information provided in this newsletter are the reader's sole responsibility. We recommend that readers conduct their own research and consult a qualified financial professional before making investment decisions. The author does not assume any responsibility for any losses or damages arising from using the information provided in this newsletter.