

Weekly Market Recap (Feb. 28 - Mar. 3)
Weekly Market Recap (Feb. 28 - Mar. 3)
Everything you need to know about last week's markets performance and what to expect next

Dear subscribers,
Welcome to our weekly market recap!
Navigating the markets can be overwhelming, but I'm here to provide you with the latest updates and actionable insights to help you succeed. Whether you're an experienced investor or just starting out, my recap has something for everyone.
I hope you enjoy this week's edition and find it helpful. If you like what you see, please share it with your network on social media and, if you haven't already, subscribe to our email updates.
Thank you for joining us, and let's get started!
SUMMARY
Here are this week's highlights and what to look out for next:
1. The markets were up for the week, with the S&P 500 up 1.9%, the Dow Jones 1.8%, and the Nasdaq 2.7%. Materials (+4.2%) and Industrials (+3.4%) were the best-performing sectors.
2. The markets saw a late-week surge following positive remarks from the Atlanta Federal Reserve President member indicating that a 25-bps rate increase may be discussed at the upcoming meeting.
3. The long-term trend for the S&P500 is mixed, but we successfully held the 1-year trend line and the 200-day moving average this week.
4. The earnings season is almost over, and 493 companies from the S&P 500 index have released their Q4 results, with 68% beating estimates. Earnings are expected to fall 3% in Q4 2022 and rise 2% in 2023.
5. Earnings reports from Oracle, Ulta Beauty, and Campbell Soup are scheduled for next week, along with the release of the non-farm payroll report for February.
My take:
Despite a volatile week, the S&P 500 managed to gain by the end of the week. We successfully backtested the 200-day moving average and the 1-year trendline and rose above the 4,000 psychological level. It is an encouraging development, and I have moderate bullish expectations for the coming week.
Looking ahead to next week, with the earnings season almost over and no inflation reports for another 2 weeks, it is likely that we will continue to (over)react to the comments made by Fed members. The week begins with Fed Chairman Powell's semi-annual testimony in front of Congress on Monday/Tuesday, which will be worth watching.

PERFORMANCE RECAP
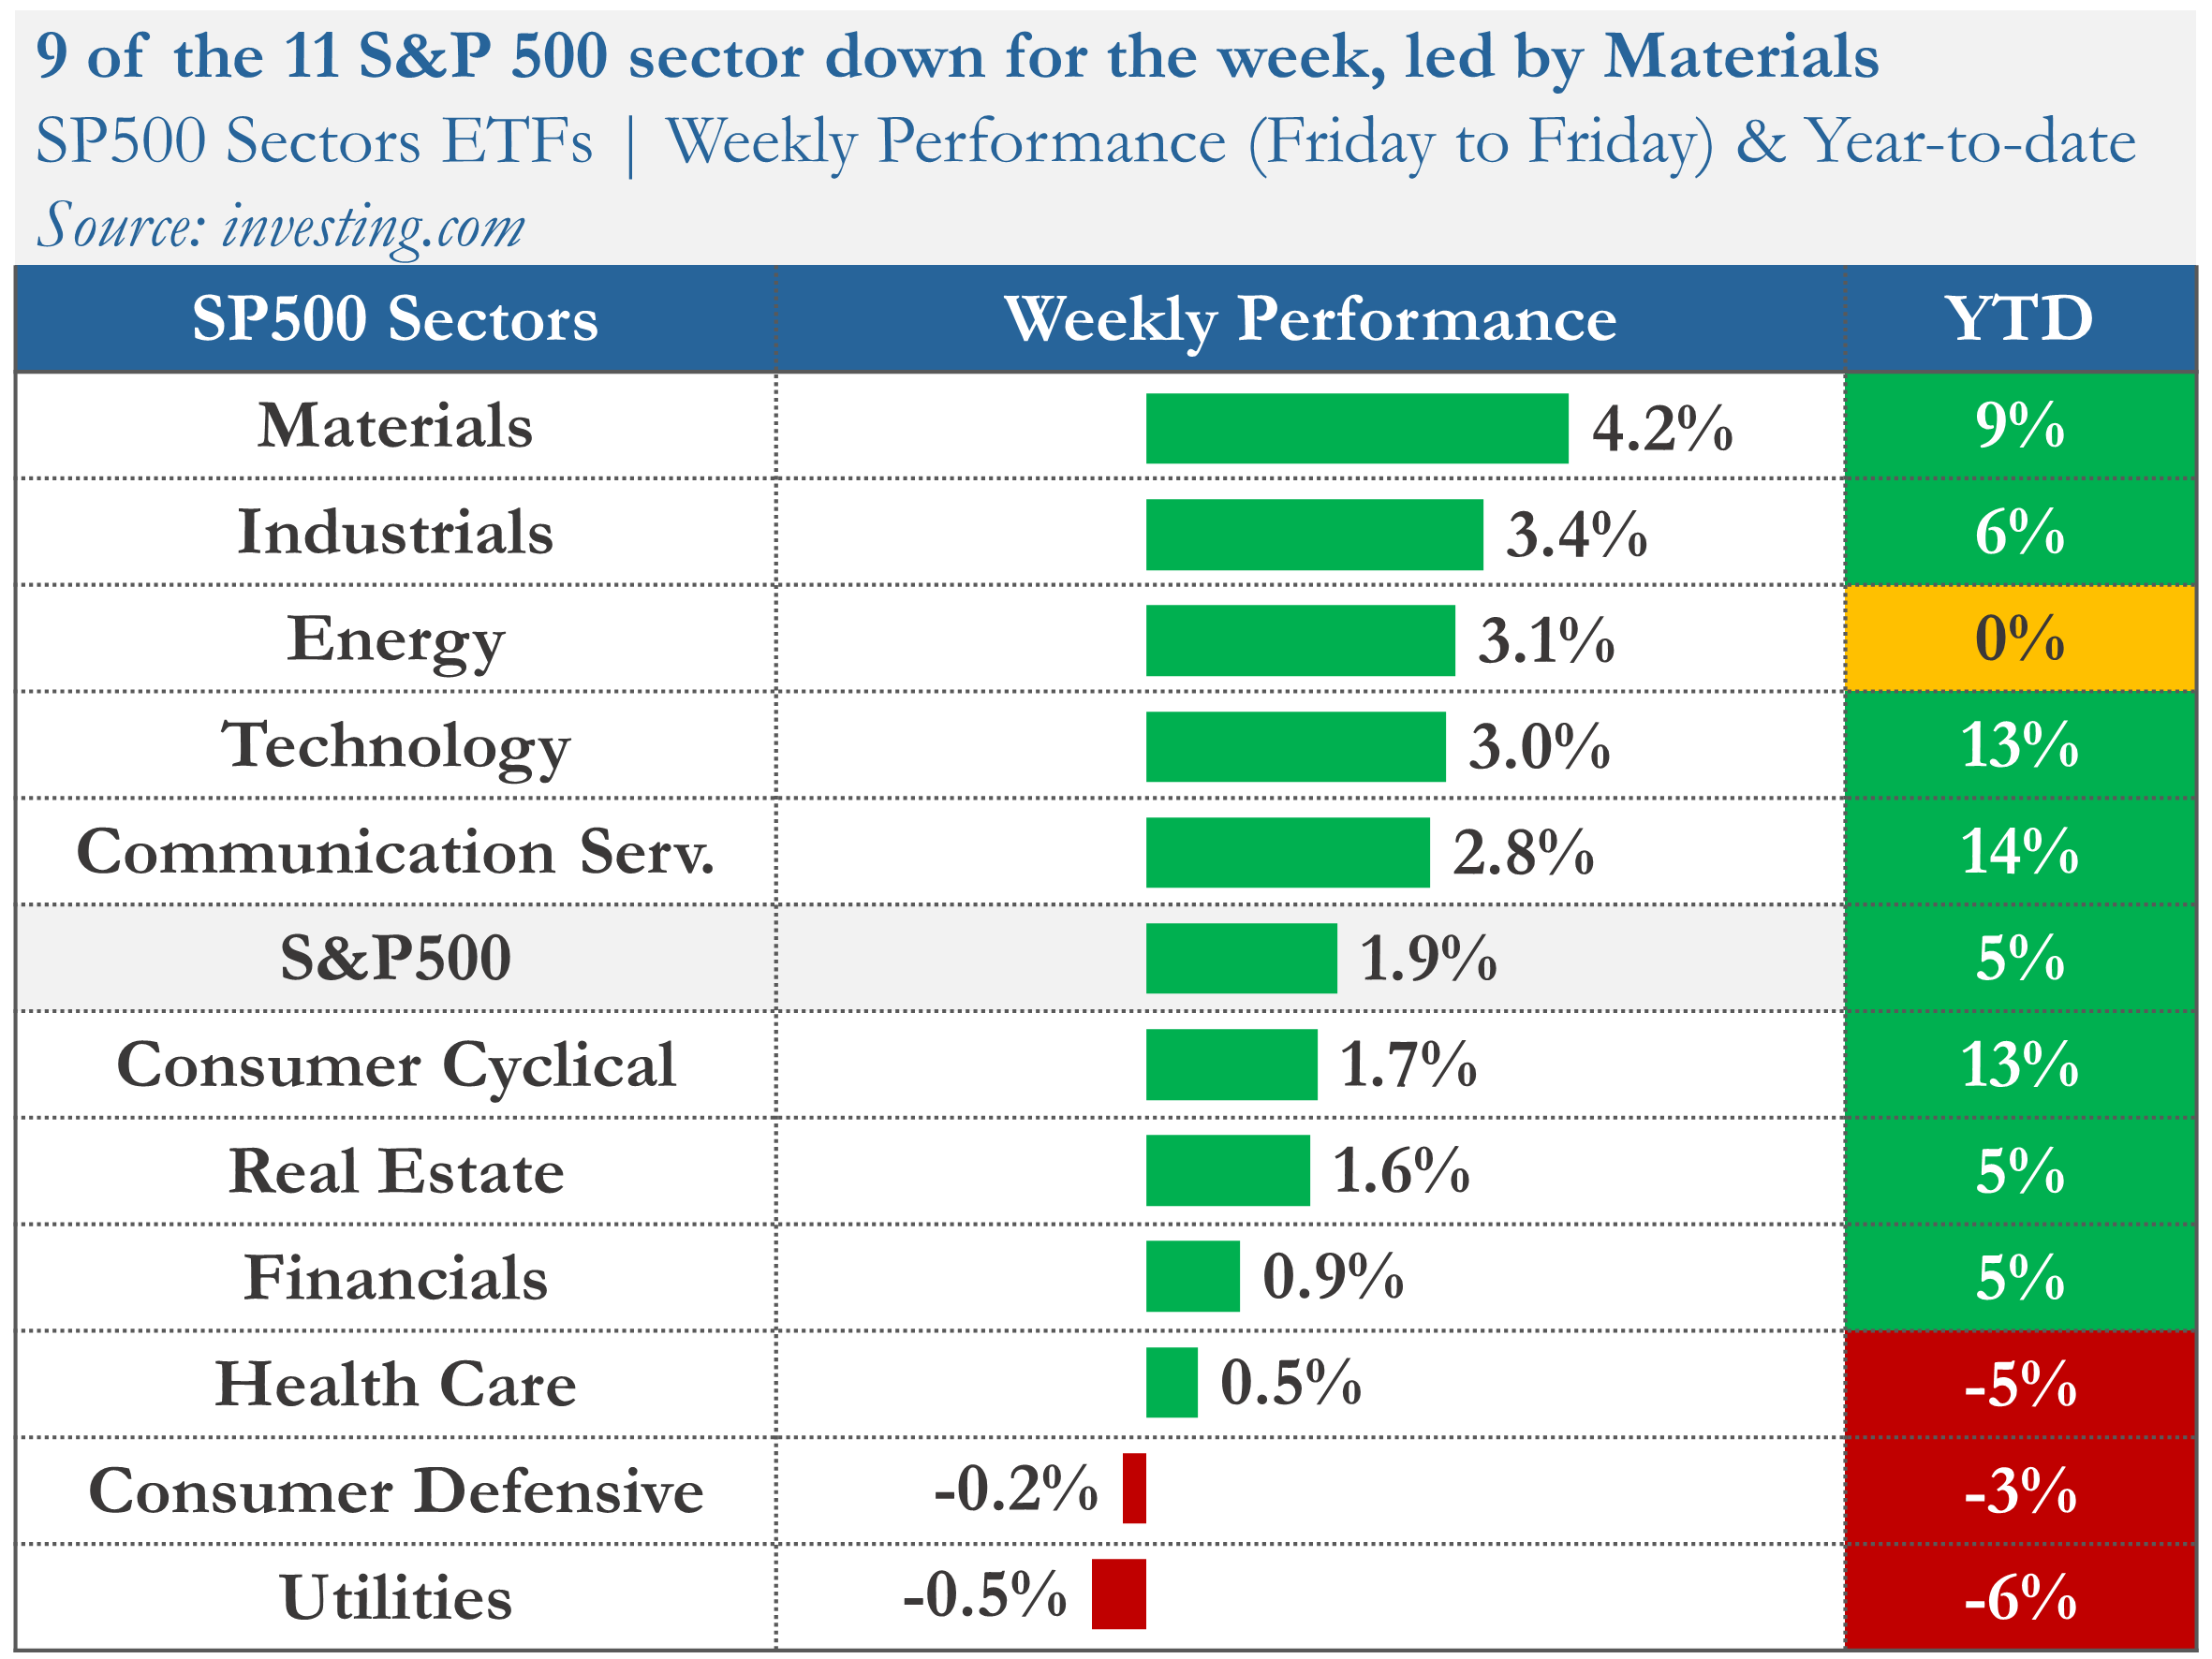
1. SP500 Sector Performance
Over the week, 9 of the 11 S&P 500 sectors had achieved gains. Materials led the way, rising by 4.2%. By contrast, Utilities was the weakest, falling by 0.5%.
Year-to-date, 7 sectors have seen positive results. Communication Services has been the most successful sector, with a 14% gain. On the other hand, Utilities have been trailing behind.
2. S&P 500 Weekly Heat Map
Over the last five trading days, only 67% of the stocks in the S&P 500 index have risen in value.
The best-performing stocks were:
First Solar, Inc. (FSLR, 30%)
Salesforce, Inc. (CRM, 15%)
Steel Dynamics, Inc. (STLD, 15%)
Meanwhile, the worst-performing stocks were:
Lumen Technologies, Inc. (LUMN, -11%)
Universal Health Services, Inc. (UHS, -13%)
DISH Network Corporation (DISH, -15%)

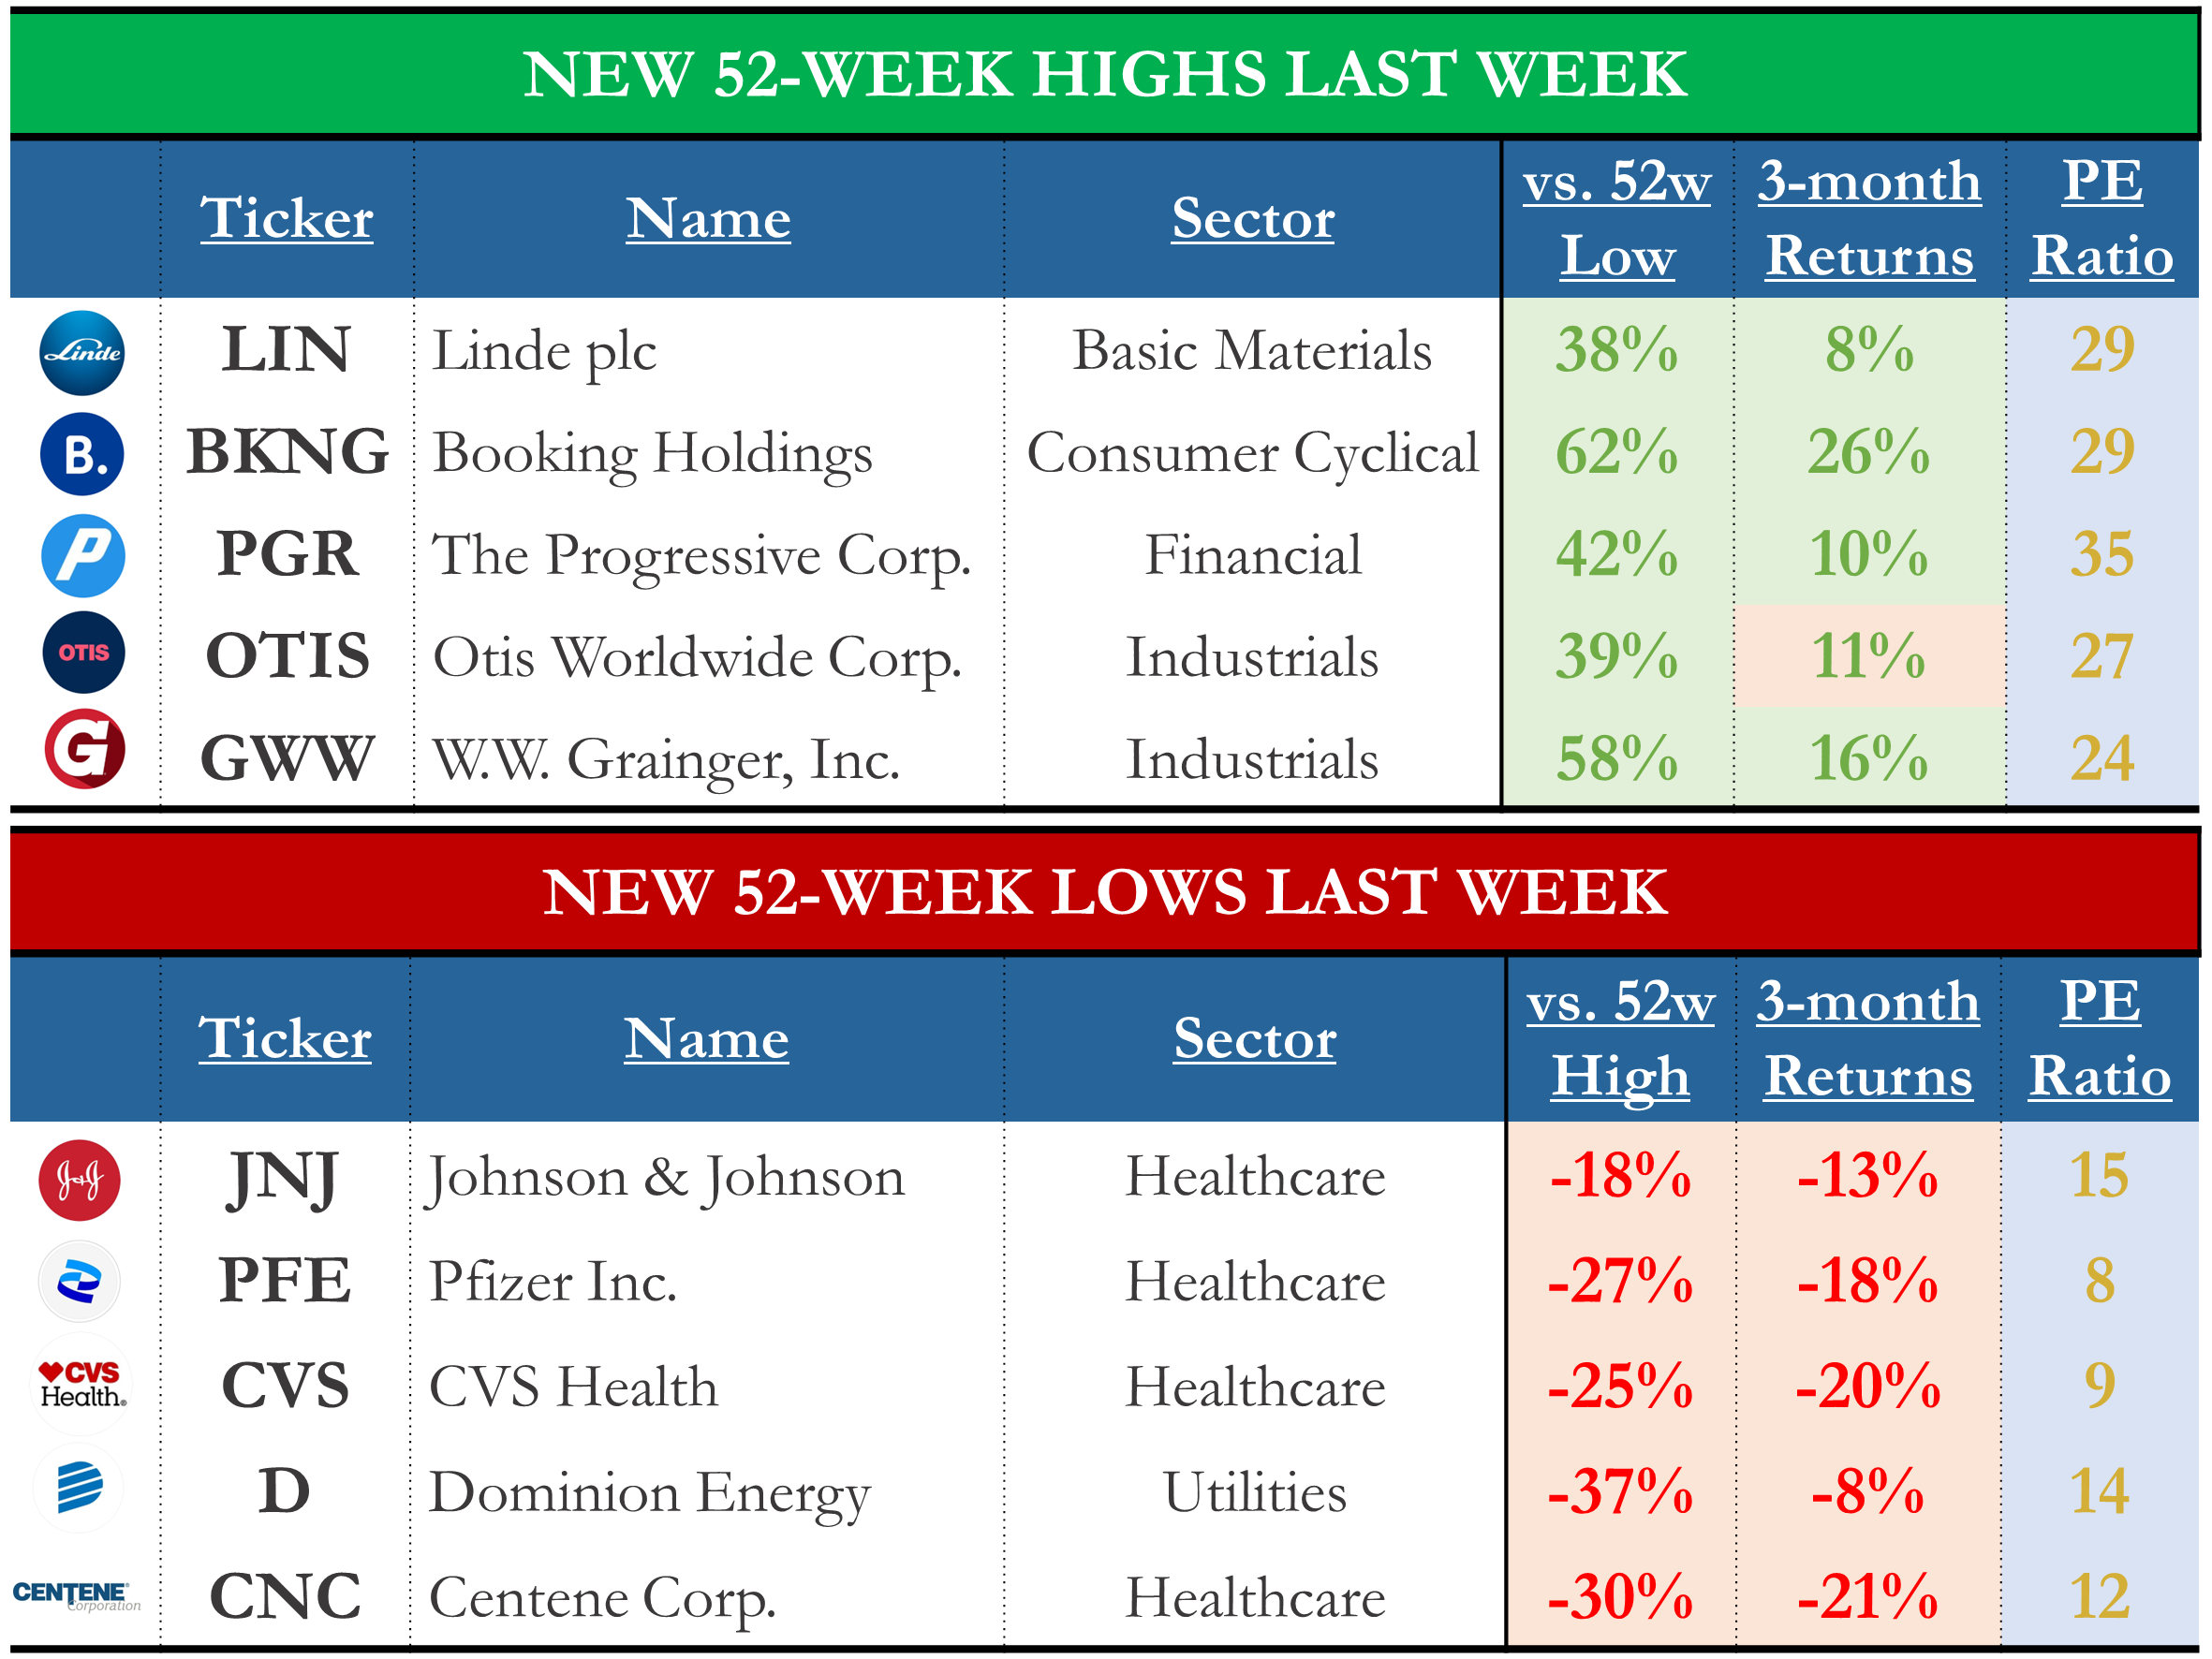
In addition, 17 stocks within the S&P 500 reached a new 52-week low, while 15 set new highs. The momentum continued to slow down this week.
MARKET TRENDS & MOMENTUM
1. S&P 500 Long-Term Trend
The long-term trend for the S&P500 is mixed. I base this evaluation on the weekly chart's 9 and 30 exponential moving averages (EMAs). To determine if the trend is strongly positive, I look for three conditions:
Price is trading above the EMA9 and EMA30: 🟡
EMA9 is above the EMA30: 🟢
Both moving averages are rising: 🟡
I also use MACD as an additional tool to detect trend changes. The MACD is currently higher than its signal line, a positive indication for the index.
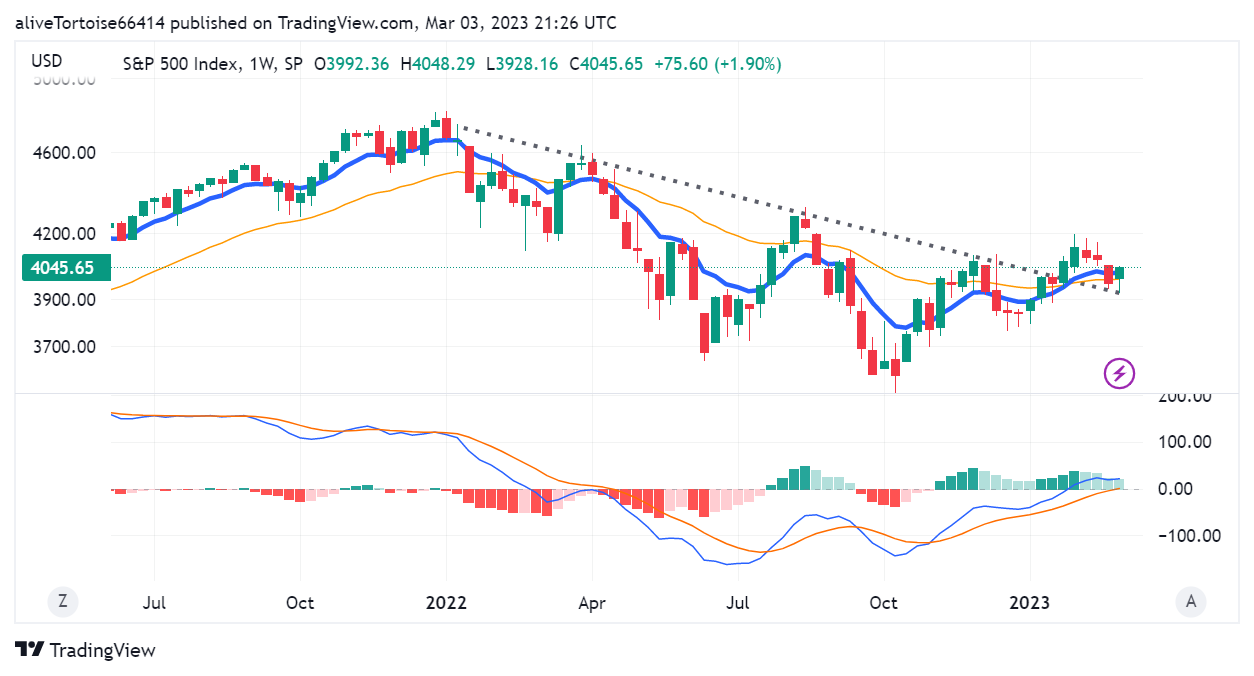
2. Short-term outlook and key levels
The S&P 500 successfully tested the 200-day moving average and recaptured the 4,000 level, sparking a rally on Friday. As I mentioned in last week's recap, I was keeping a close eye on the index's reaction to these levels, and despite the volatility, this was a positive development.
Regarding specific levels to watch, 4,180 (the high in 2023) is the next significant resistance, and the ultimate one is 4,300, which would mark the official start of a new bull market. On the other hand, the 4,000 psychological level and 3,940 (200-day moving average) are crucial support ranges to defend.
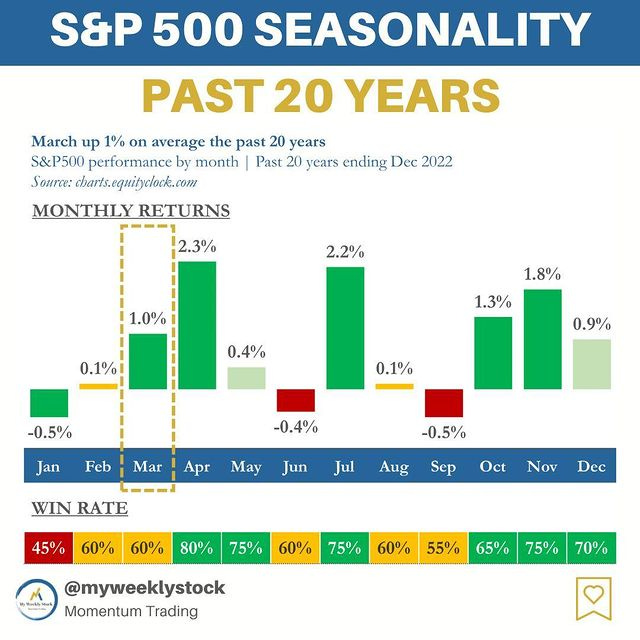
3. Momentum Analysis of the Week
This week's momentum analysis is about seasonality, as we started the month of March. Over the past 20 years, the S&P 500 has been up 1% on average in March, with the month positive 60% of the time.
For daily updates and content on momentum trading, follow me on Instagram.
EARNINGS RECAP
1. Earnings Season Summary
99% of the S&P 500 have released their Q4 2022 earnings, with 68% posting higher EPS than expectations. However, this is lower than the previous four-quarter average of 73%.
2. Expected EPS & Revenue Growth
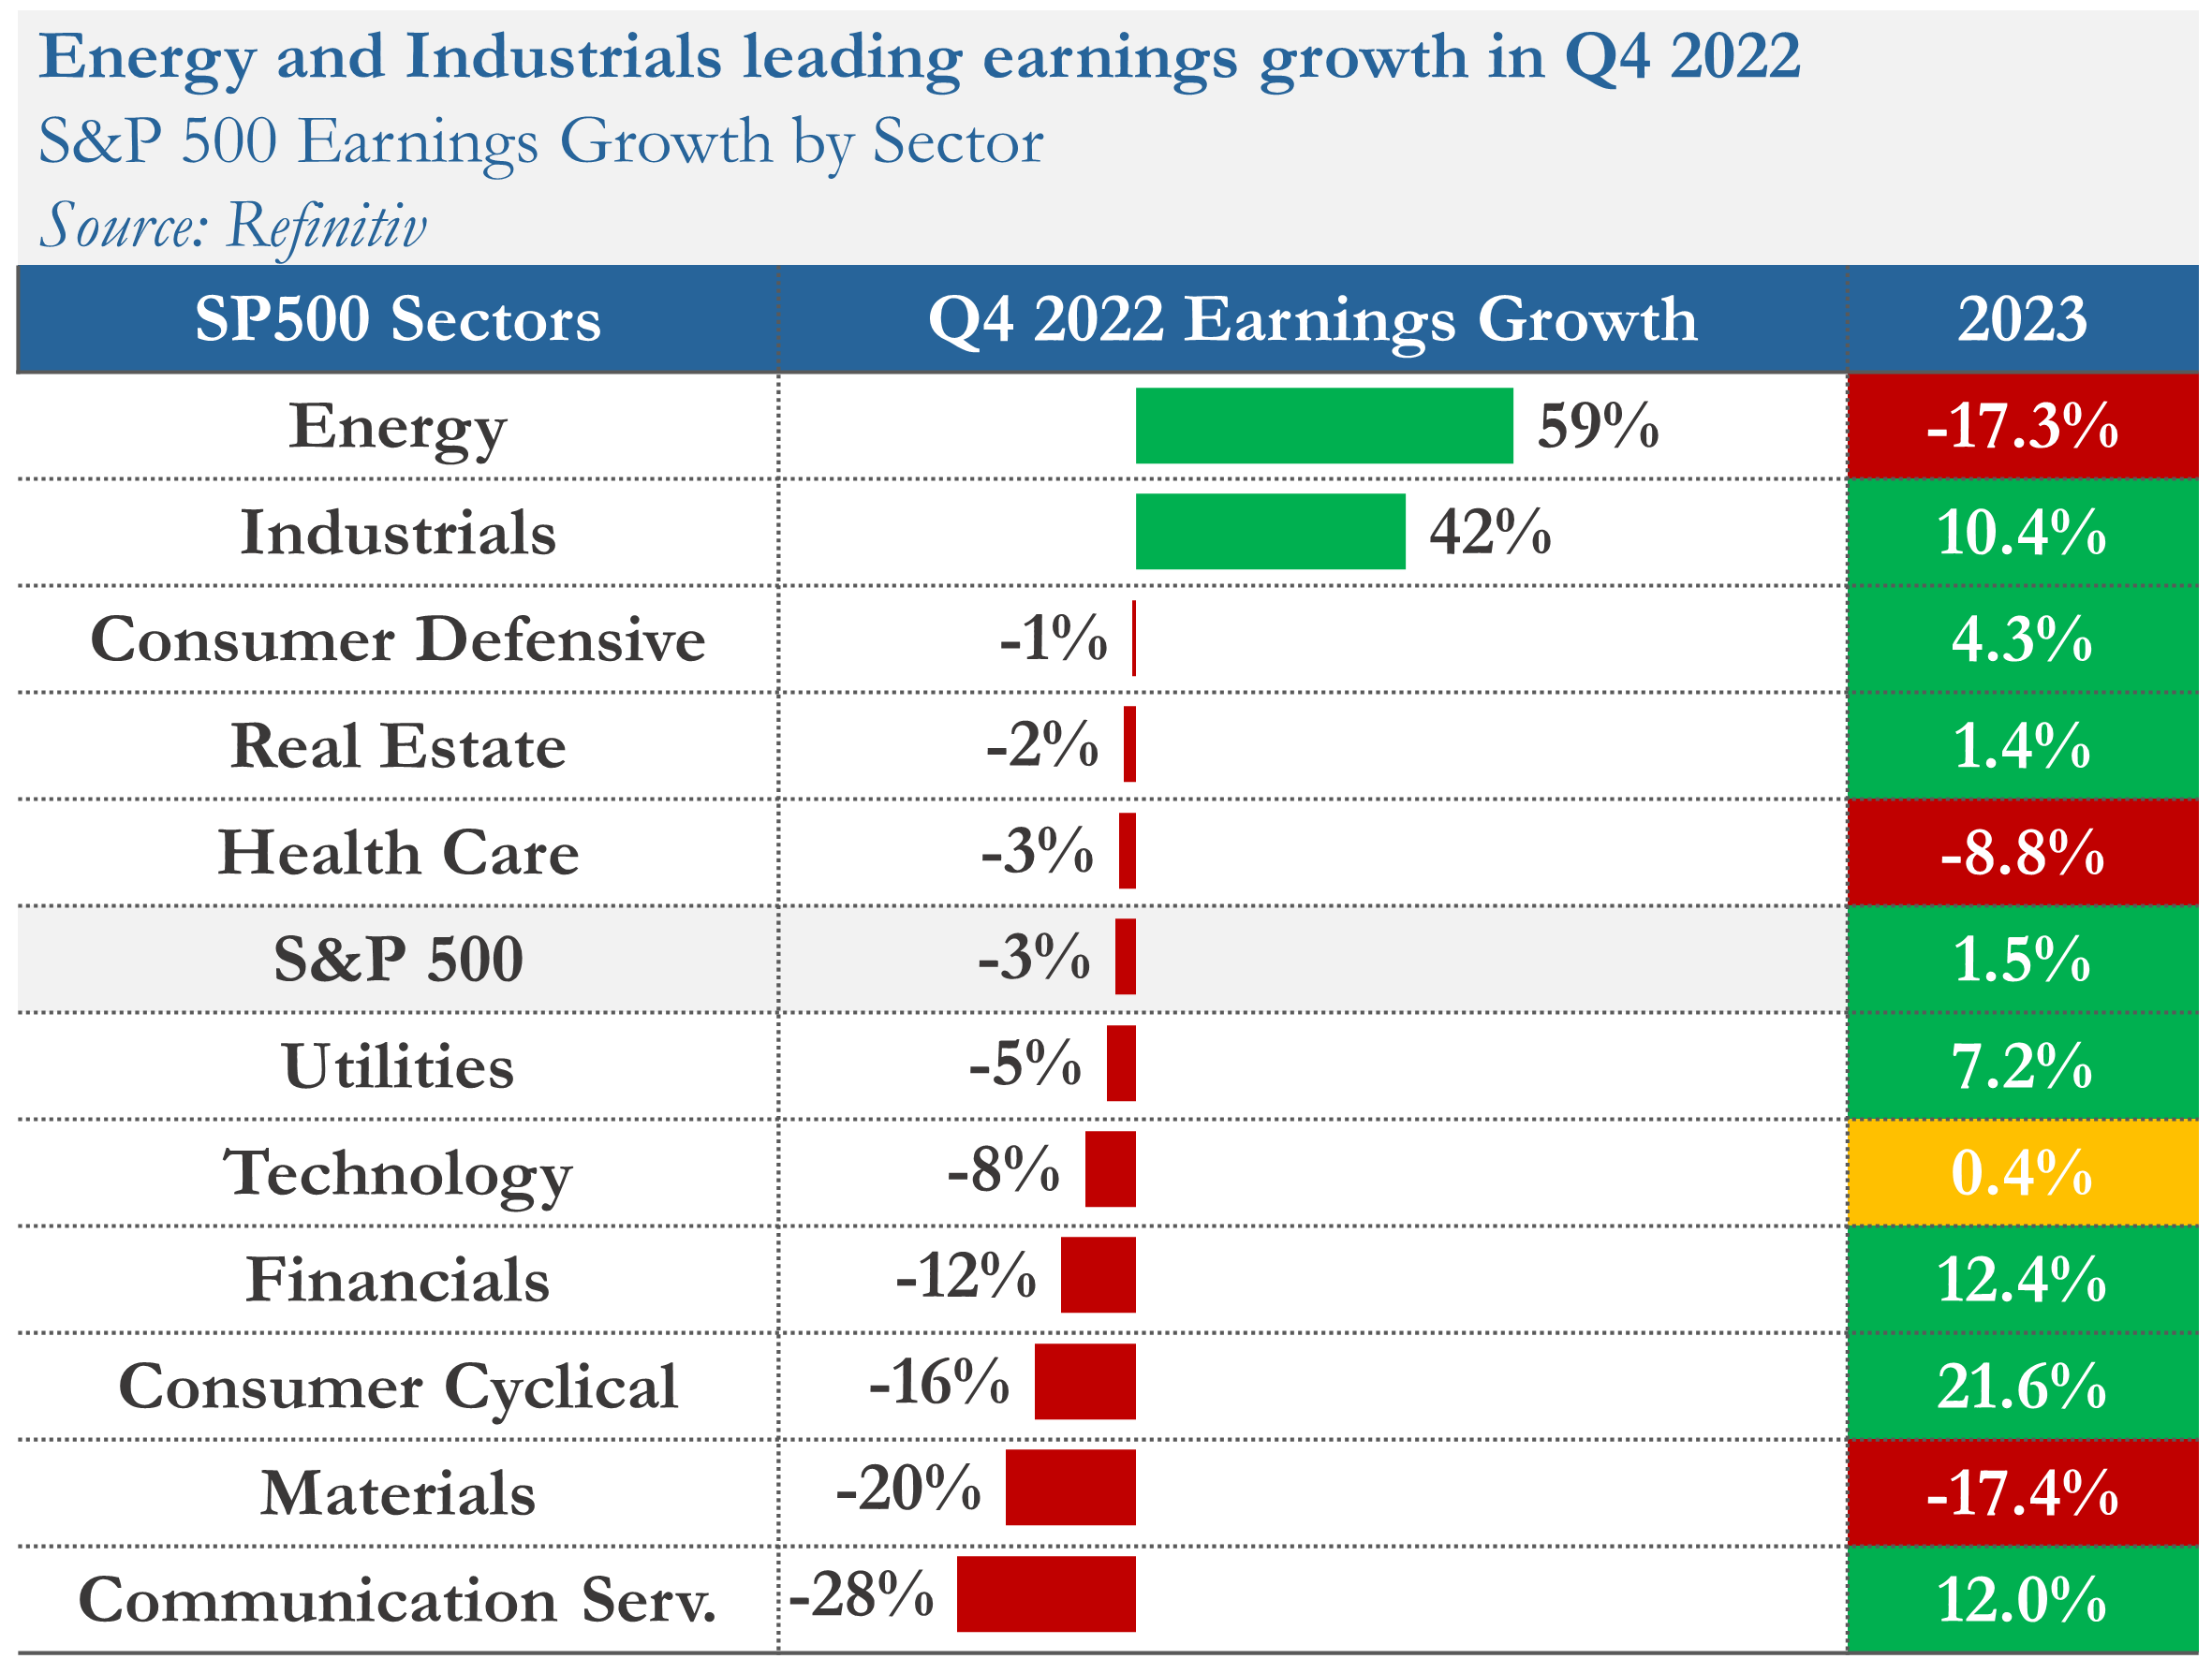
Analysts predict that earnings for the S&P 500 will decline by 3% in Q4 2022. Excluding the energy sector, the figure falls to -7%.
The earnings growth rate for 2023 is projected at +2%, lower than the 9% average seen over the last decade. Earnings are expected to increase year-over-year in 8 of the 11 sectors, with the Consumer Cyclical and Financials sectors leading the way. On the other hand, the Energy and Materials sectors are projected to see the worst decline.
MARKET SENTIMENT
Measures of investor sentiment can be helpful as they provide insight into the views and opinions of professional or individual investors. However, it's important to note that these measures are not perfect predictors of market movements. They should be combined with other indicators and analysis tools to get a complete market picture.
1. Individual Investors (AAII)
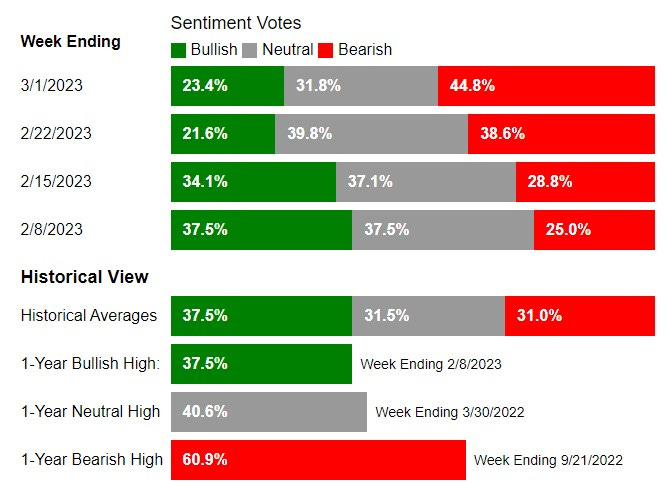
The American Association of Individual Investors (AAII) conducts a weekly survey among its members to gauge their expectations for the stock market over the next six months. The results of the survey are published every Wednesday.
According to the most recent AAII survey, 23% of the respondents had a bullish outlook on the stock market, a 1-point increase from the previous week. The investors' bullish sentiment remains unusually low as per historical levels.
2. Institutional Investors (BofA Bull & Bear Indicator)
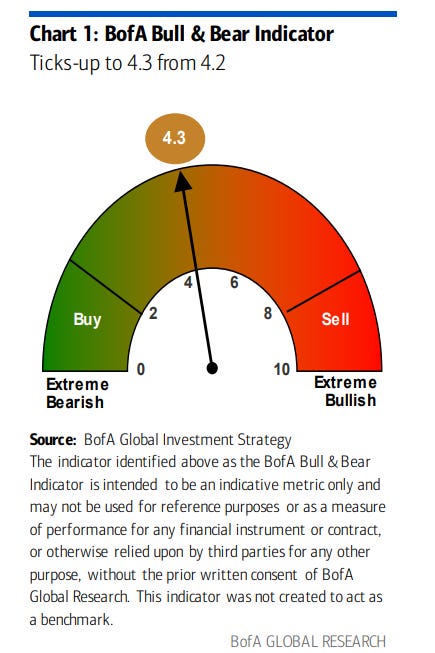
The Bank of America Bull-Bear Indicator is a proprietary measure of investor sentiment developed by Bank of America. It is based on a survey of fund managers and institutional investors, and it tracks the percentage of respondents who are bullish, bearish, or neutral on the stock market. Results are published in the form of a score ranging from 0 (extremely bearish) to 10 (extremely bullish)
The indicator rose from 4.2 to 4.3 and continues to show an improvement in sentiment among professional investors.
THE WEEK AHEAD
1. Economic Calendar
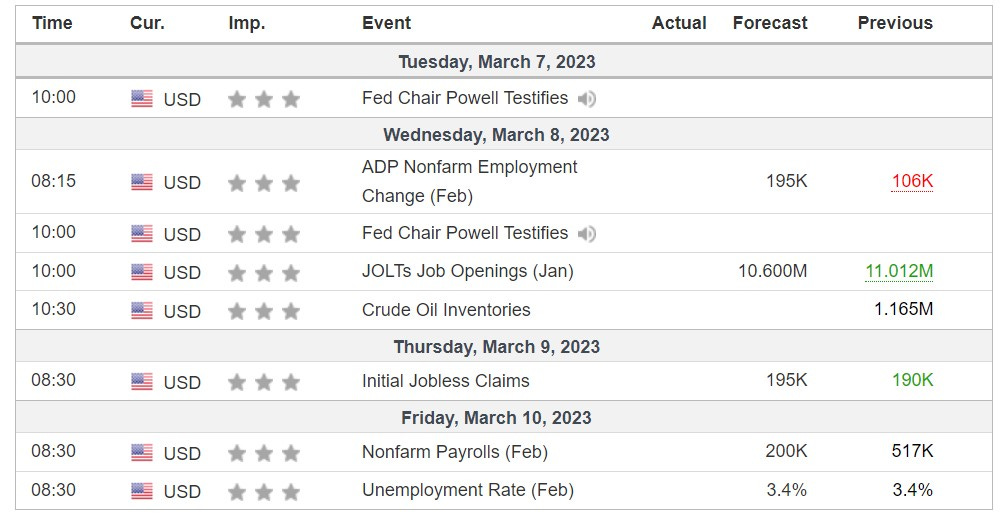
The upcoming week will center around the job market, with the release of the non-farm payroll report for February, for which economists predict the addition of 200,000 new jobs. Additionally, the Federal Reserve will be in the spotlight as its chairman, Jerome Powell, is scheduled to testify in front of Congress on Monday and Tuesday.
2. Earnings Calendar
4 companies from the S&P 500, including Oracle, Ulta Beauty, and Campbell Soup, are set to report their quarterly earnings next week.
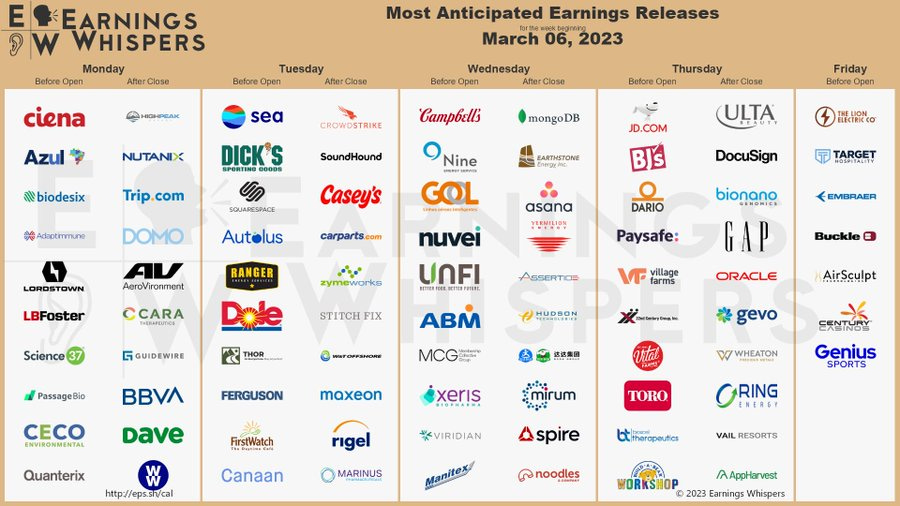
3. Next Week’s Earnings Watchlist

Thank you for reading my weekly market recap! I hope you found it helpful in understanding the stock markets better. If you did, please share this post with your friends and followers.
If you have any questions or feedback, please don't hesitate to reach out by email or in the comment section. Your support helps me to continue creating high-quality content and is greatly appreciated!
Have a great week!
My Weekly Stock
DISCLAIMER
The information provided in this newsletter is for informational purposes only and should not be taken as financial advice. Any investments or decisions made based on the information provided in this newsletter are the reader's sole responsibility. We recommend that readers conduct their own research and consult a qualified financial professional before making investment decisions. The author does not assume any responsibility for any losses or damages arising from using the information provided in this newsletter.
First time reader. Great sharing. 👍