

Weekly Market Recap (Jan 1-5): The Bears Are Back In Town!
Weekly Market Recap (Jan 1-5): The Bears Are Back In Town!
Everything you need to know about last week's markets performance and what to expect next
Dear subscribers,
Welcome to my weekly market recap!
First, let me wish you all a Happy New Year! I'm thrilled to be back after a well-rested break and equally excited to roll out new features and analysis. I can't wait to hear what you think!
Markets can be noisy and overwhelming, but I'm here to help you succeed. Every week, I spend hours curating and producing powerful analyses with clear visuals and a structured layout so you can easily find what you need, week after week. While I cater to all investing styles, most of my research is done through a momentum lens and focuses heavily on price action.
It's easy to get swayed by personal bias, so I like to let the data do the talking and encourage you to form your own opinions. If you appreciate this straightforward approach and want more in-depth insights or are curious about my short and long-term investing strategies, check out the paid section of this newsletter. Until the end of January, you can enjoy a whopping 50% discount for your 1st year of subscription! Don't miss out on this opportunity!
I hope you enjoy this week's edition and find it helpful. So, thank you for joining us, and let's get started!
SUMMARY
Here are this week's highlights and what to look out for next:
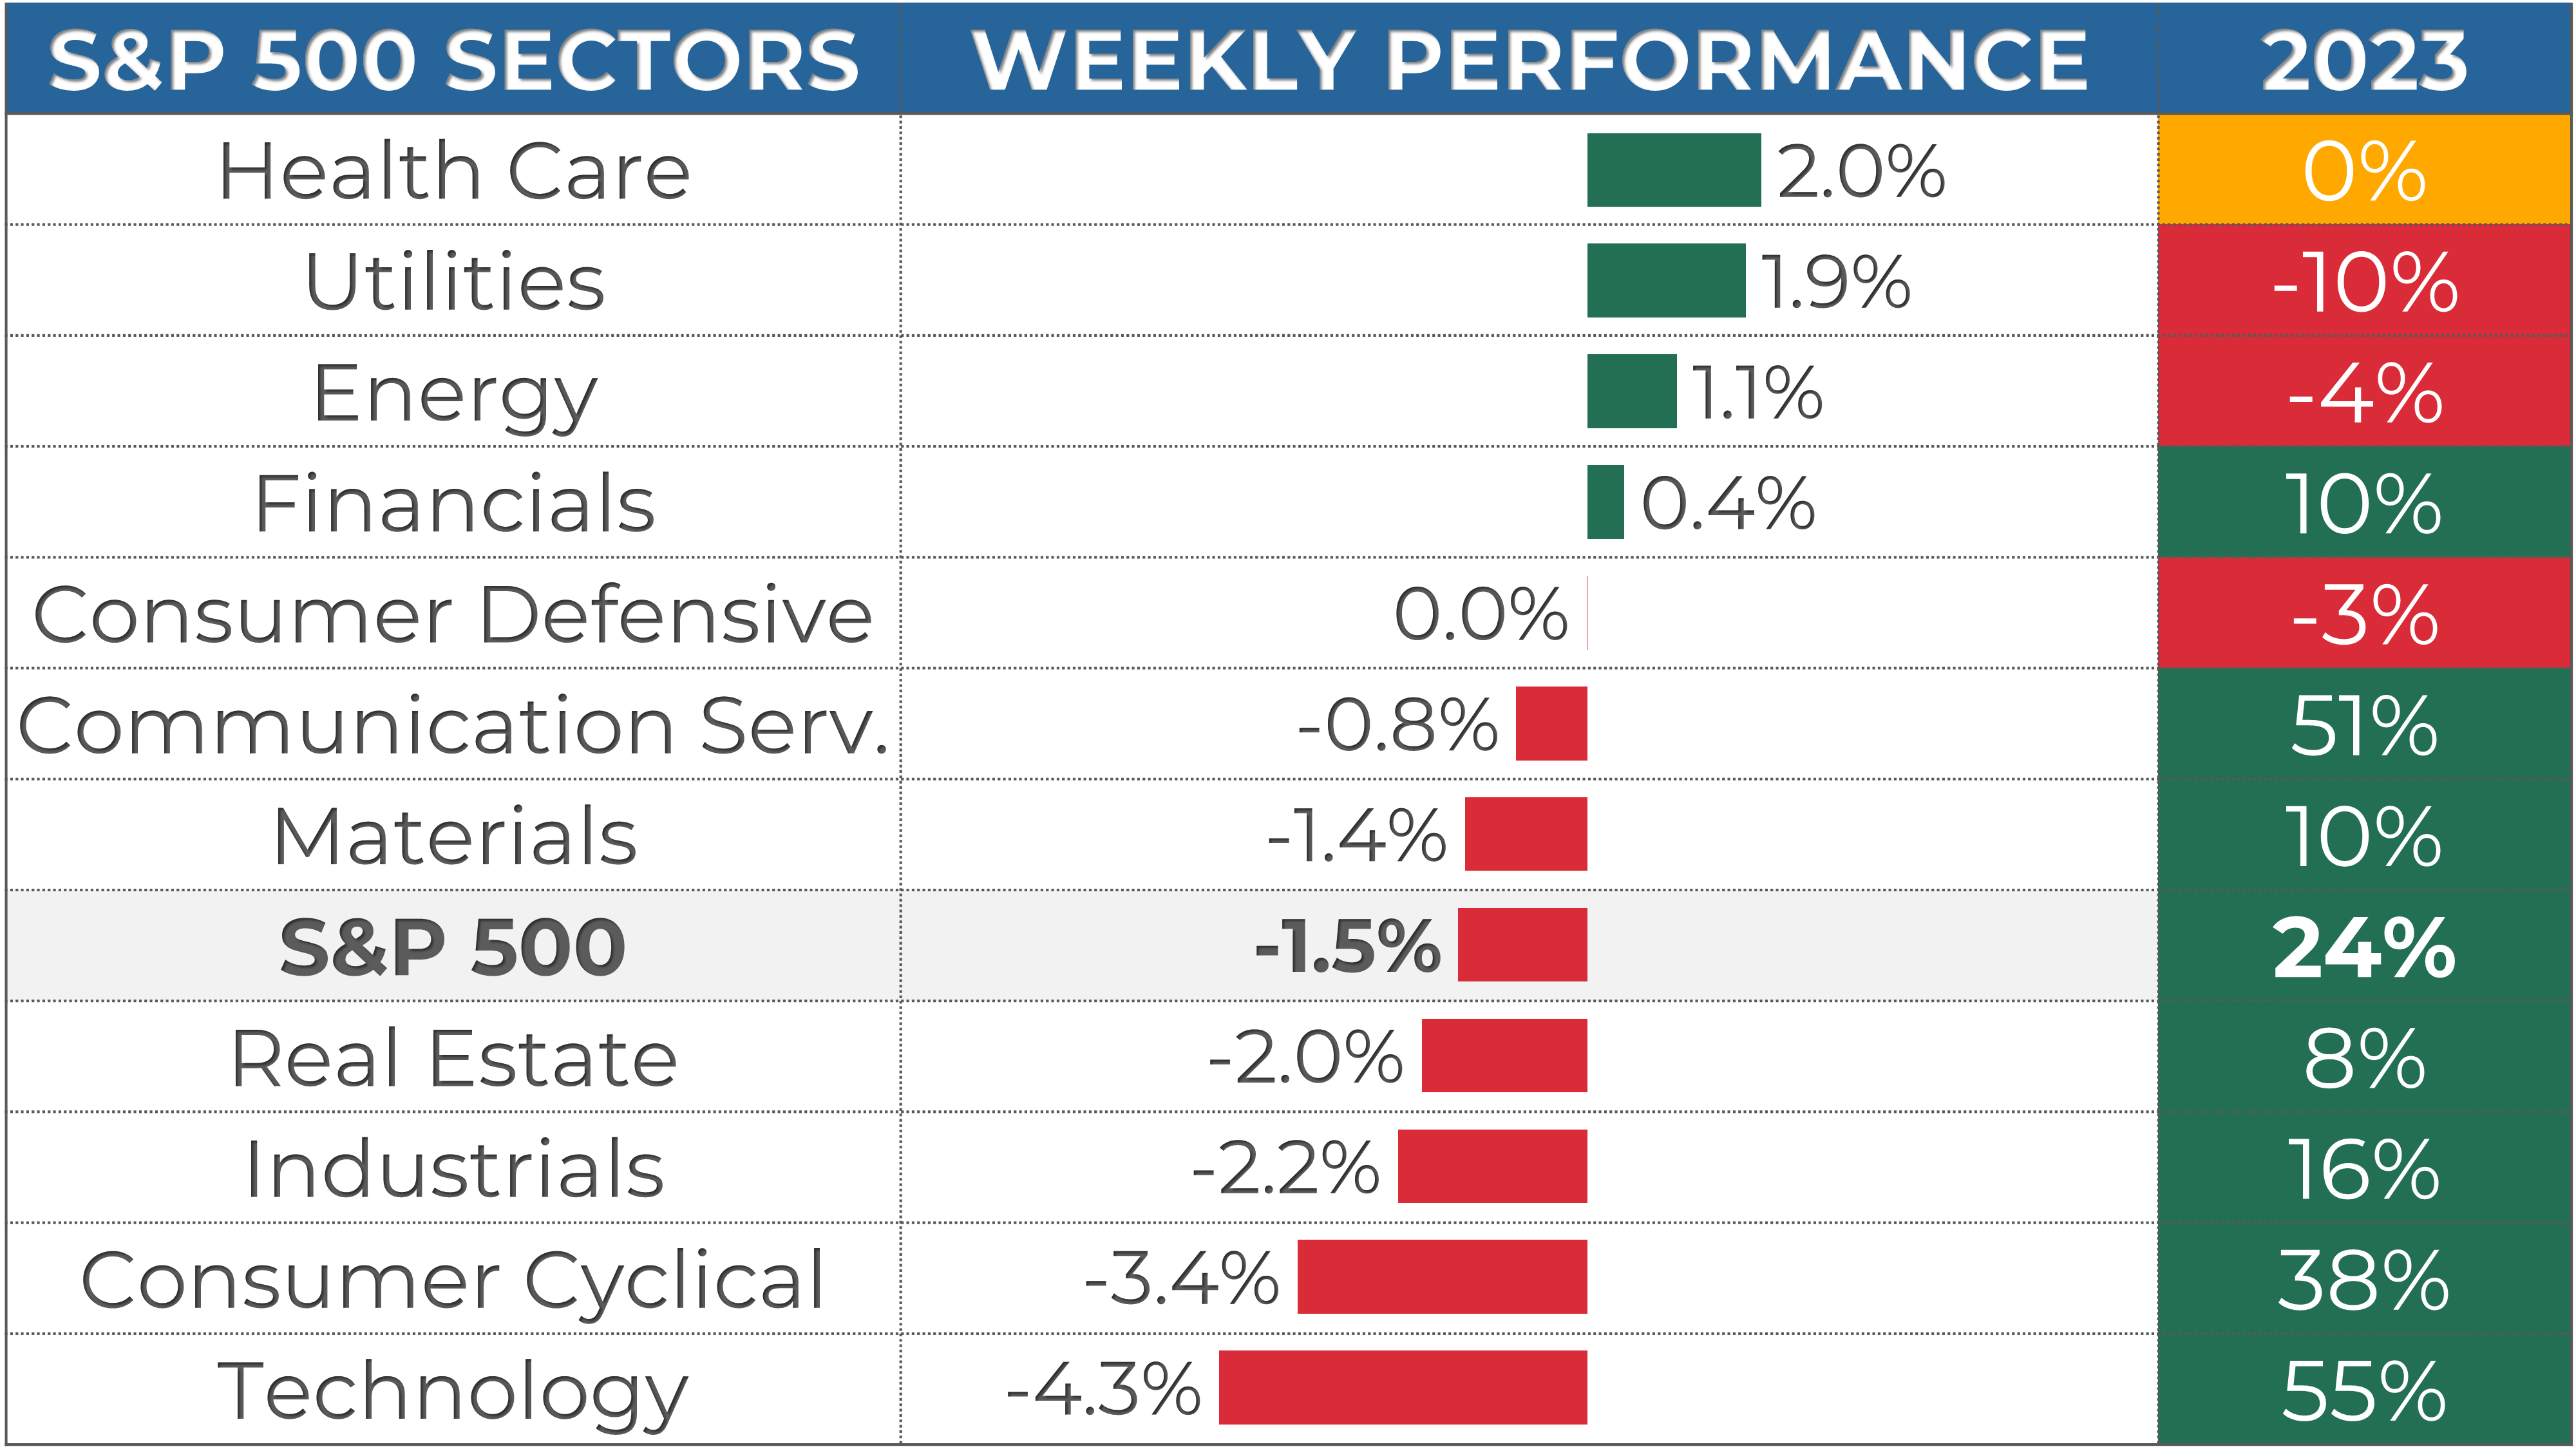
1. The markets were down for the week, with the S&P 500 down 1.5%, the Nasdaq 3.3%, and the Dow Jones 0.6%. Health Care (+2.0%) and Utilities (+1.9%) were the best-performing sectors.
2. The long-term trend for the S&P 500 is positive, and the short-term trend has turned bearish. The next resistance is at 4,800, while support is at 4,600.
3. The earnings season will start next week. Earnings are expected to be up 5% in Q4 2023 and 11% in 2024.
4. Market sentiment is positive, as measured by the Fear & Greed indicator, while VIX is at 13, increasing 7% this week.
5. Earnings reports from UnitedHealth and JP Morgan and the Consumer Price Index report are scheduled for next week.
My take:
The market finally snapped its 9-week winning streak. We also saw a rotation as most of 2023's top performers had a lackluster start to the year. In that regard, Apple ended the week down 6% following two analyst downgrades.
The short-term trend has taken a bearish turn, and I wouldn't be surprised if we see more weakness. However, as long as we maintain above the 4,600 mark, this is, in my view, a healthy pullback in our journey toward new all-time highs.
Looking at the bigger picture, I expect 2 outcomes for the year: i) the S&P 500 will set a new all-time high, potentially breaking 5,000, and ii) we will experience a correction of 10% or more. Predicting which will occur first or by when is less important than being prepared to adapt when they do!

Sponsor
This week’s edition is brought to you by TradingView

Discover TradingView, the charting and social networking tool for investors. TradingView has been instrumental in crafting the detailed analysis and picks featured in my newsletter. It is my go-to platform for:
Stock Charting
Indicator-based trading signal & alerts.
Fundamental and technical data.
Join TradingView today to elevate your trading game by using the link below:
PERFORMANCE RECAP
1. SP500 Sector Performance
Over the week, 4 of the 11 S&P 500 sectors have achieved gains. Health Care led the way and rose by 2.9%. By contrast, Technology was the weakest and fell by 4.3%.
In the previous year, 7 sectors have seen positive results. Technology has been the most successful sector, with a 55% gain. On the other hand, Utilities has been trailing behind.
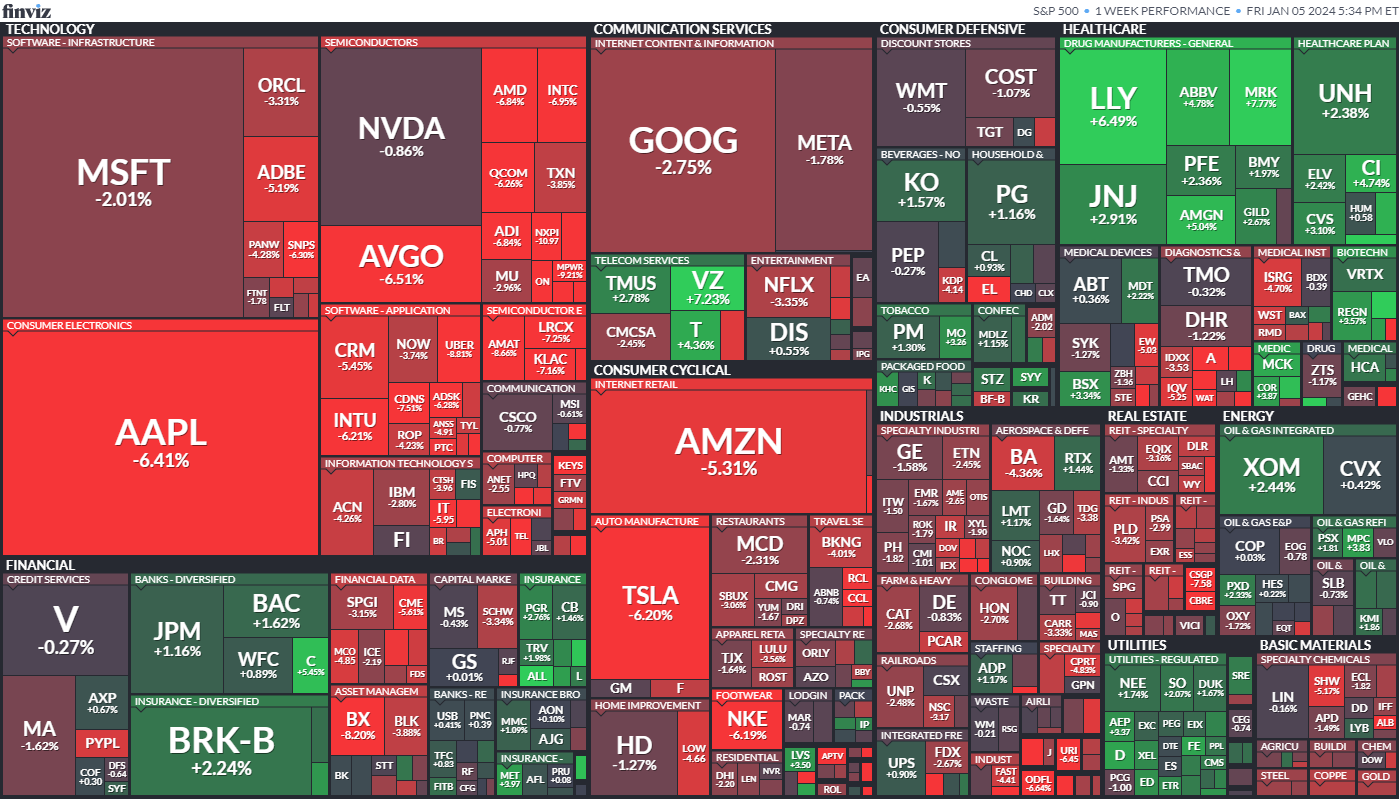
2. S&P 500 Top & Worst Performers
Last week, 32% of the stocks in the S&P 500 index have risen in value.
The best-performing stocks were:
Moderna Inc (MRNA, 12%)
Viatris Inc (VTRS, 10%)
Merck & Co Inc (MRK, 8%)
Meanwhile, the worst-performing stocks were:
VF Corp. (VFC, -11%)
Norwegian Cruise Line Holdings Ltd (NCLH, -13%)
Enphase Energy Inc (ENPH, -14%)
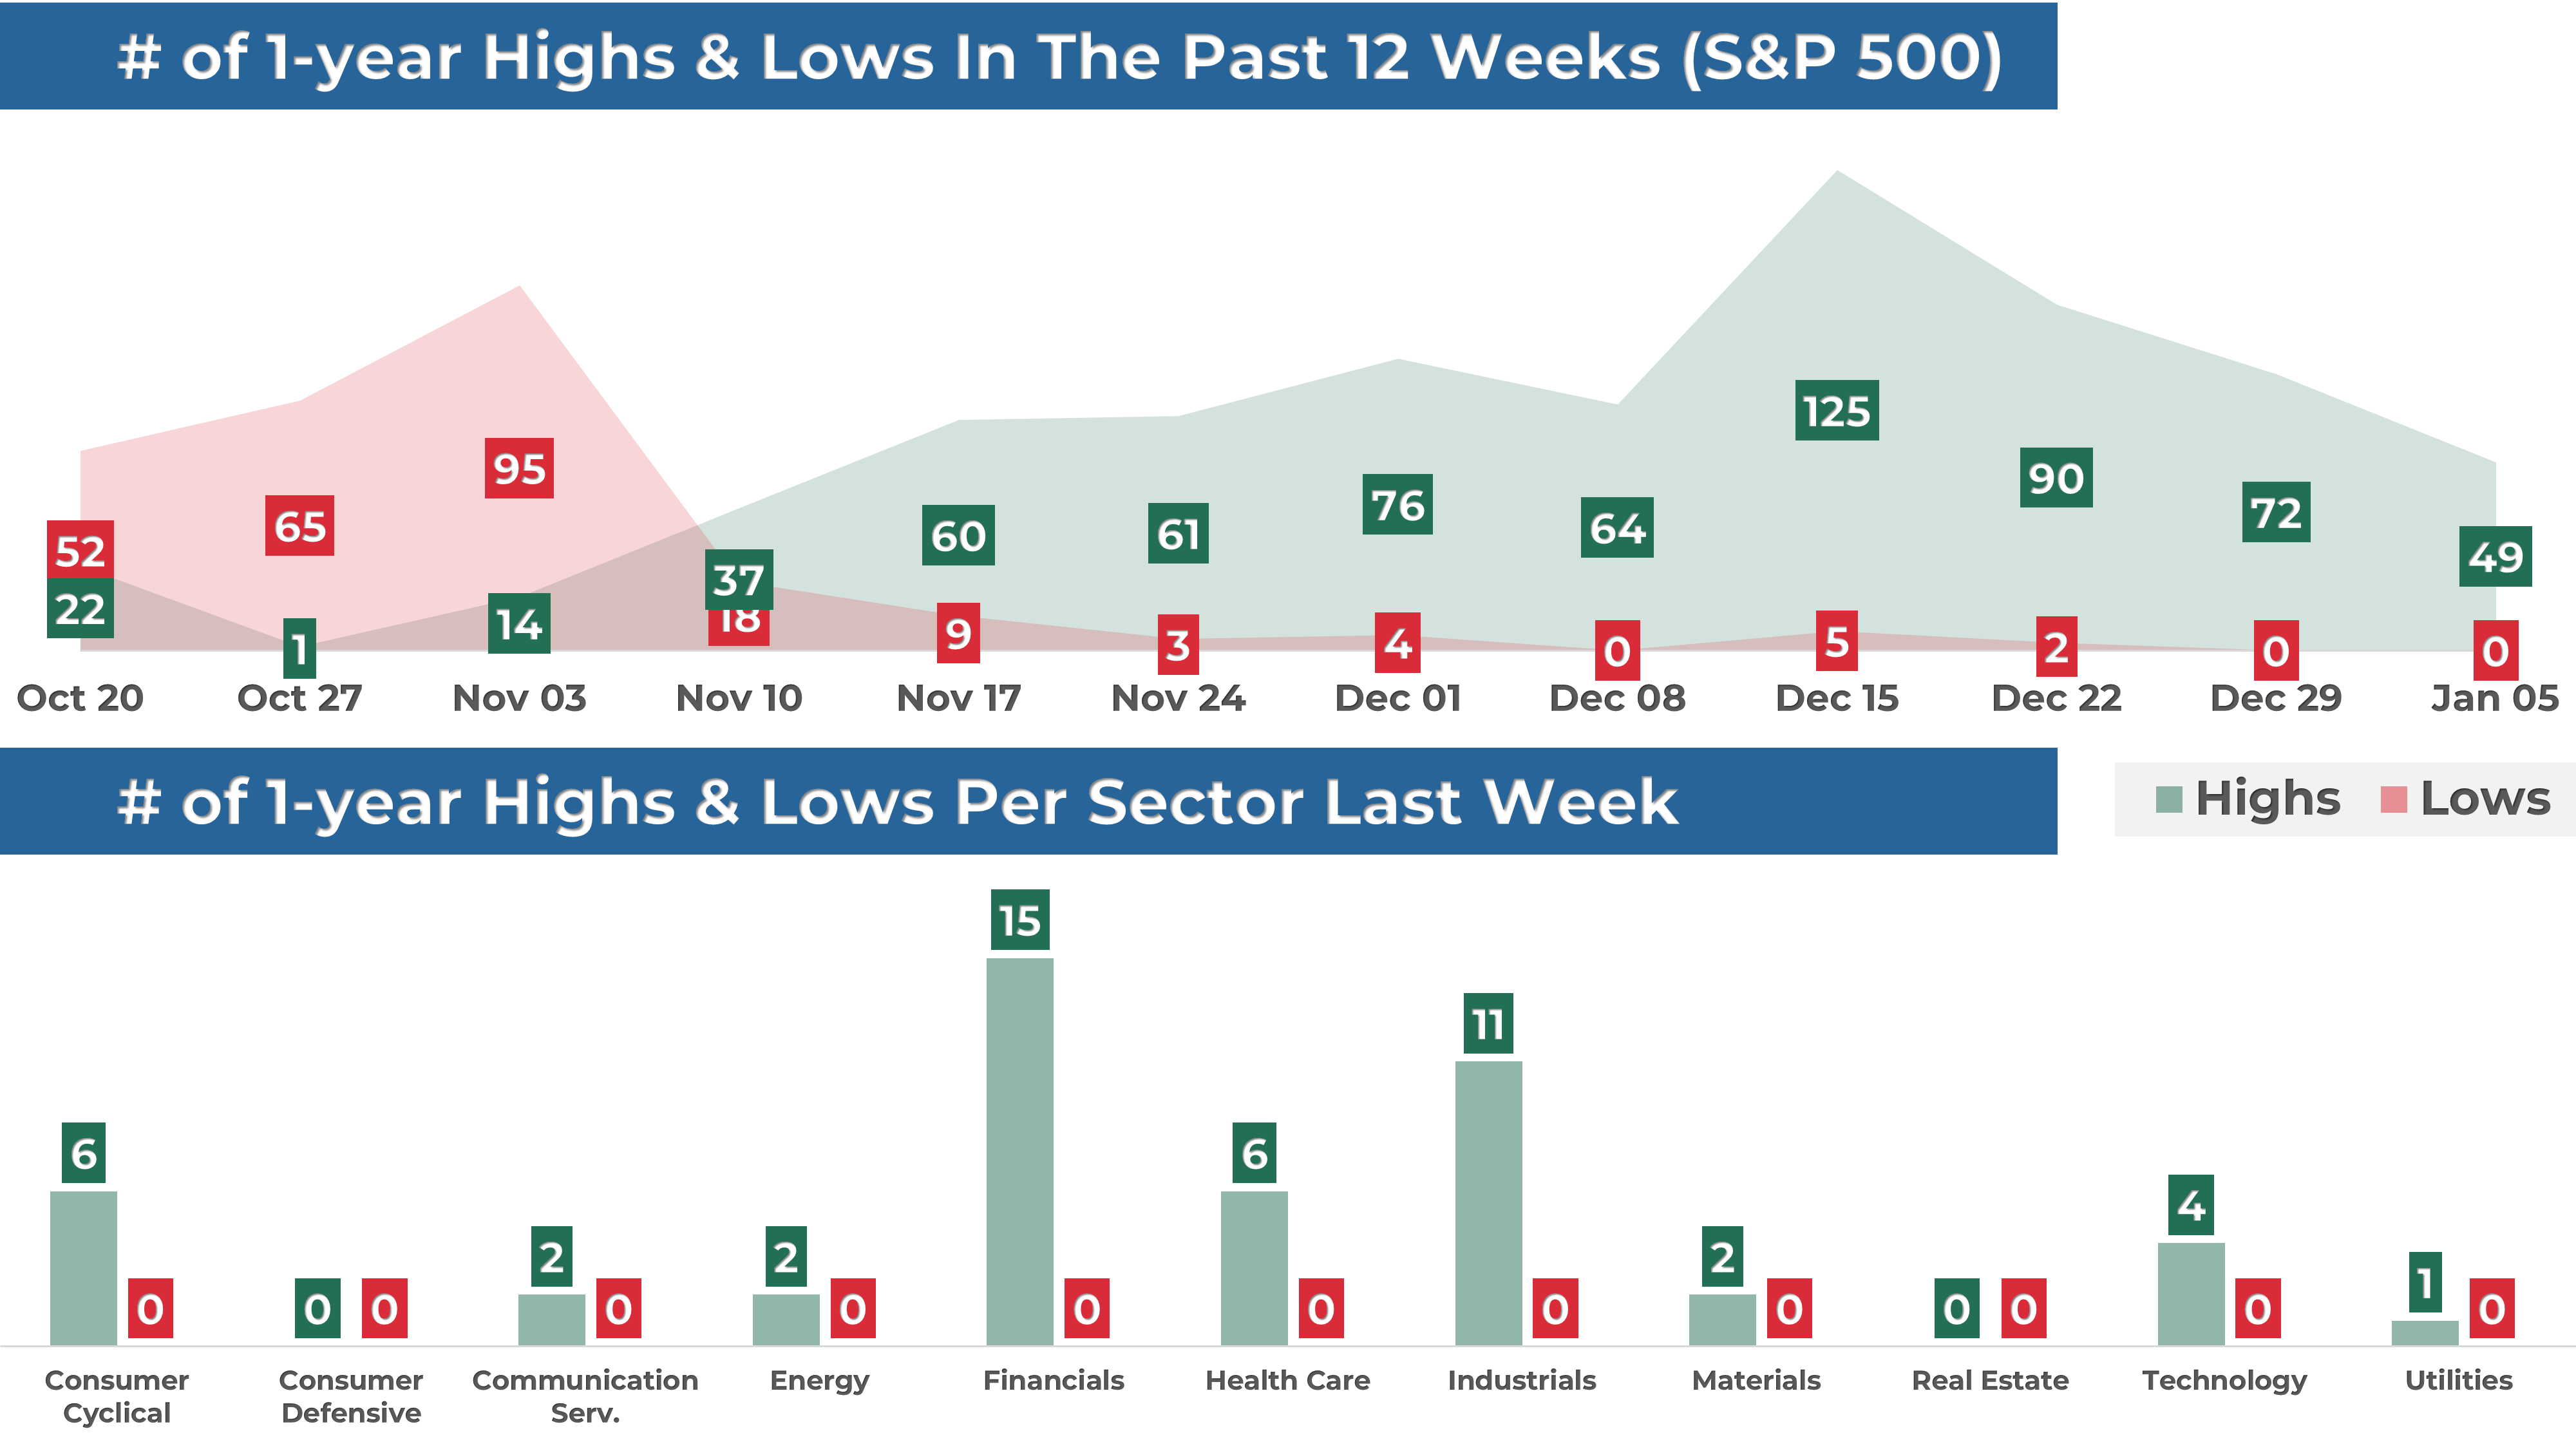
In addition, 49 stocks within the S&P 500 reached a new 52-week high, while none set new lows, indicating the momentum, while slowing down, remains to the upside.
The Financial sector has seen the most new highs this week.
MARKET TRENDS & MOMENTUM
1. S&P 500 Long-Term Trend
The long-term trend for the S&P 500 is positive. I base this evaluation on the weekly chart's 9 and 30 exponential moving averages (EMAs). To determine if the trend is strongly positive, I look for the following conditions (the 1st is the most important):
EMA9 is above the EMA30: 🟢
Price is trading above the EMA9: 🟢
Price is trading above the EMA30: 🟢
EMA9 is rising: 🟢
EMA30 is rising: 🟢
I also use MACD as an additional tool to detect trend changes. The MACD is above its signal line, signaling potentially more gains ahead.
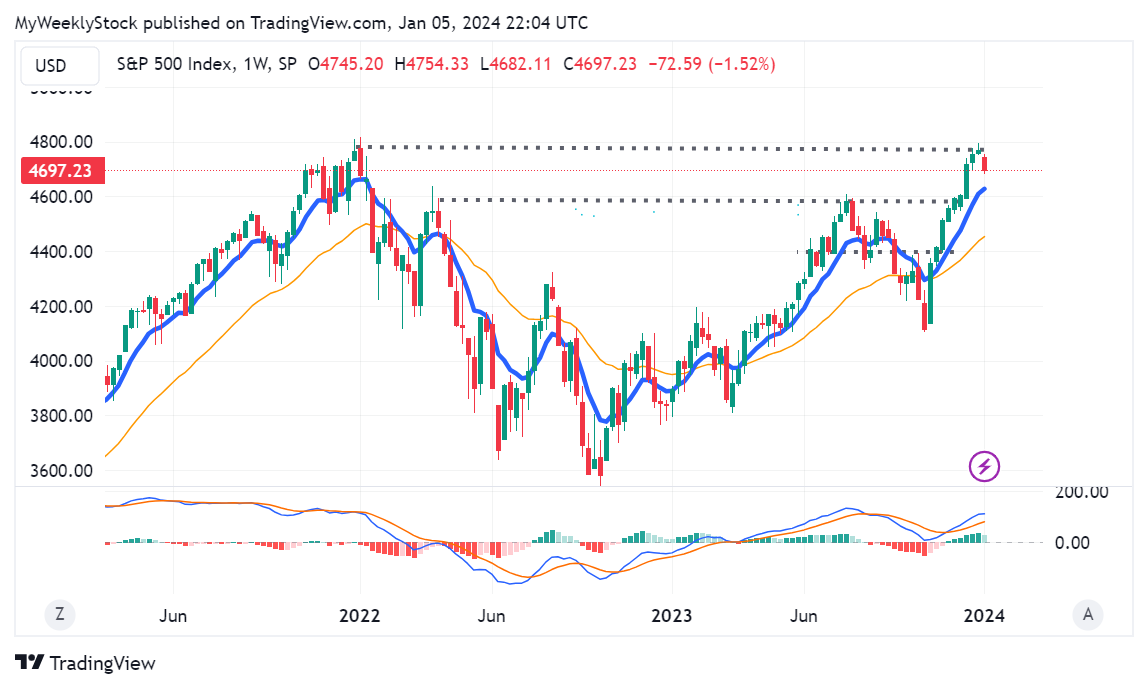
2. S&P 500 Technical Analysis
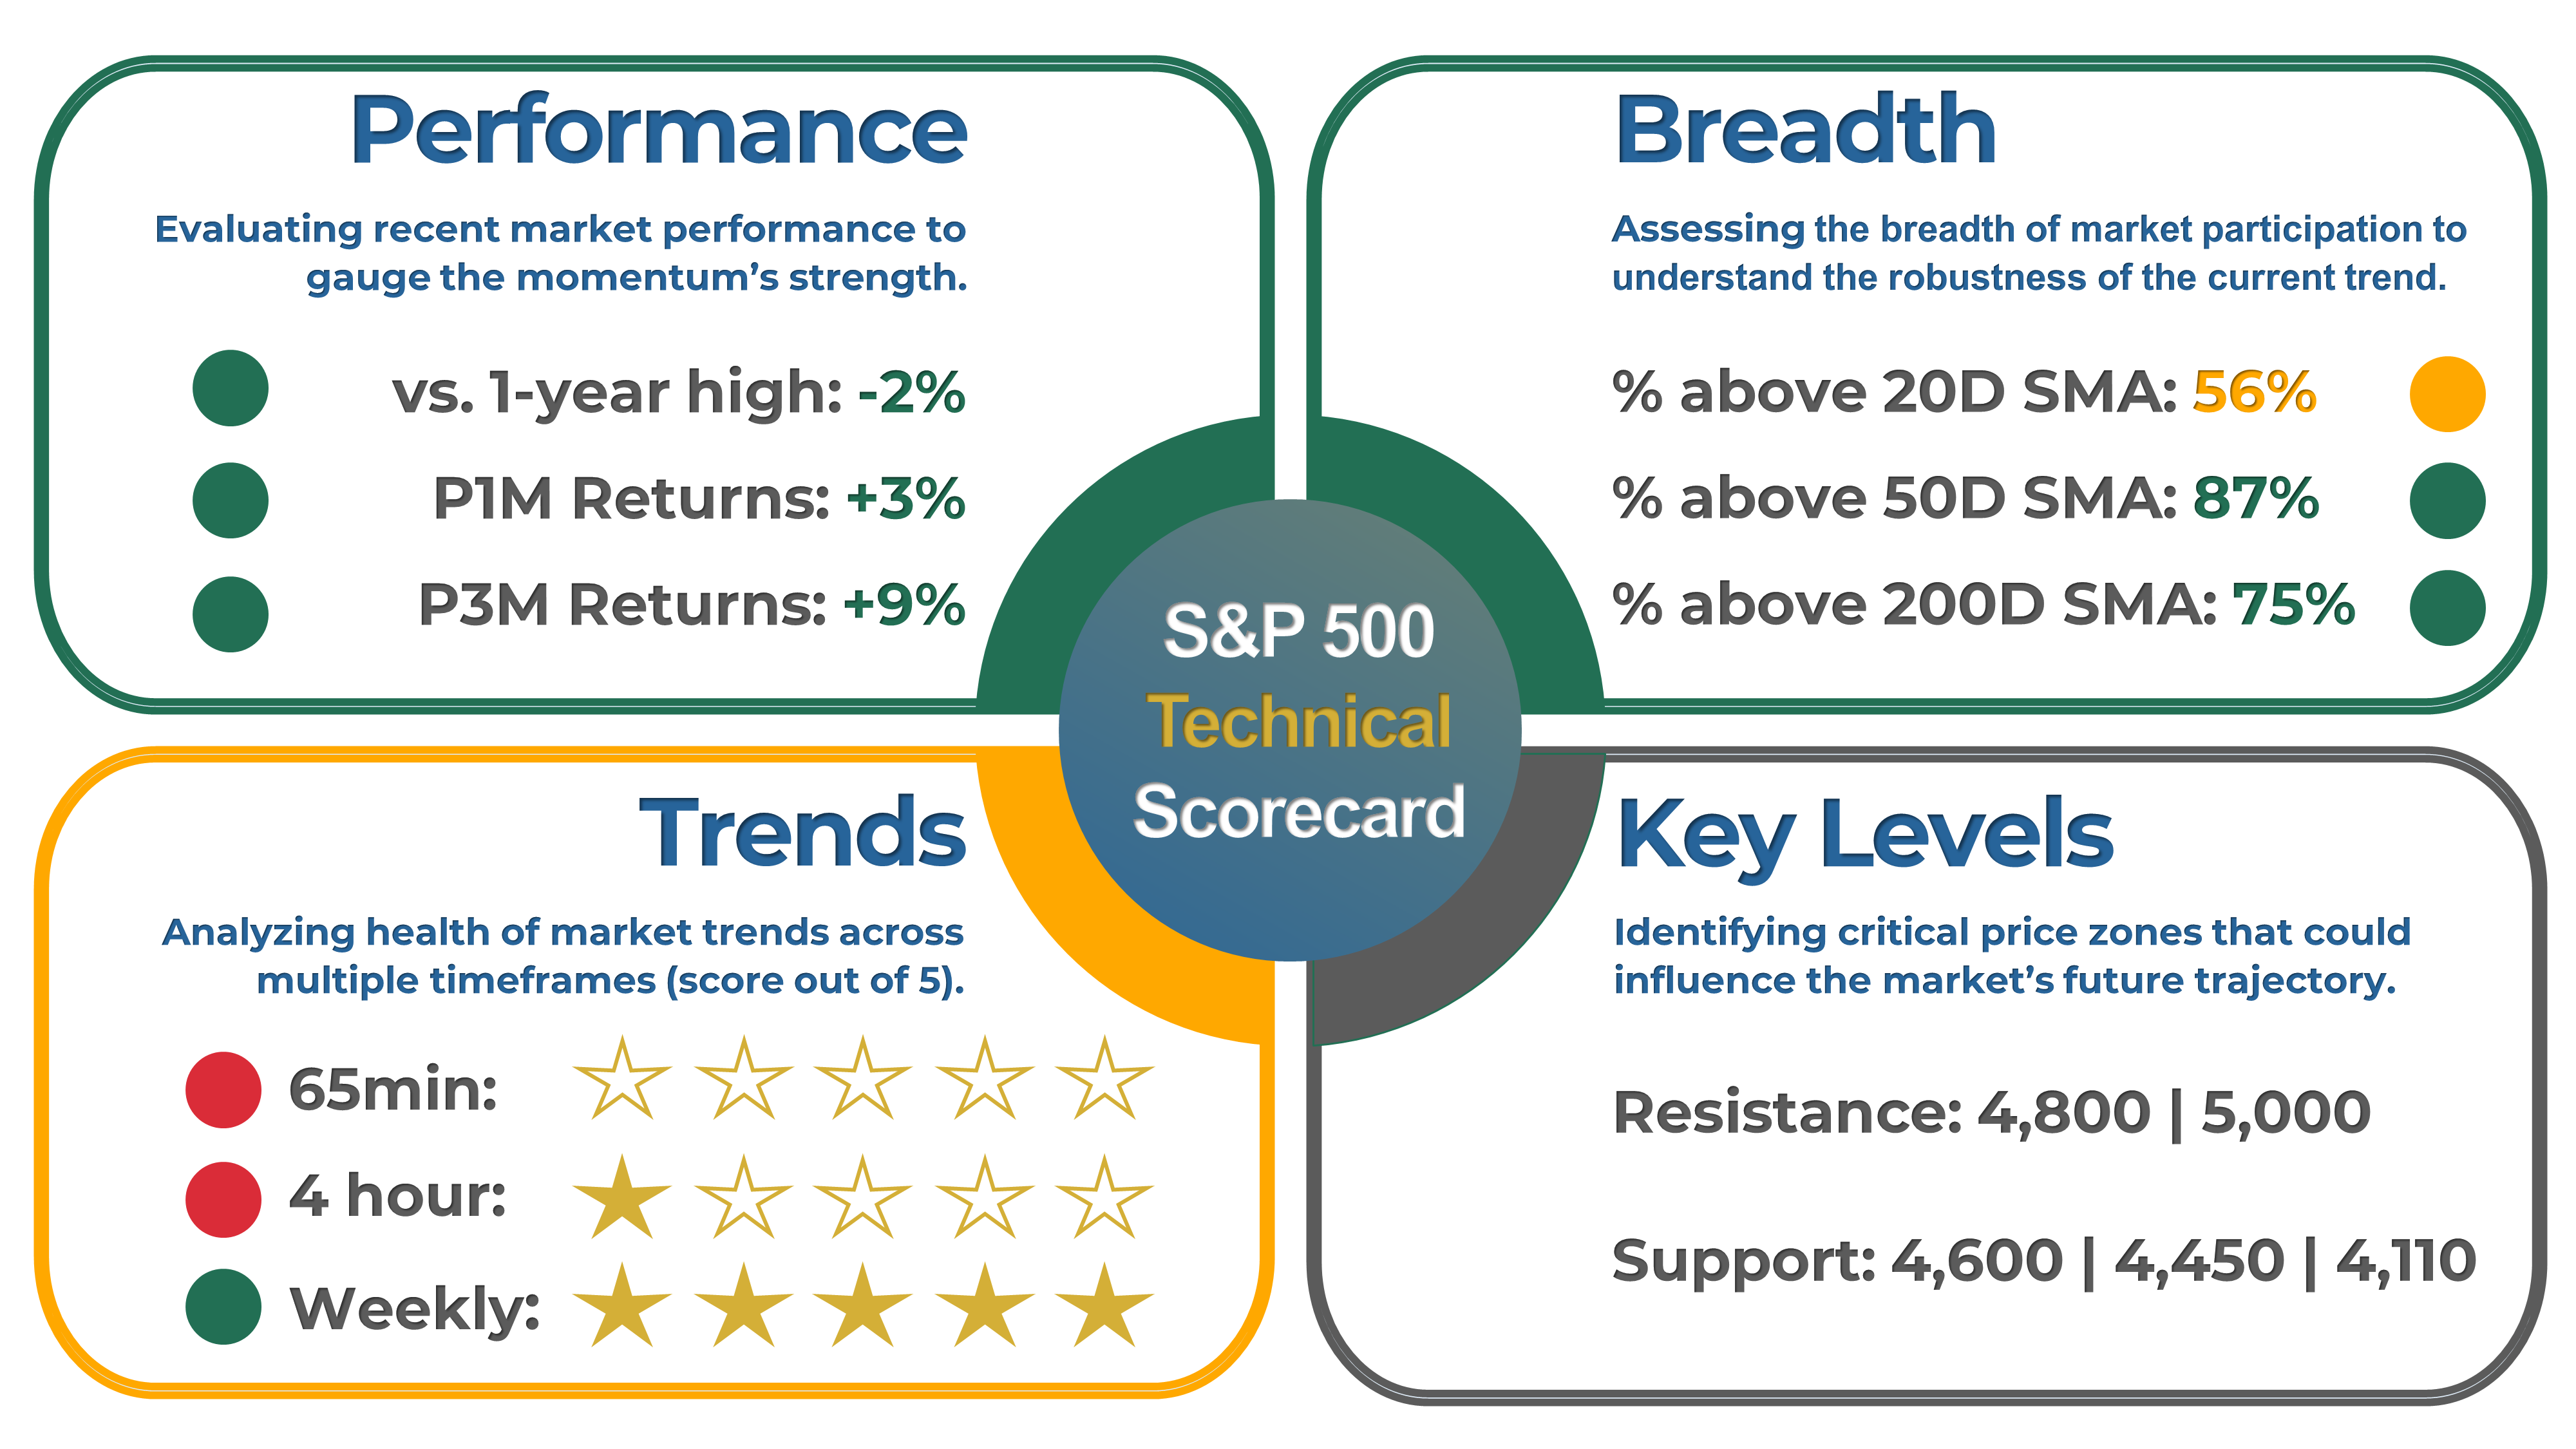
Robust and healthy bull markets typically see the index set several new highs, broad market participation, ascending trend lines, and supports being held while breaking resistance. That's why I've created a four-part scorecard – a straightforward tool to give us a comprehensive view of these essential health indicators.
Momentum: the index is up 3% over the past month and 9% in the last three months, now trading just 2% shy of its 52-week high.
Breadth: market participation remains healthy in the long term as 75% of S&P 500 stocks are trading above their 200-day moving average (SMA). Meanwhile, 54% of stocks are trading above their 20-day SMA, dropping from 84% the previous week and signaling we may only be at the beginning of this pullback.
Trends: The 65-minute and 4-hour charts have turned bearish. Every bounce has proven short-lived this week. Similarly to the weekly chart above, I use exponential moving averages to evaluate the trend's strength and compute a score out of 5.
Key levels: the 4,800 zone is the next significant resistance, while 4,600 is the support to hold if this pullback continues. In the longer term, my target would be to break the 5,000 mark. On the other hand, a break below 4,110, October's low, would be a setback to the bullish case.
Have you enjoyed my analysis so far? There is much more in the paid version: I provide my technical analysis and short-term trading of over 20+ US large caps and share my long-term investing portfolios. Upgrade to one of the paid plans and unlock all the exclusive features and insights!
3. Momentum Analysis of the Week
This week's momentum analysis is about seasonality, as we just started the month of January. Since 1964, the S&P500 has been up 58% of the time in January, averaging a +1.0% return.

EARNINGS RECAP
1. Q4 and 2024 Expected EPS & Revenue Growth
Q4 2023 earnings for the S&P 500 are expected to be up 5%. Excluding the energy sector, the figure is +13%.
The earnings are projected to be up 11% in 2024, higher than the 9% growth seen on average over the last decade. In the past 4 weeks, 56% of earnings revisions done by analyst were to increase outlook.
The forward P/E ratio sit at 20.3, higher than the average in the past 5 and 10 years.
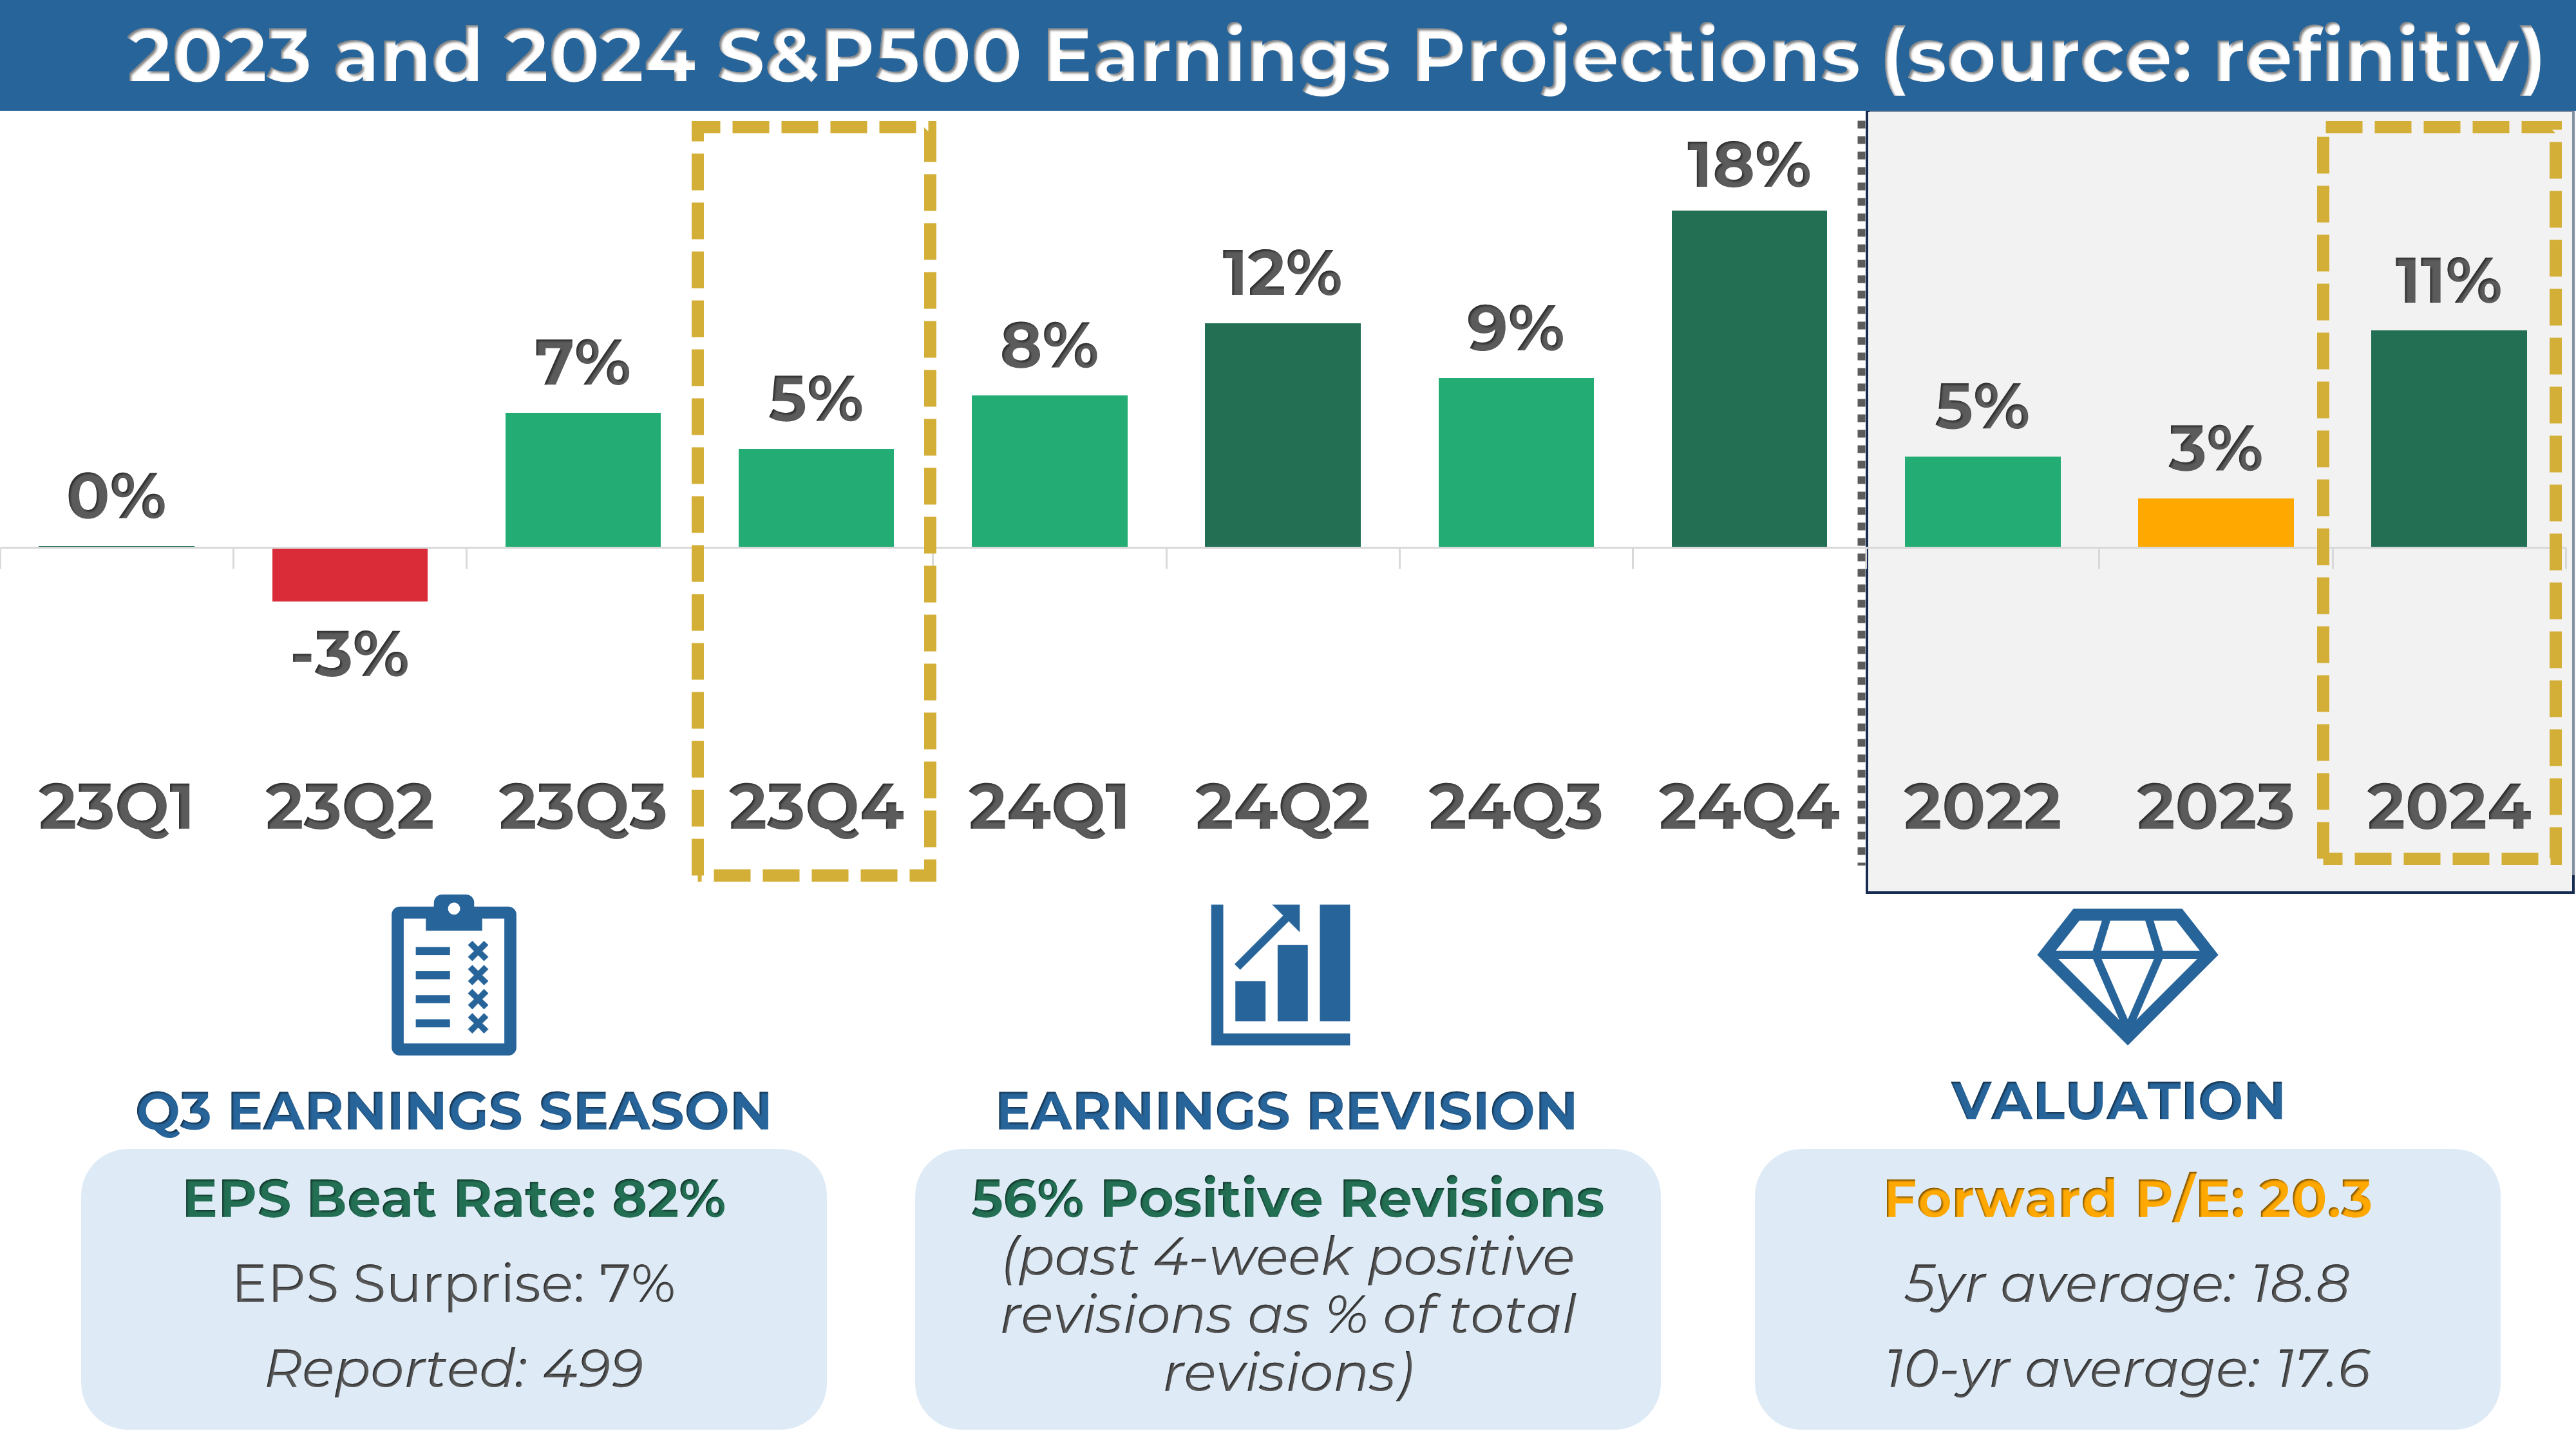
2. Q3 Earnings Season Summary
All the companies from the S&P 500 index have released their Q3 2023 earnings, with 82% posting higher EPS than expectations. This is higher than the previous four-quarter average of 74%, and the historical average of 67%. The next earnings season starts next week!
MARKET SENTIMENT
Measures of investor sentiment can be helpful as they provide insight into the views and opinions of professional or individual investors. However, it's important to note that these measures are not perfect predictors of market movements. They should be combined with other indicators and analysis tools for a complete market picture.
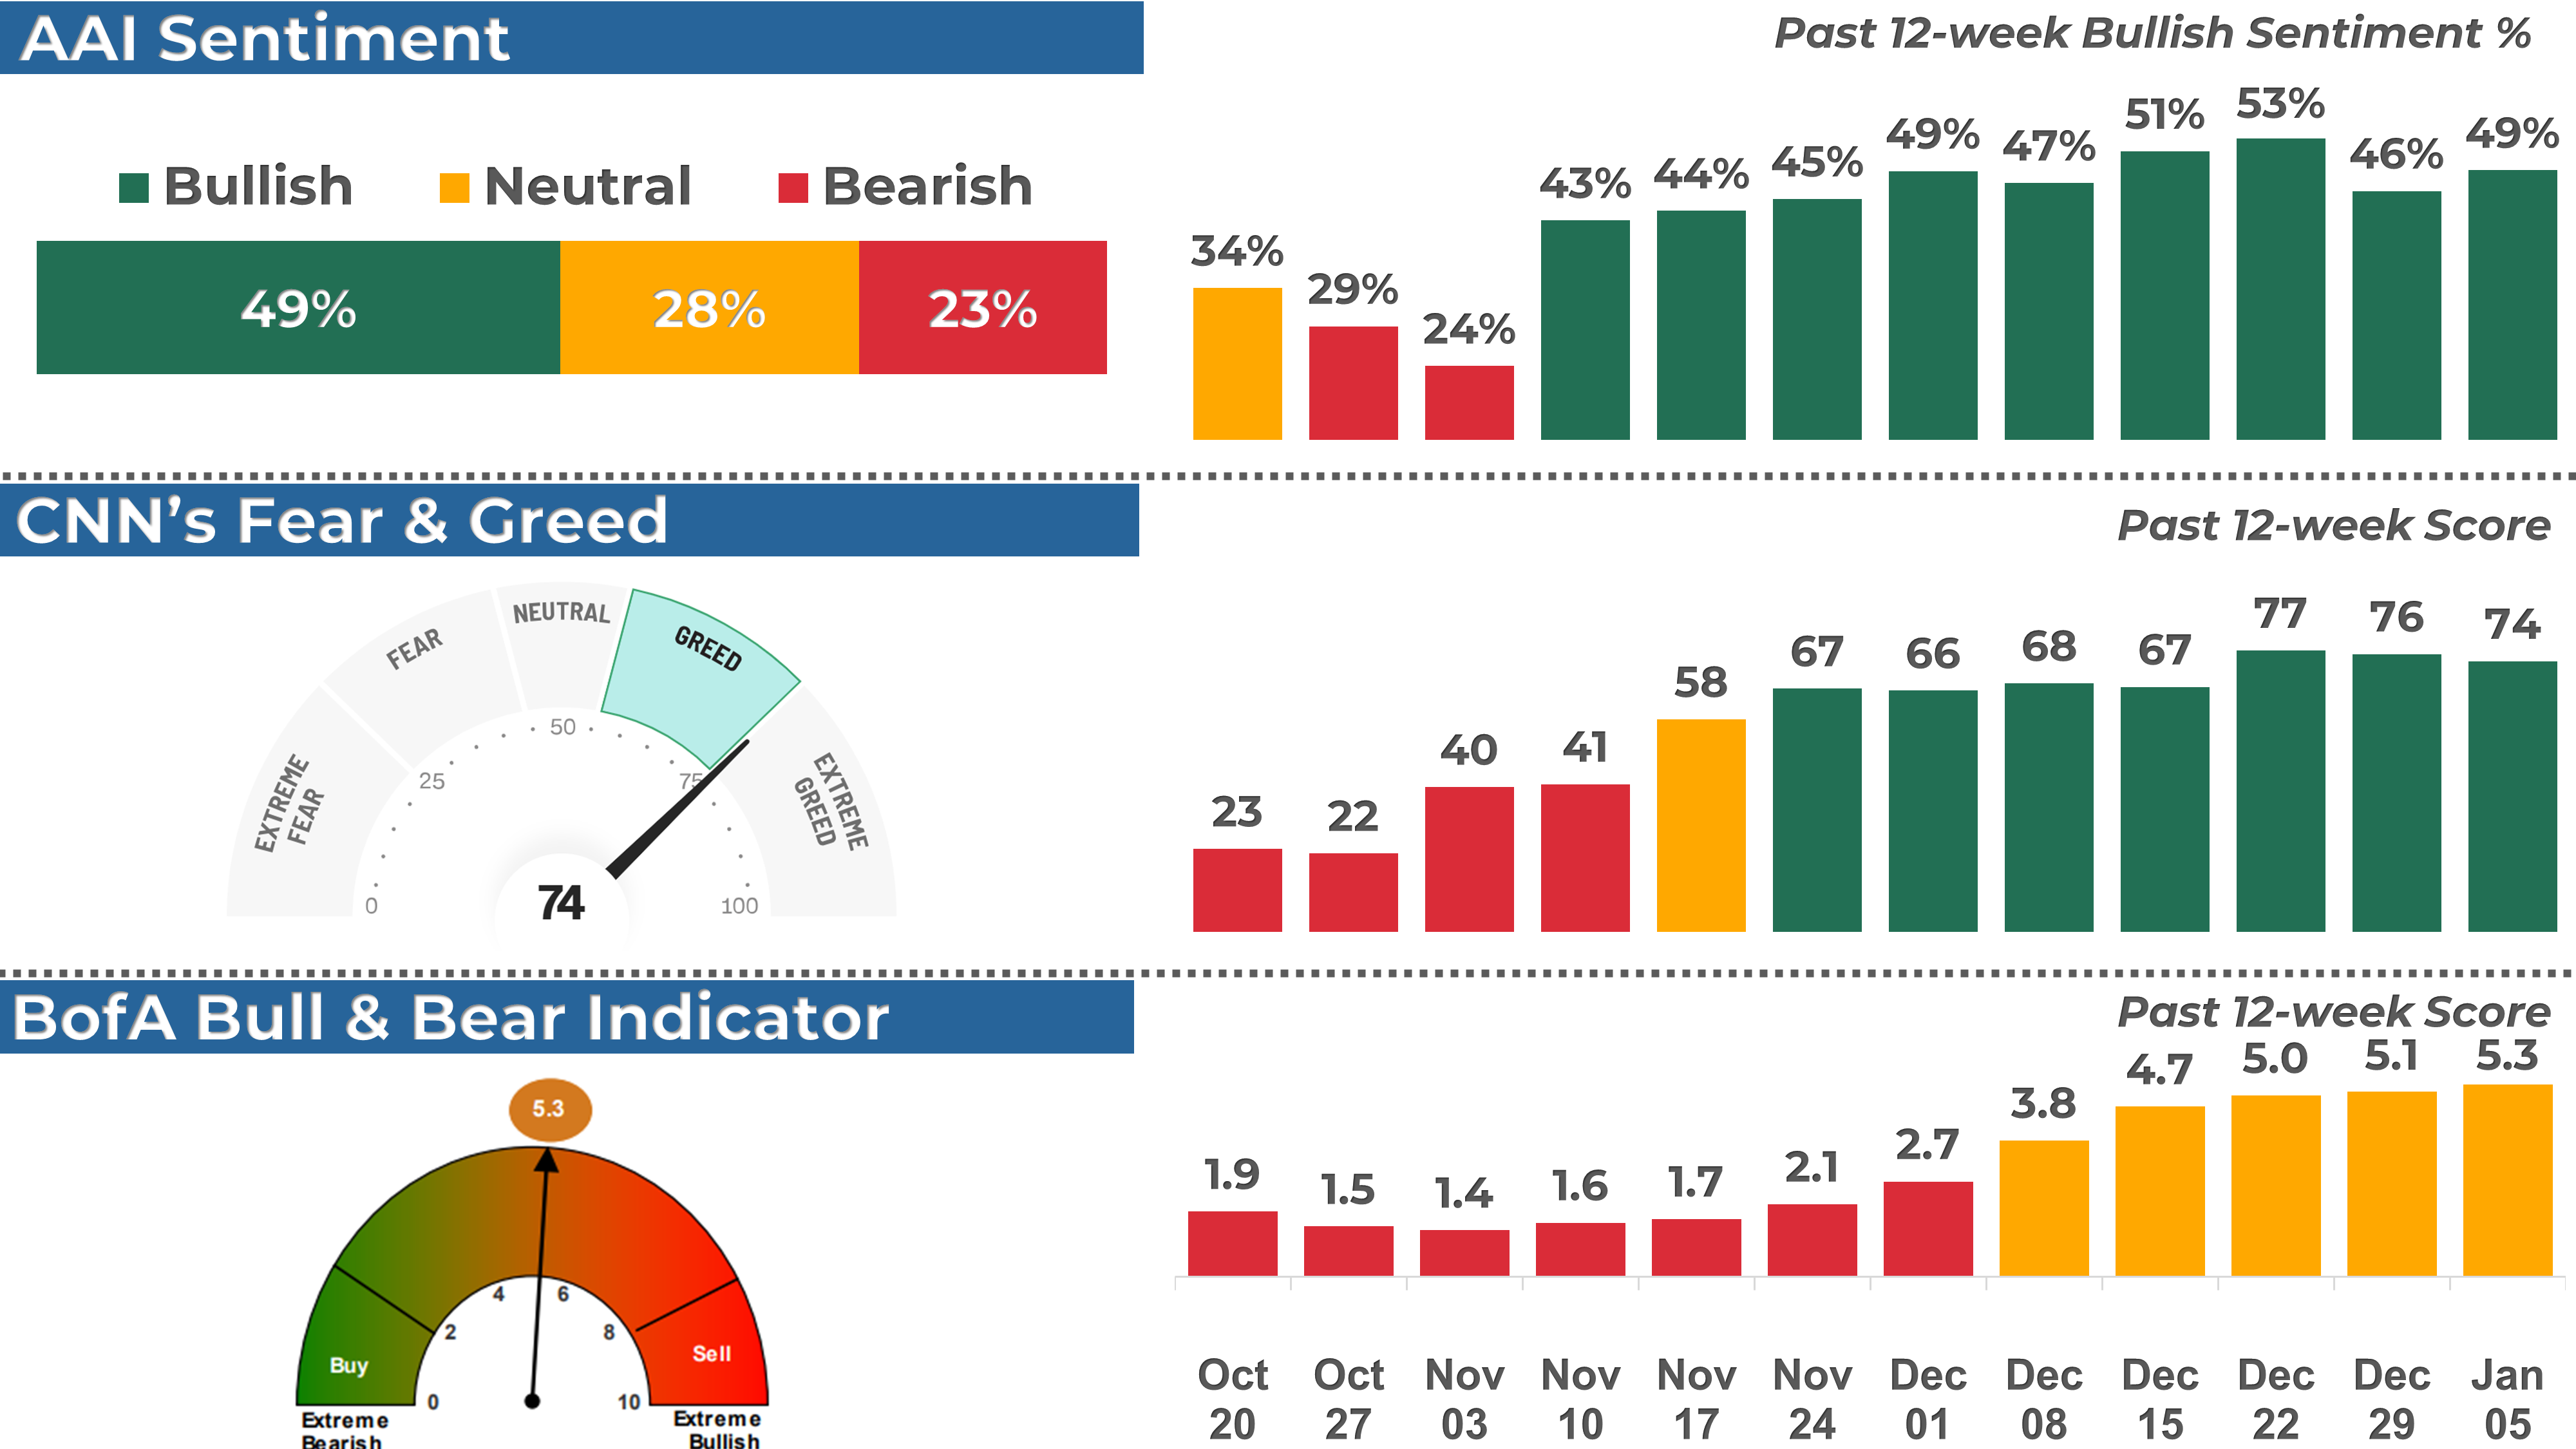
1. AAII Sentiment Survey (Individual Investors)
The American Association of Individual Investors (AAII) conducts a weekly survey among its members to gauge their expectations for the stock market over the next six months. The results of the survey are published every Wednesday.
According to the most recent AAII survey, 49% of the respondents had a bullish outlook on the stock market, a 3-point increase from the previous week. The bullish sentiment was above historical average for the 9th consecutive week.
2. BofA Bull & Bear Indicator (Institutional Investors)
The Bank of America Bull-Bear Indicator is a proprietary measure of investor sentiment developed by Bank of America. It is based on a survey of fund managers and institutional investors, and it tracks the percentage of respondents who are bullish, bearish, or neutral on the stock market. Results are published in the form of a score ranging from 0 (extremely bearish) to 10 (extremely bullish)
The indicator rose from 5.1 to 5.3, the highest level since Nov’21.
3. CNN Fear & Greed Index (Technical)
The CNN Fear & Greed Index is a daily measure that analyzes seven different market indicators to assess the extent to which emotions are influencing investors' decisions. The index is scored out of 100 and categorize results into five stages: Extreme Fear, Fear, Neutral, Greed, and Extreme Greed.
The index closed at 74 or “Greed” level, down from 76 last Friday.
THE WEEK AHEAD
1. Economic Calendar
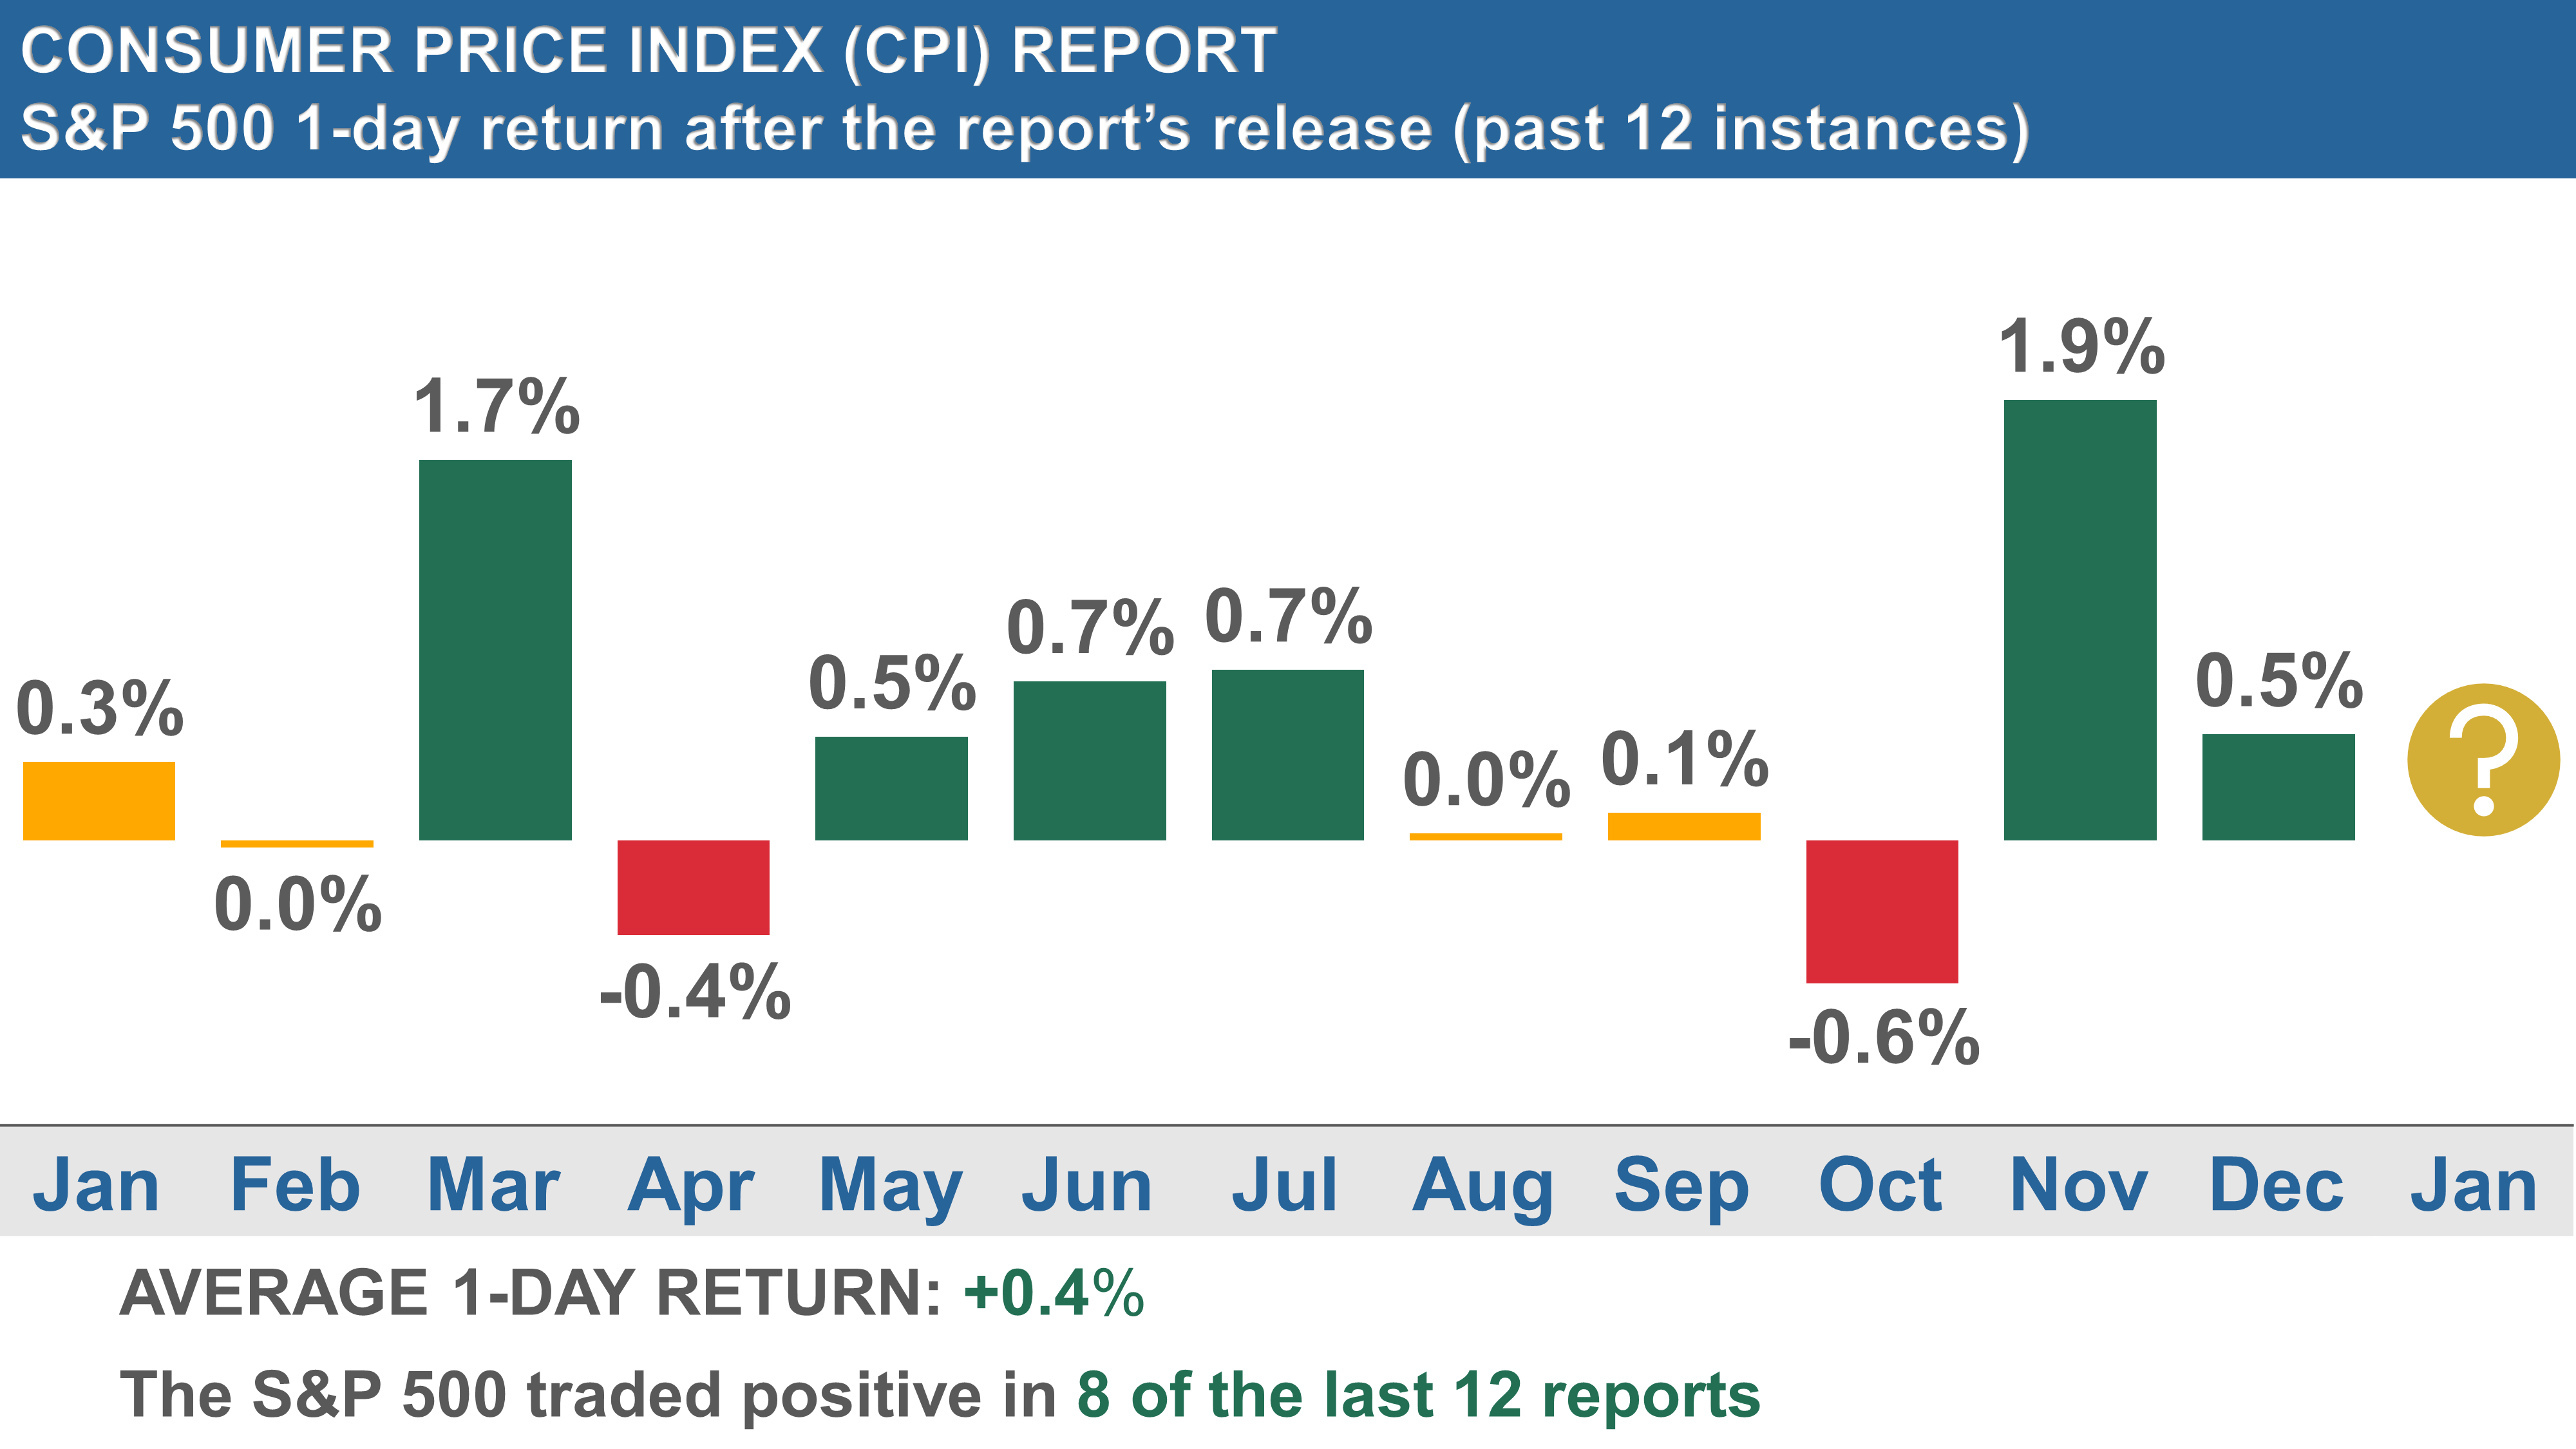
Next Thursday, the Consumer Price Index (CPI) and Producer Price Index (PPI) reports are on the agenda. These will offer us insights into the current inflation landscape and its consequences for the Central Bank policies.
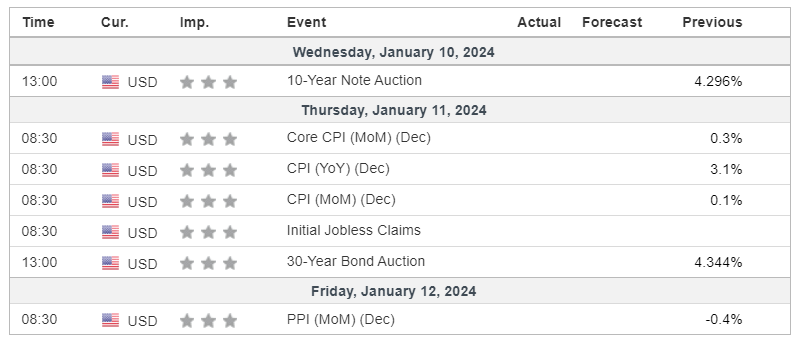
On the day of the release of the CPI report, the S&P500 traded positive in 8 of the past 12 instances, averaging a 0.4% gain.
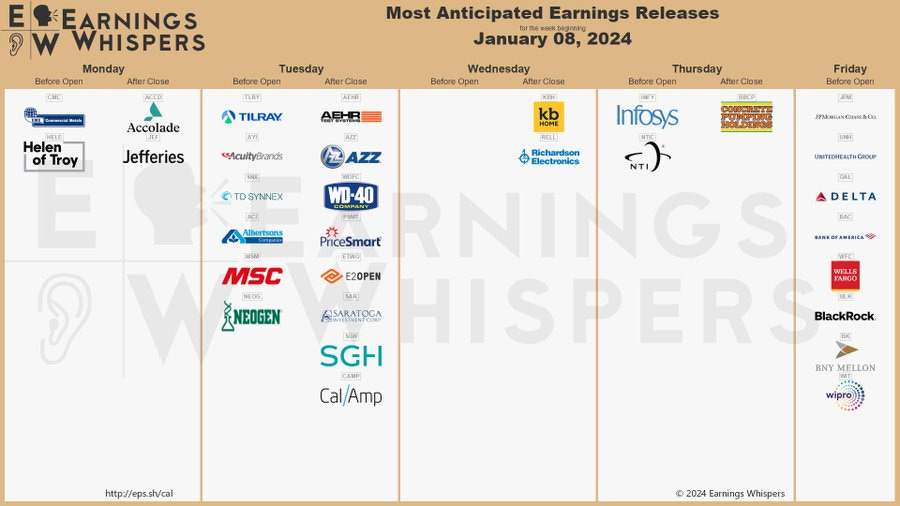
2. Earnings Calendar
The Q4 earnings season is starting in earnest next week, and 7 companies from the S&P 500, including UnitedHealth Group and JP Morgan Chase, are expected to release their quarterly results.
3. Next Week’s Earnings Watchlist
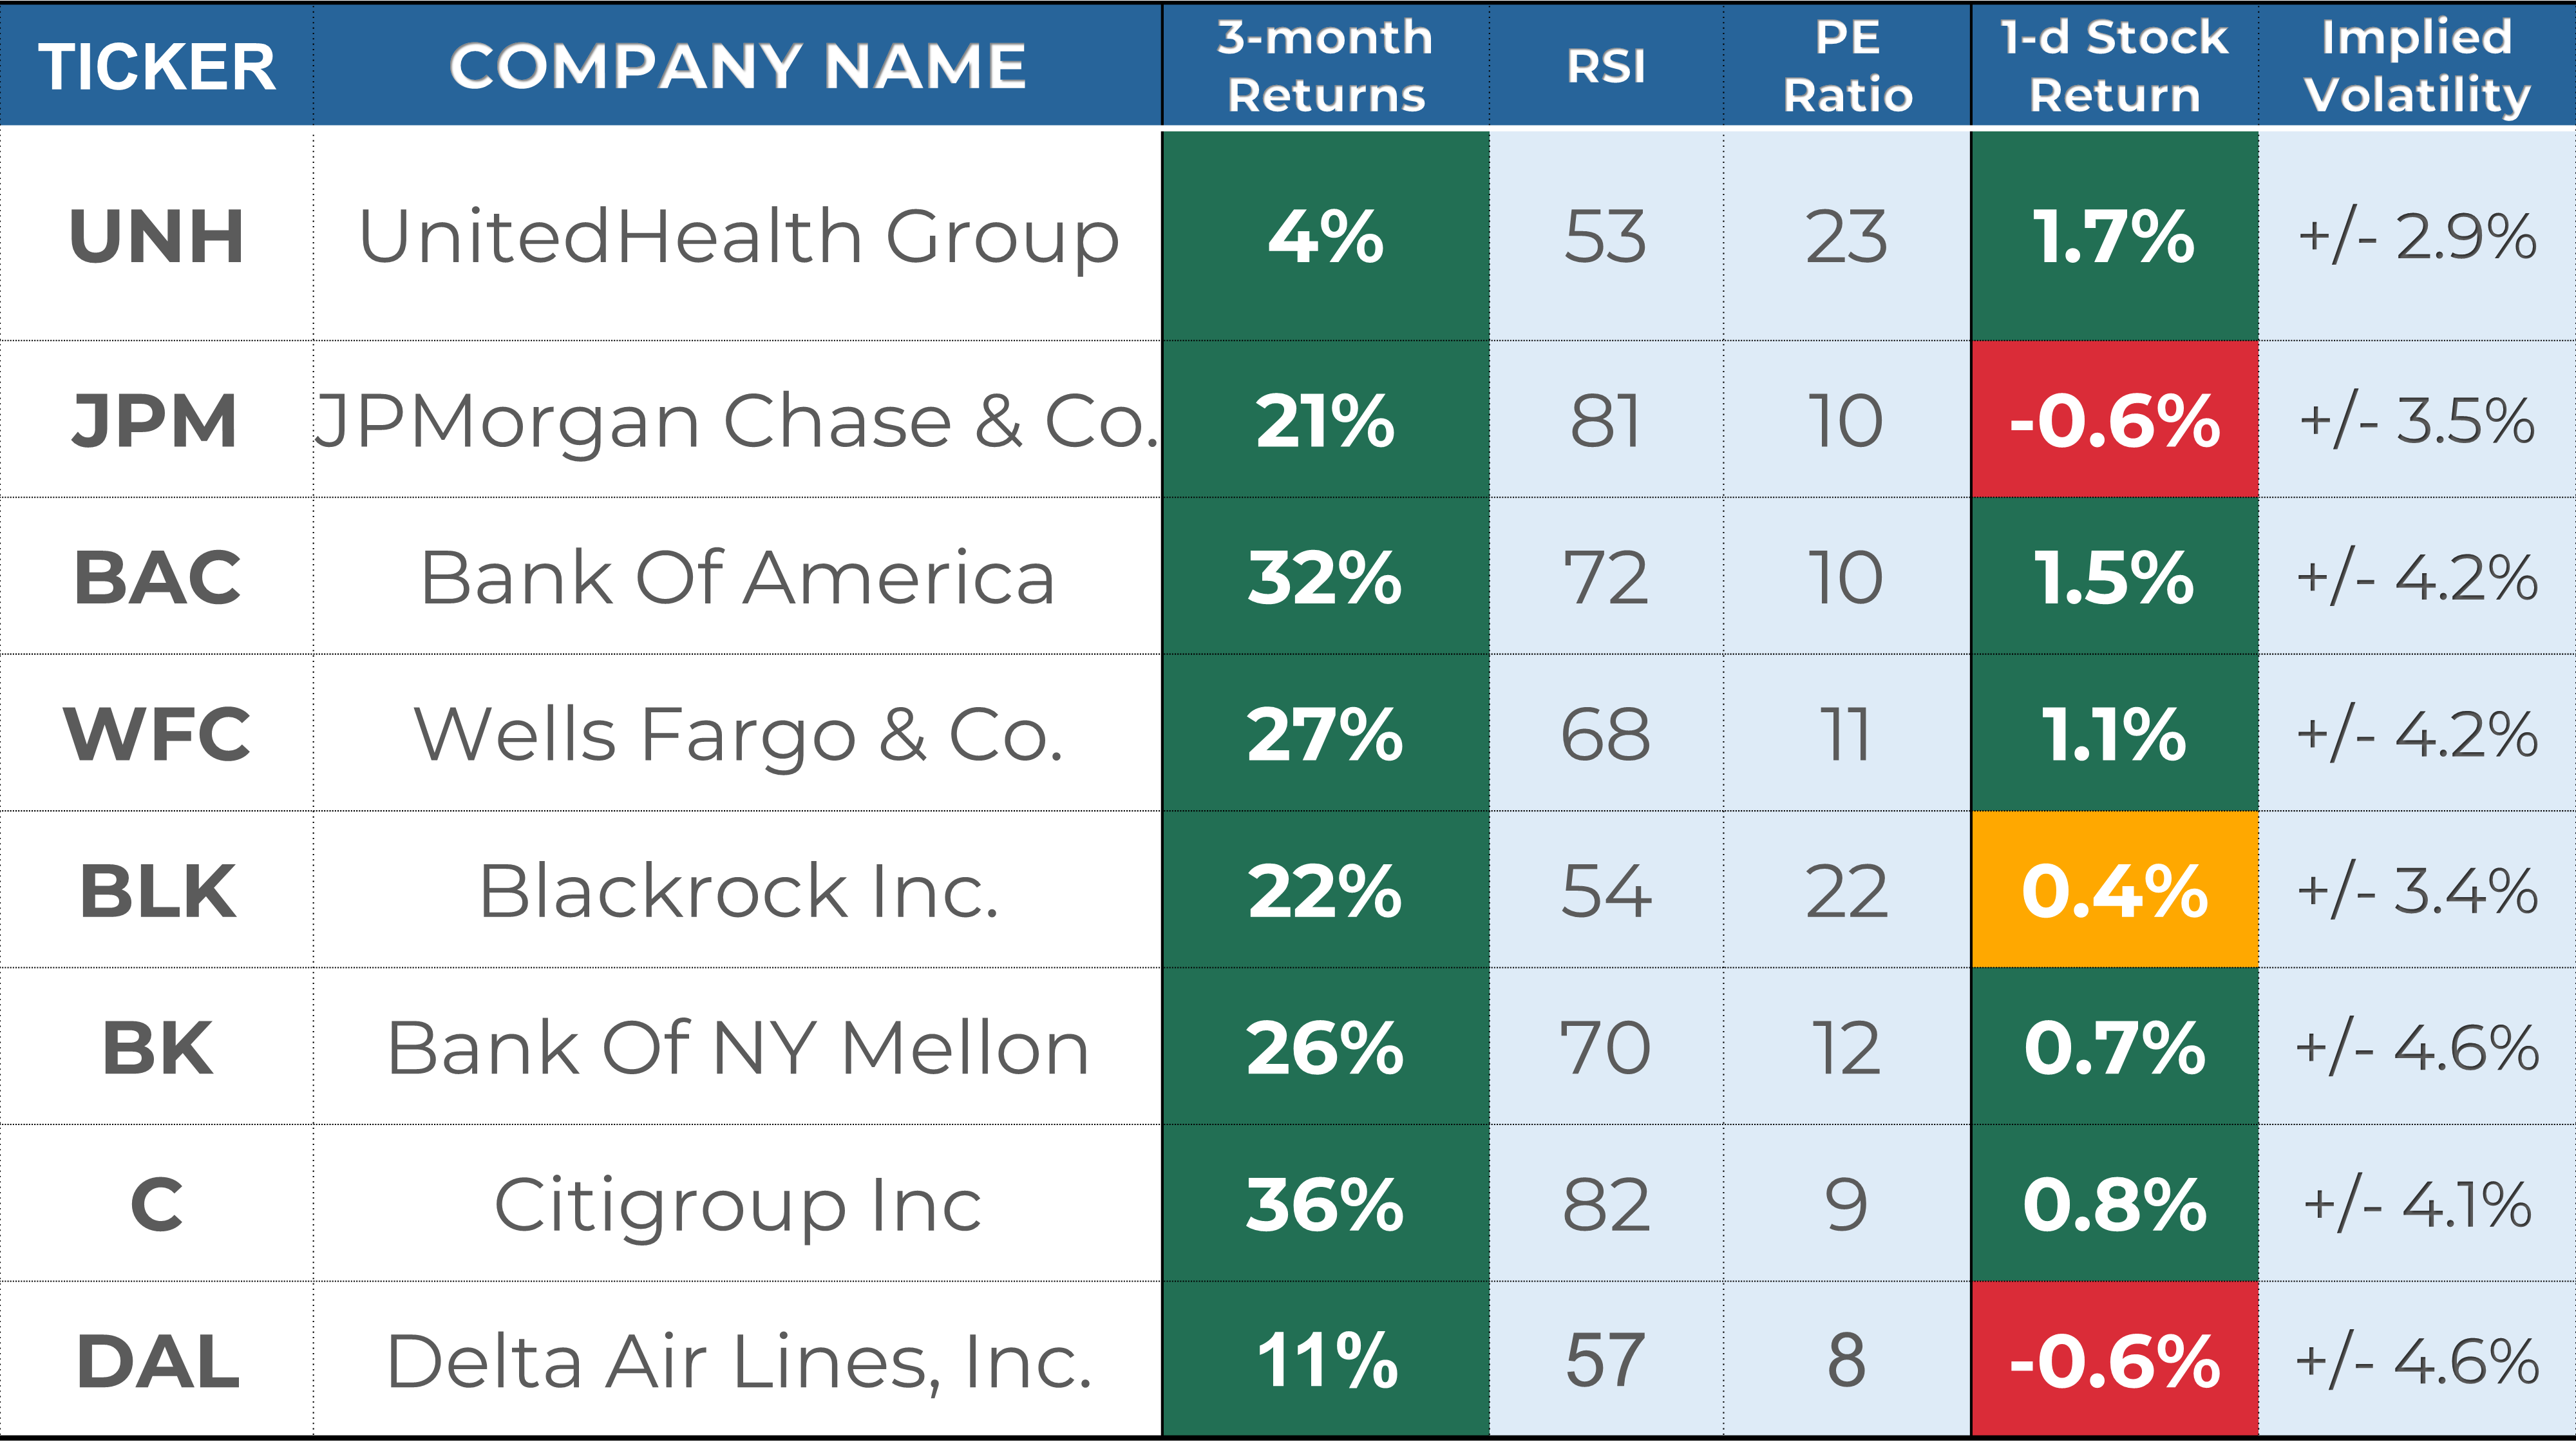
Below is my watchlist of stocks reporting week next week, along with several key indicators I like to review:
Stock Indicators:
Stock performance in the last 3 months.
RSI, where a reading of 70 indicates overbought status and a reading of 30 oversold.
PE ratio, where a reading below 25 indicates a "cheap" value and/or low growth expectations.
Stock Price Reactions to Earnings:
1-day Stock Return on Earnings is the stock performance on the day earnings were released.
Implied volatility is the expected 1-day stock change after earnings are released, as assessed by the options markets.
It is helpful to analyze these indicators to understand better the stocks before their earnings.
Every week, I share a deep dive into 1 stock reporting earnings in the coming days. This week, I prepared an in-depth overview of UnitedHealth Group ($UNH). In this post, I break down key data points around UnitedHealth’s fundamentals, stock returns, analyst ratings, and past earnings performance to help you make informed investment decisions.

Thank you for reading my weekly market recap! I hope you found it helpful in understanding the stock markets better. If you did, please share this post with your friends and followers.
If you need further help, the premium section will give you access to all my trading and investing portfolios as well as more in-depth analysis. And remember you can enjoy a 50% discount if you subscribe before the end of January.
If you have any questions or feedback, please don't hesitate to reach out by email or in the comment section. Your support helps me to continue creating high-quality content and is greatly appreciated!
Have a great week!
My Weekly Stock
DISCLAIMERS
The information provided in this newsletter is for informational purposes only and should not be taken as financial advice. Any investments or decisions made based on the information provided in this newsletter are the reader's sole responsibility. We recommend that readers conduct their own research and consult a qualified financial professional before making investment decisions. The author does not assume any responsibility for any losses or damages arising from using the information provided in this newsletter.
Affiliate Links
Please note that some of the links in this newsletter are affiliate links. This means that at no additional cost to you, I may earn a commission if you decide to make a purchase or sign up for a service after clicking through these links. Your support in purchasing through these links enables me to keep providing free high-quality content and research.
Hi I came across your stack via the substack network if you will. I am not a trader so all of this information is new to me. I do work in finance so I’ve digested what’s in the post. How do I get a fundamental understanding of all of the information, concepts, strategies etc you’ve included here and in your other stacks? Do you have any substacks on starting from square one? I’m just very intrigued. Any info would help, thanks.
Clear, actionable, indispensable