


Weekly Market Recap (Jan 22-26): Can the Fed Spoil the Party?
Everything you need to know about last week's markets performance and what to expect next
Dear subscribers,
Welcome to my Weekly Market Recap.
Markets can be noisy and overwhelming, but I'm here to help you succeed!
Every week, I spend hours curating and producing insightful analyses with clear visuals and a structured layout so you can easily find what you need, week after week. Most of my research is done through a momentum lens and focuses heavily on price action. And because it's easy to get swayed by personal bias, I like to let the data do most of the talking.
If you appreciate this straightforward approach, want more in-depth insights, or are curious about my short- and long-term investing strategies, check out the paid section of this newsletter.
Until the end of January, you can enjoy a 50% discount for your 1st year of subscription! Don't miss out on this opportunity!
SUMMARY
Here are this week's highlights and what to look out for next:
1. The markets were up for the week, with the S&P 500 up 1.1%, the Nasdaq 0.9%, and the Dow Jones 0.7%. Energy (+5.1%) and Communication Serv. (+3.8%) were the best-performing sectors.
2. The long-term trend for the S&P 500 is positive. The next resistance is at 4,910, while 4,800 is now support.
3. The earnings season is well underway, and 124 companies from the S&P 500 index have released their 4th quarter results, with 78% beating estimates. Earnings are expected to be up 5% in Q4 2023 and 10% in 2024.
4. Market sentiment remains positive, as measured by the Fear & Greed indicator, while VIX remains low at 13.
5. Earnings reports from Apple and Microsoft, the Fed meeting, and the Non-Farm Payroll report are scheduled for next week.
My take:
This week, the market delivered its third weekly win of the year, building on last week's surge to record highs. Strong economic data and encouraging inflation data helped lift the market.
As we look ahead, we're bracing for a jam-packed week, with the Fed meeting and earnings from 5 of the Mag 7, which will likely shape the market's direction in the short term. Regarding levels to watch, the 4,900-10 zone, where we failed several times this week, is resistance, while 4,800 remains support. While my primary view is that we break to the upside, let's remember that trends do reverse, and it won't always be as easy as the past three months.
Regarding the bigger picture, I expect the market to reach 5,000 before seeing a downturn. However, the depth and nature of the next meaningful pullback will be critical in assessing whether this bull market has further room to run.

Sponsor
This week’s edition is brought to you by TradingView

Discover TradingView, the charting and social networking tool for investors. TradingView has been instrumental in crafting the detailed analysis and picks featured in my newsletter. It is my go-to platform for:
Stock Charting
Indicator-based trading signals & alerts.
Fundamental and technical data.
Join TradingView today to elevate your trading game by using the link below:
PERFORMANCE RECAP
1. S&P 500 Sector Performance
Over the week, 8 of the 11 S&P 500 sectors have achieved gains. Energy led the way and rose by 5.1%. By contrast, Consumer Cyclical was the weakest and fell by -1.8%.
Year-to-date, 6 sectors have seen positive results. Communication Services has been the most successful sector, with a 7% gain. On the other hand, Materials has been trailing behind.

2. S&P 500 Top & Worst Performers
Last week, 65% of the stocks in the S&P 500 index have risen in value.
The best-performing stocks were:
Netflix Inc. (NFLX, 18%)
American Airlines Group Inc (AAL, 11%)
Halliburton Co. (HAL, 10%)
Meanwhile, the worst-performing stocks were:
DuPont de Nemours Inc (DD, -12%)
Tesla Inc (TSLA, -14%)
Archer Daniels Midland Co. (ADM, -24%)

In addition, 109 stocks within the S&P 500 reached a new 52-week high, while 5 set new lows, indicating the momentum remains mainly to the upside.
The Technology sector has seen the most new highs this week, most of the lows were in Utilities.

MARKET TRENDS & MOMENTUM
1. S&P 500 Long-Term Trend
The long-term trend for the S&P 500 is positive. I base this evaluation on the weekly chart's 9 and 30 exponential moving averages (EMAs). To determine if the trend is strongly positive, I look for the following conditions (the 1st is the most important):
EMA9 is above the EMA30: 🟢
Price is trading above the EMA9: 🟢
Price is trading above the EMA30: 🟢
EMA9 is rising: 🟢
EMA30 is rising: 🟢
I also use MACD as an additional tool to detect trend changes. The MACD is above its signal line, and a positive indication for the index.

2. S&P 500 Technical Analysis
Robust and healthy bull markets typically see the index set several new highs, broad market participation, and ascending trend lines. That's why I've created a four-part scorecard – a straightforward tool to give us a comprehensive view of these essential health indicators.
Momentum: the index is up 2% over the past month and 17% in the last three months, now trading just 0.3% shy of its 52-week high.
Breadth: market participation remains healthy in the long term as 70% of S&P 500 stocks are trading above their 200-day moving average (SMA). Meanwhile, 58% of stocks are trading above their 20-day SMA, rising from 45% the previous week and finally showing broader market participation.
Trends: The 4-hour chart remains positive, while the 65-minute chart shows signs of slowing down. The index broke a new all-time high again this week.
Key levels: We struggled with 4,900- 4,910 several times this week. I also expect the 5,000 zone to be significant resistance. On the downside, 4,800 has become support, while 4,680, early Jan’s low, is the level to hold if we see a more substantial pullback.

Have you enjoyed my analysis so far? The paid version offers much more: I provide my short-term trading and analysis of over 20+ US large caps and share my long-term investing portfolios. Upgrade your subscription to unlock all the exclusive features and insights!
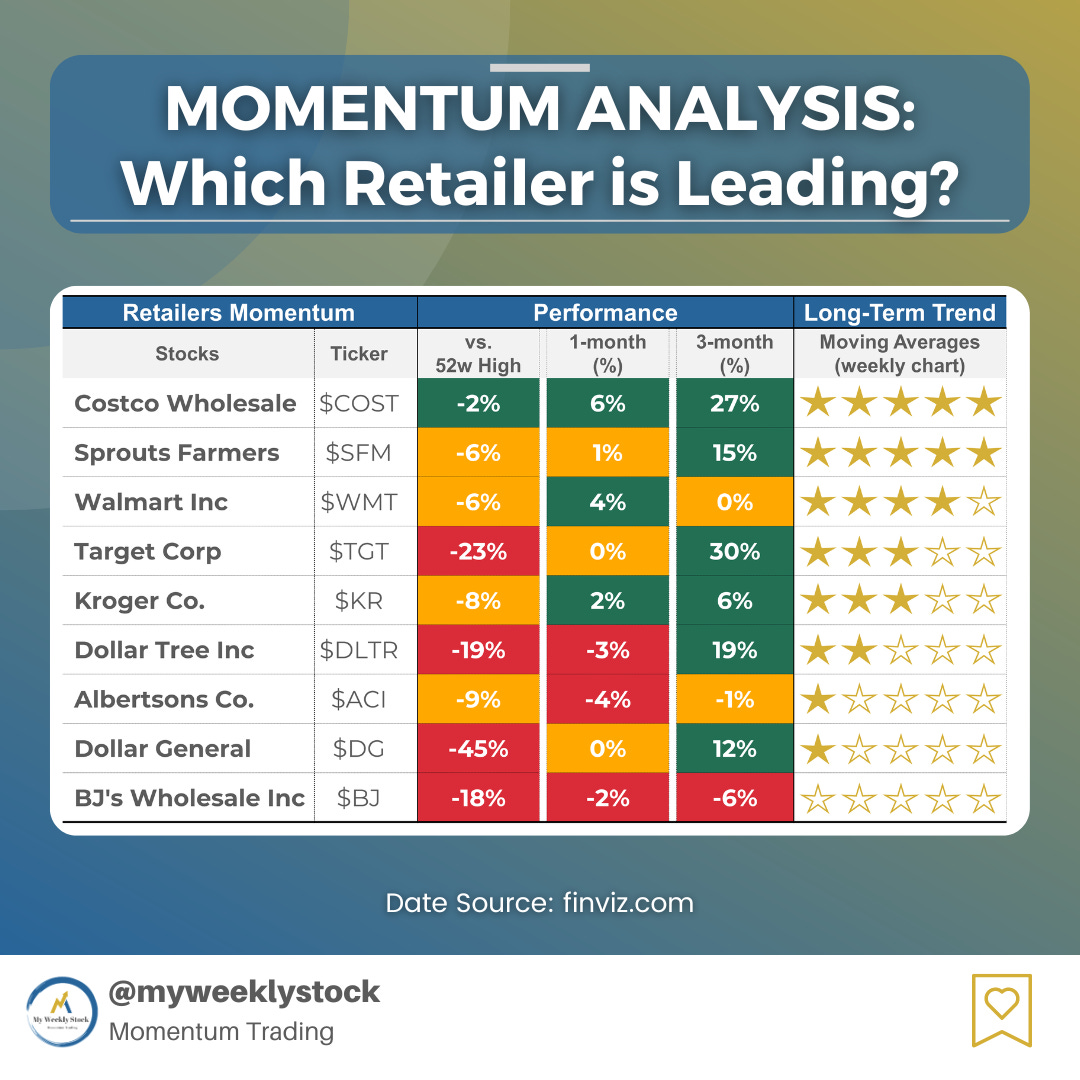
3. Momentum Analysis of the Week
This week's momentum analysis is about Retailers' trends. Using a combination of performance metrics and technical indicators, I've developed a proprietary algorithm to rank these various stocks within the retail industry and identify potential outperformers. Based on this approach, I've identified Costco as having the best relative momentum.
EARNINGS RECAP
1. Q4 and 2024 Expected EPS & Revenue Growth
Q4 2023 earnings for the S&P 500 are expected to be up 5%. Excluding the energy sector, the figure is +9%.
The earnings are projected to be up 10% in 2024, higher than the 9% growth seen on average over the last decade. In the past 4 weeks, 50% of earnings revisions done by analyst were to increase their outlook.
The forward P/E ratio is 20.2, slightly higher than the average over the past five and ten years.

2. Q4 Earnings Season Summary
124 companies from the S&P 500 index have released their Q4 2023 earnings, with 78% posting higher EPS than expectations. This is higher than the previous four-quarter average of 76% and the historical average of 67%.
MARKET SENTIMENT
Measures of investor sentiment can be helpful as they provide insight into the views and opinions of professional or individual investors. However, it's important to note that these measures are not perfect predictors of market movements. They should be combined with other indicators and analysis tools for a complete market picture.

1. AAII Sentiment Survey (Individual Investors)
The American Association of Individual Investors (AAII) conducts a weekly survey among its members to gauge their expectations for the stock market over the next six months. The results are published every Wednesday.
According to the most recent AAII survey, 39% of the respondents had a bullish outlook on the stock market, a 1-point decrease from the previous week. The bullish sentiment remains above the historical average.
2. BofA Bull & Bear Indicator (Institutional Investors)
The Bank of America Bull-Bear Indicator is a proprietary measure of investor sentiment developed by Bank of America. It is based on a survey of fund managers and institutional investors, and it tracks the percentage of respondents who are bullish, bearish, or neutral on the stock market. Results are published in the form of a score ranging from 0 (extremely bearish) to 10 (extremely bullish)
The indicator rose from 5.5 to 6.0, the highest since July 2021, behind continuous stock inflows.
3. CNN Fear & Greed Index (Technical)
The CNN Fear & Greed Index is a daily measure that analyzes seven market indicators to assess how emotions influence investors' decisions. The index is scored out of 100 and categorizes results into five stages: Extreme Fear, Fear, Neutral, Greed, and Extreme Greed.
The index closed at 76, or the “Extreme Greed” level, up from 73 last Friday.
THE WEEK AHEAD
1. Economic Calendar
The upcoming week is packed with several economic events. The spotlight is on the Federal Reserve, with the FOMC meeting taking center stage. Although no change in interest rates is anticipated this time, the attention will be on the Fed Chair's commentary, especially regarding the timing of the first rate cut. On Friday, the Non-Farm Payroll report is expected to provide further insights into the current state of the job market.
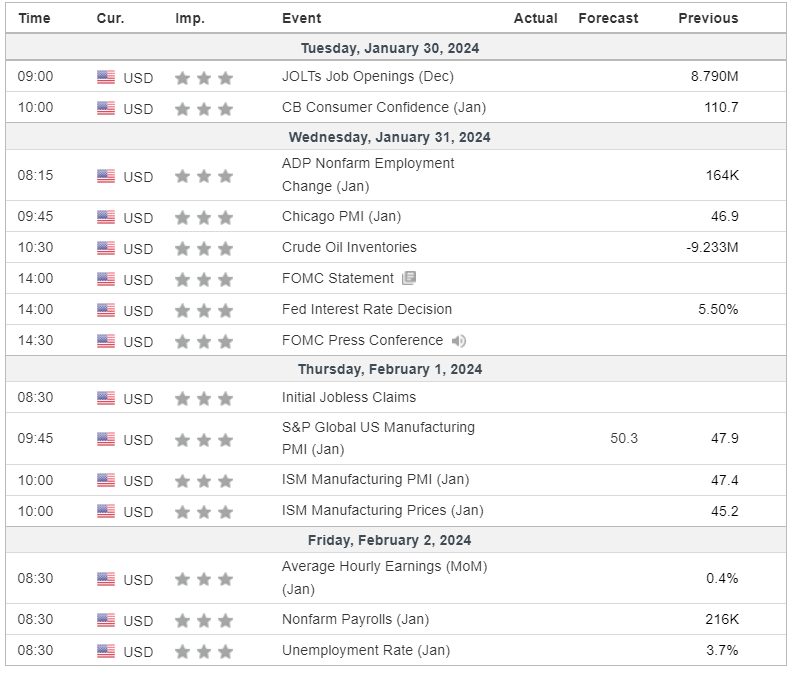
Here is the evolution of Federal Reserve interest rates since June 2022, along with the corresponding performance of the S&P 500 on the day of each interest rate decision.

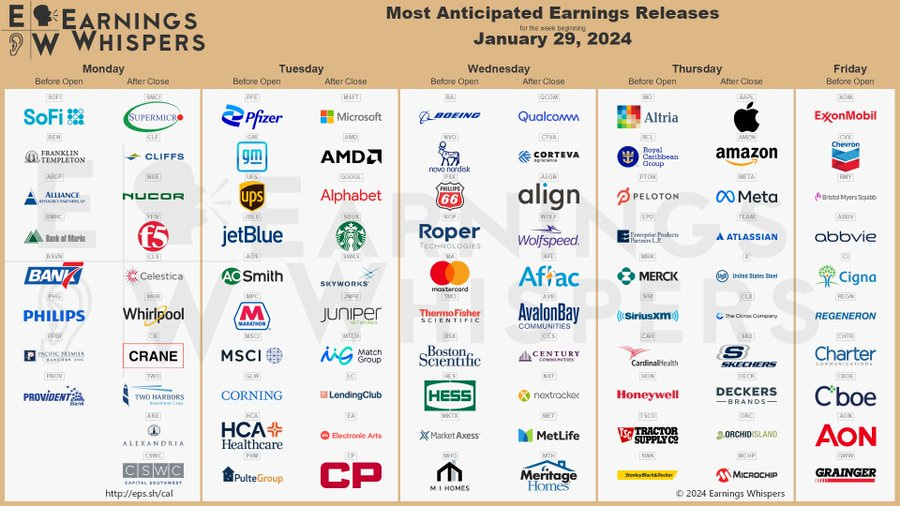
2. Earnings Calendar
The Q4 earnings season is picking up steam, and 86 companies from the S&P 500, including Apple and Microsoft, are expected to release their quarterly results.
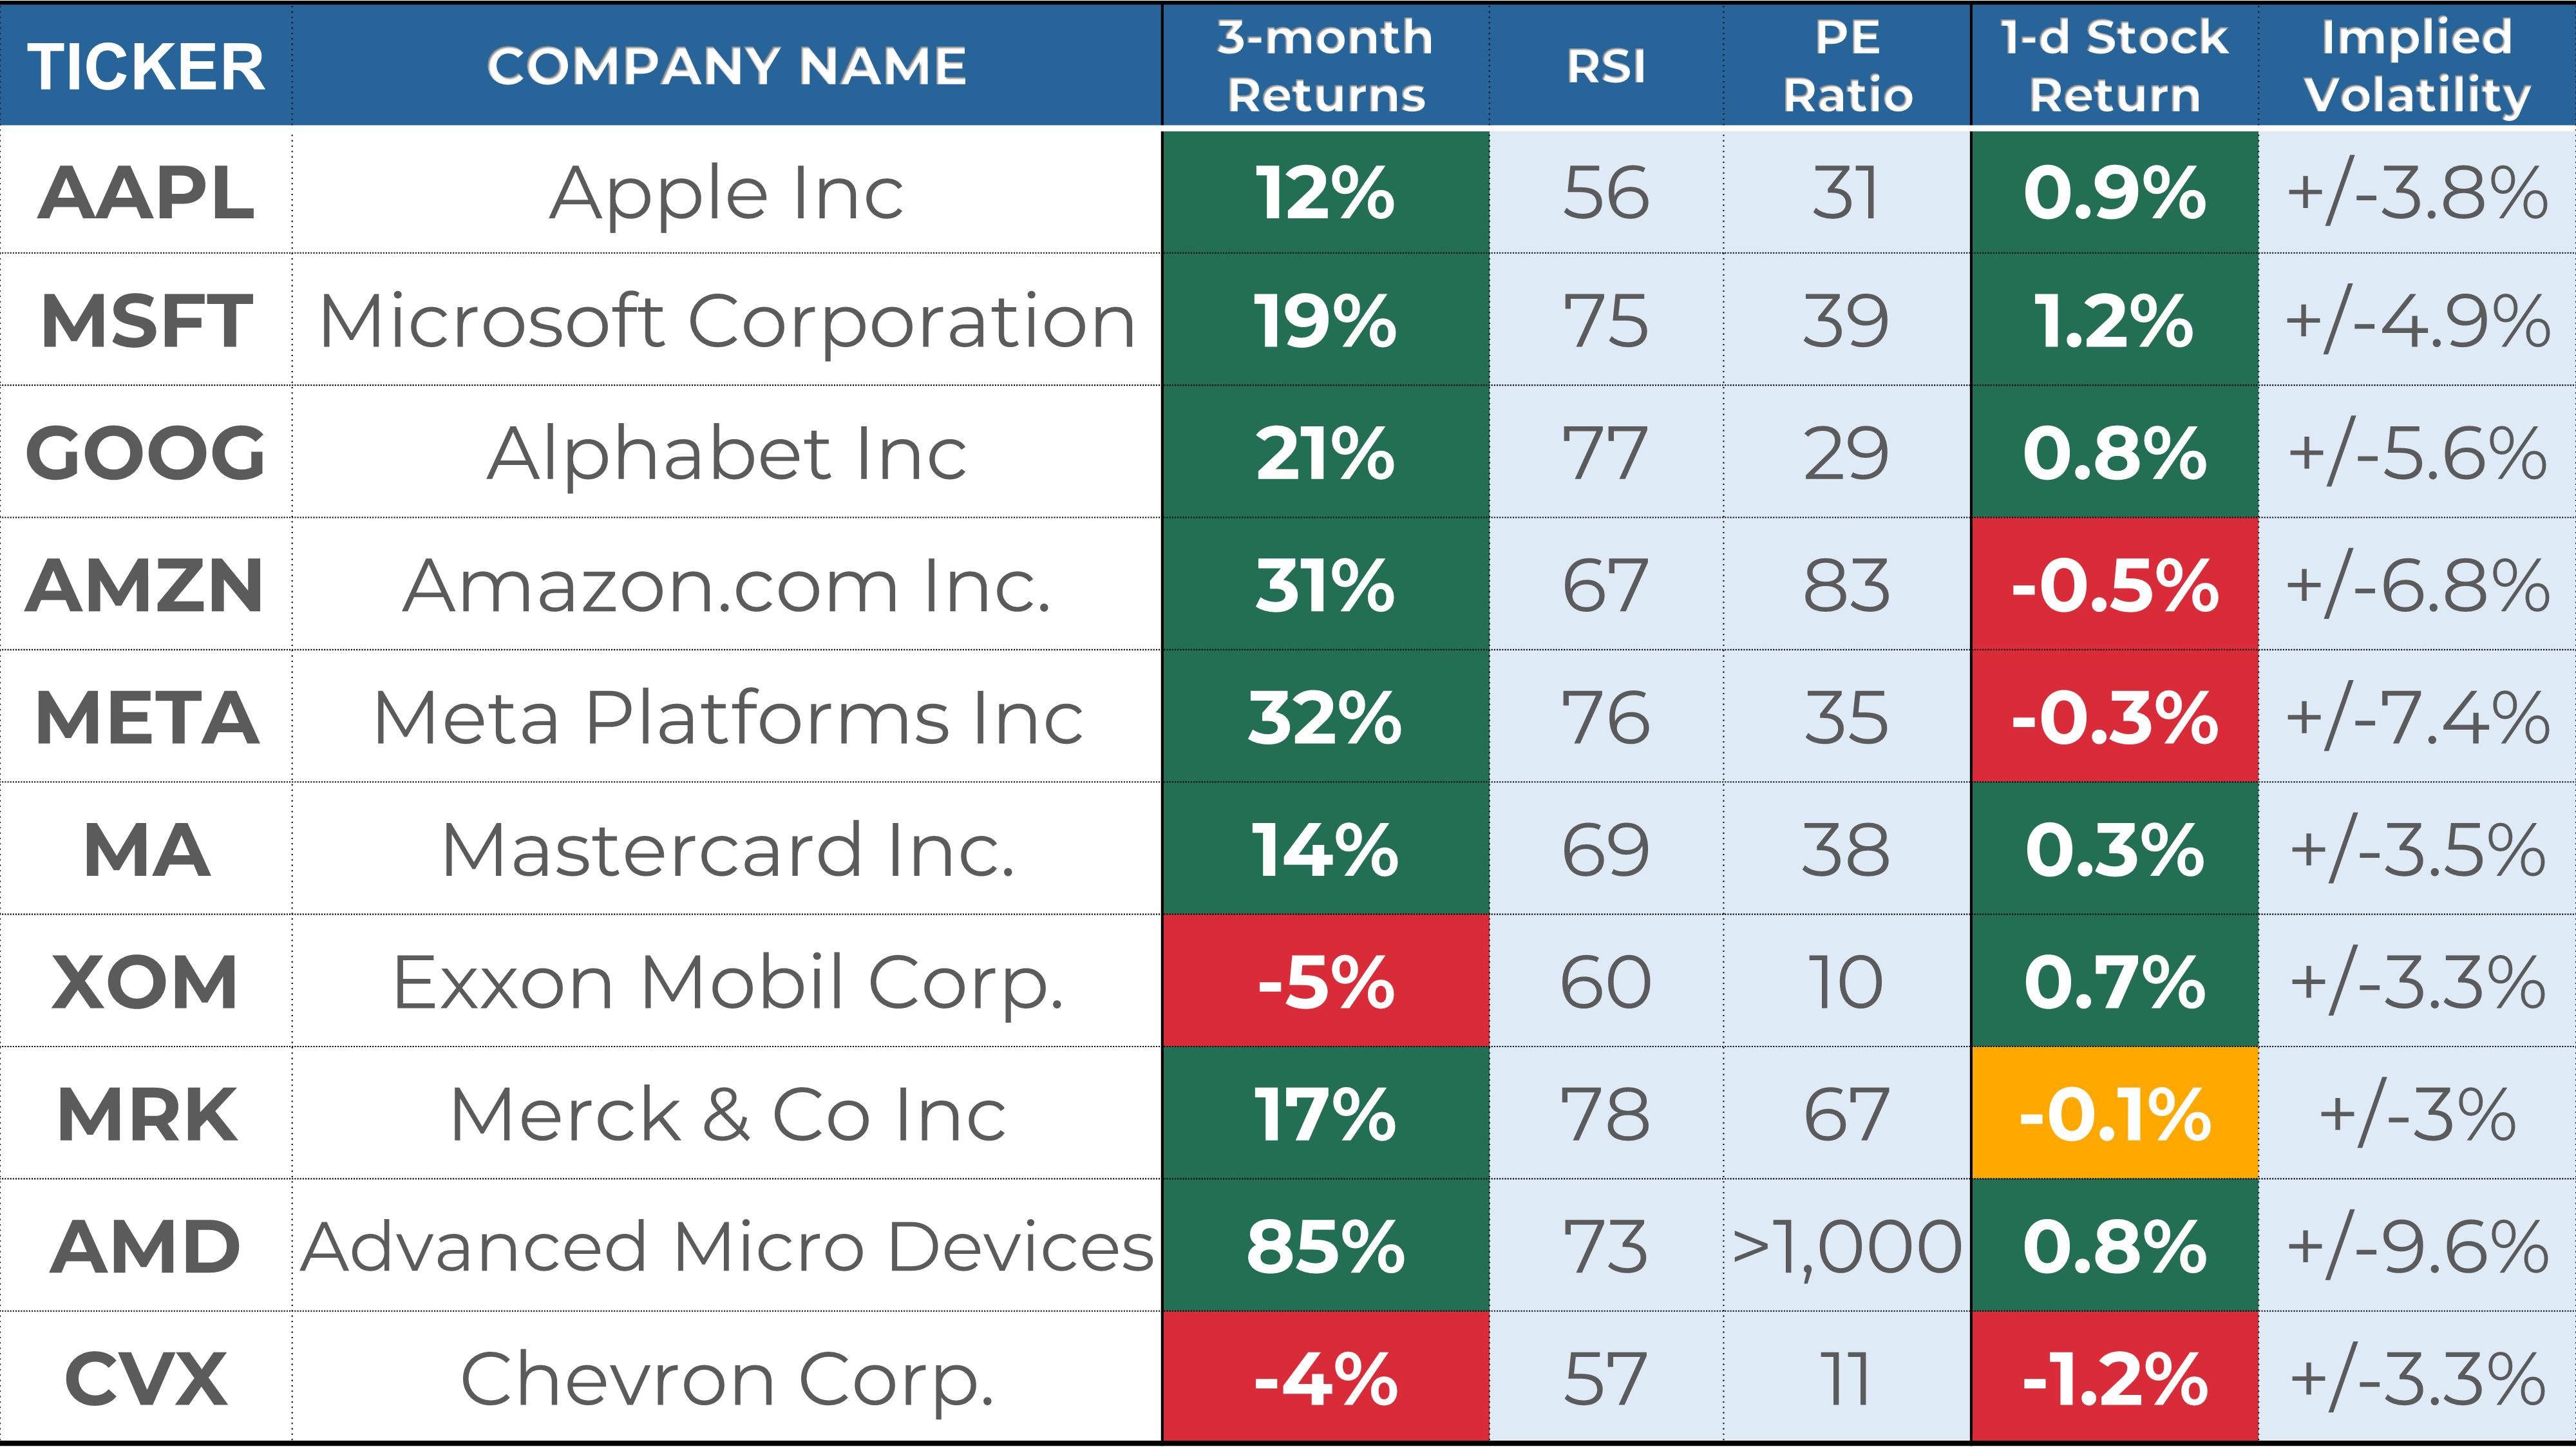
3. Next Week’s Earnings Watchlist
Below is my watchlist of stocks reporting week next week, along with several key indicators I like to review:
Stock Indicators:
Stock performance in the last 3 months.
RSI, where a reading of 70 indicates overbought status and a reading of 30 oversold.
PE ratio, where a reading below 25 indicates a "cheap" value and/or low growth expectations.
Stock Price Reactions to Earnings:
1-day Stock Return on Earnings is the stock performance on the earnings' release date.
Implied volatility is the expected 1-day stock change after earnings are released, as assessed by the options markets.
It is helpful to analyze these indicators to understand better the stocks before their earnings.
Every week, I share a deep dive into 1 stock reporting earnings in the coming days. I prepared an in-depth overview of Apple ($AAPL) this week. In this post, I break down key data points around Apple’s fundamentals, stock returns, analyst ratings, and past earnings performance to help you make informed investment decisions.

Thank you for reading my weekly market recap! I hope you found it helpful in understanding the stock markets better. If you did, please share this post with your friends and followers.
If you need further help, the premium section will give you access to all my trading and investing portfolios and more in-depth analysis. And remember, you can enjoy a 50% discount if you subscribe before the end of January.
If you have any questions or feedback, please don't hesitate to email me or comment on this post. Your support helps me continue creating high-quality content and is greatly appreciated!
Have a great week!
My Weekly Stock
DISCLAIMERS
The information provided in this newsletter is for informational purposes only and should not be taken as financial advice. Any investments or decisions made based on the information provided in this newsletter are the reader's sole responsibility. We recommend that readers conduct their own research and consult a qualified financial professional before making investment decisions. The author does not assume any responsibility for any losses or damages arising from using the information provided in this newsletter.
Affiliate Links
Please note that some of the links in this newsletter are affiliate links. This means that at no additional cost to you, I may earn a commission if you decide to make a purchase or sign up for a service after clicking through these links. Your support in purchasing through these links enables me to keep providing free high-quality content and research.
Great market review once again.
btw: I´m considering trading Archer Daniels Midland Co. Price drop presents an interesting opportunity.