


Weekly Market Recap (Jan. 9 - 13)
Everything you need to know about last week's markets performance and what to expect next

Dear subscribers,
Welcome to our weekly market recap!
Navigating the markets can be overwhelming, but I'm here to provide you with the latest updates and actionable insights to help you succeed. Whether you're an experienced investor or just starting out, my recap has something for everyone.
I hope you enjoy this week's edition and find it helpful. If you like what you see, please share it with your network on social media and, if you haven't already, subscribe to our email updates.
Thank you for joining us, and let's get started!
SUMMARY
Here are this week's highlights and what to look out for next:
1. The markets were positive, with the S&P 500 up 2.7%, the Dow Jones 2.0%, and the Nasdaq 4.5%. Consumer Cyclical (+5.8%) and Technology (+4.8%) were the best-performing sectors.
2. Markets digested the latest inflation data, with the CPI report showing consumer inflation in line with expectations and confirming signals of a slowdown.
3. The long-term trend is mixed but improving for the S&P 500 based on the weekly chart. If we can maintain the positive momentum and break out of the downtrend channel, it could signal a bullish trend for the upcoming weeks.
4. The earnings season has started, and 29 Companies on the S&P 500 index have released their Q4 earnings, with 72% beating estimates. Earnings per share (EPS) are expected to fall 2.2% in Q4 2022 and rise 4% in 2023.
5. Earnings reports from Procter & Gamble, Netflix, and Goldman Sachs are scheduled for next week, along with the release of the retail sale data for December.
My take:
With the inflation report out of the way, investors' attention will shift to the upcoming earnings season and the strength of the global economy. And despite a second positive week for markets, I remain cautious, particularly with critical technical levels just ahead. We have yet to see a sustained breakout from the downtrend channel that began in January 2022, and the last attempts have all failed. If we break out, I will be more optimistic about the market outlook.

PERFORMANCE RECAP
1. SP500 Sector Performance
Over the week, 9 of the 11 S&P 500 sectors had achieved gains. Consumer Cyclical led the way, rising by 5.8%. By contrast, Consumer Defensive was the weakest, falling by 1.4%.
Year-to-date, all 11 sectors have seen positive results. Communication Services has been the most successful sector, with a 9% gain. On the other hand, the Health Care and Consumer Defensive sectors have been trailing behind.

2. S&P 500 Weekly Heat Map
Over the last five trading days, 75% of the stocks in the S&P 500 index have risen in value.
The best-performing stocks were:
United Airlines Holdings, Inc. (UAL, 22%)
American Airlines Group Inc. (AAL, 20%)
Norwegian Cruise Line Holdings Ltd. (NCLH, 20%)
Meanwhile, the worst-performing stocks were:
Northrop Grumman Corporation (NOC, -12%)
AbbVie Inc. (ABBV, -8%)
Baxter International Inc. (BAX, -7%)
In addition, 6 stocks within the S&P 500 reached a new 52-week low, while 30 set new highs.

MARKET TRENDS & MOMENTUM
1. S&P 500 Long-Term Trend
The long-term trend for the S&P500 is mixed but improving, according to my analysis. I base this evaluation on the weekly chart's 9 and 30 exponential moving averages (EMAs). To determine if the trend is strongly positive, I look for three conditions:
Price is trading above the EMA9 and EMA30: 🟢
EMA9 is above the EMA30: 🔴
Both moving averages are rising: 🟡
I also use MACD as an additional tool to detect trend changes. The MACD is currently higher than its signal line, a positive indication for the index.

2. Short-term outlook and key levels
The S&P 500 is at a crossroads, with the index currently sitting at the downtrend channel that started in January 2022. We've seen three failed attempts to break out of this channel in March, August, and December, so this fourth try isn't going to be any easier. However, should we achieve a successful breakout, the outlook would become much more bullish.
Regarding specific levels to watch, 4,080 (the December high) is an important resistance On the other hand, 3,720-60 is a key support range to watch.
3. S&P 500 Sectors Momentum
My stock-picking strategy is centered around momentum analysis. I employ various performance metrics and technical indicators, which are then processed by my proprietary algorithm. I use this model here to rank the different S&P 500 sectors and identify those likely to outperform.
This week is Industrials and Materials turn to shine, and I encourage fellow momentum traders to investigate these sectors and the best-performing stocks within them.

EARNINGS RECAP
1. Earnings Season Summary
29 companies from the S&P 500 have released their Q4 2022 earnings, with 72% posting higher EPS than expectations. However, this is lower than the previous four-quarter average of 76%.
Companies are reporting earnings that are 7% higher than expected on average, slightly higher than the four-quarter average of 5%.

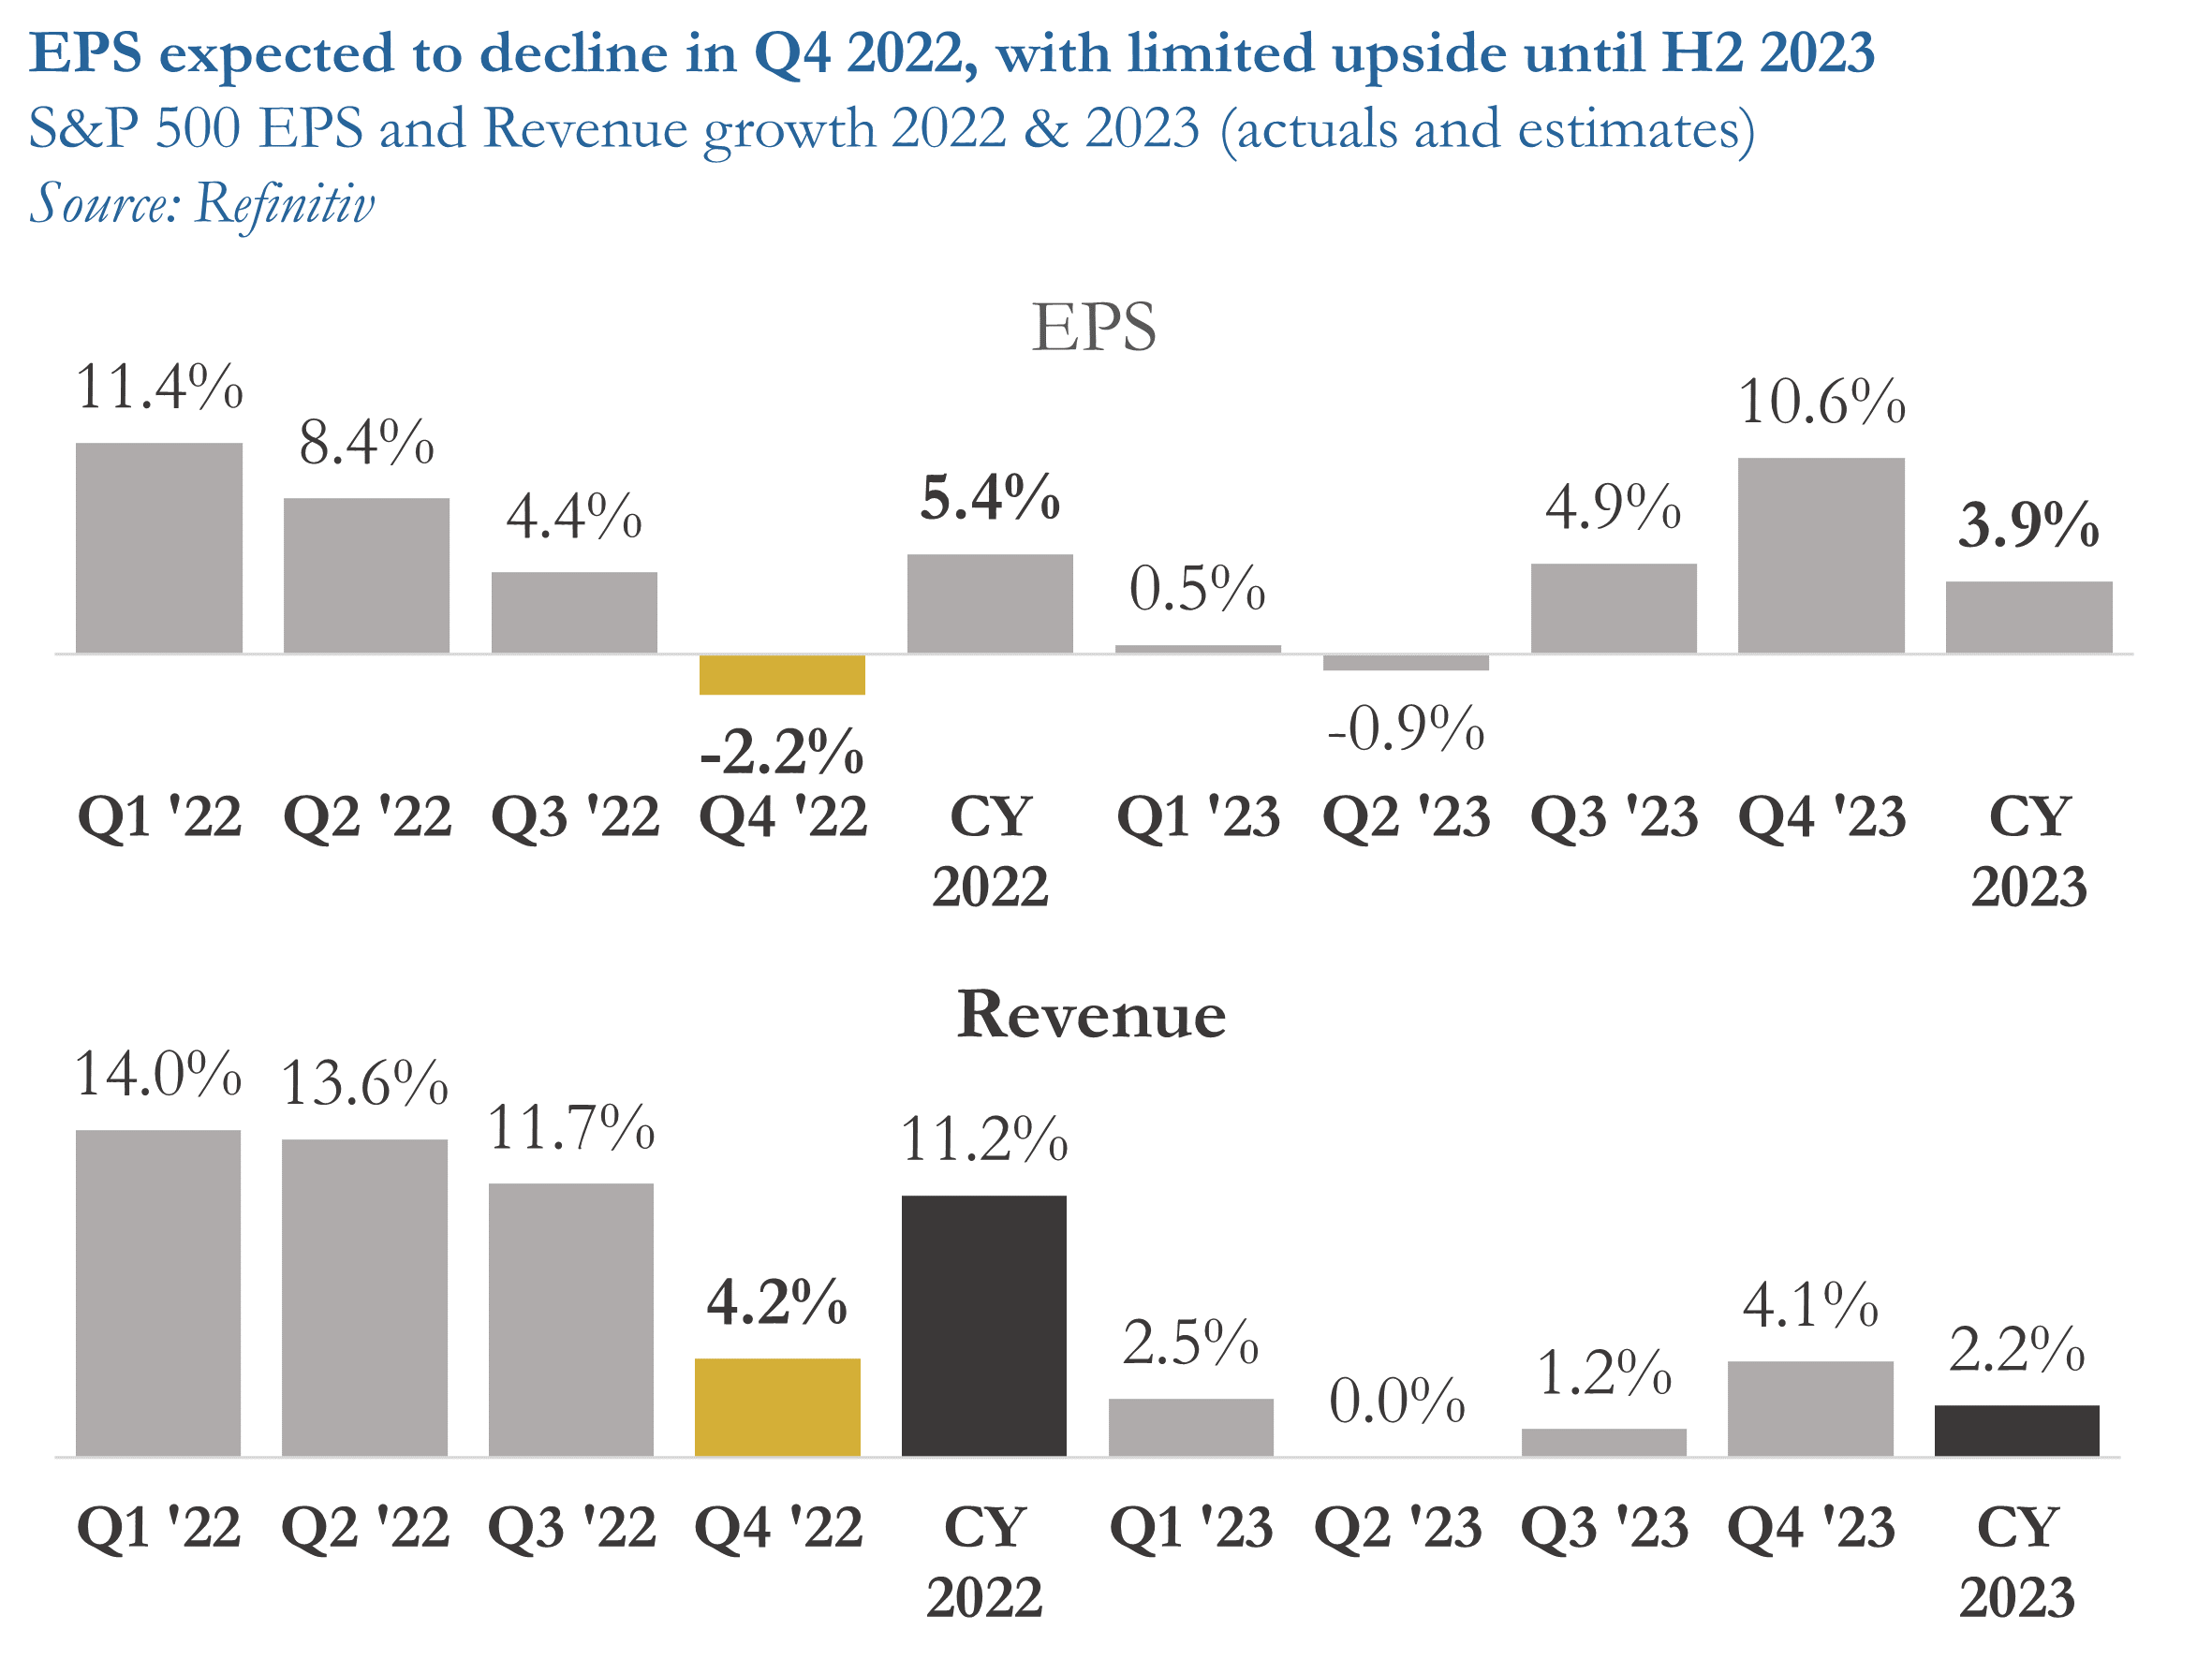
2. Expected EPS & Revenue Growth
Analysts predict that earnings for the S&P 500 will decline by 2.2% in Q4 2022. Excluding the energy sector, the figure falls to -6.6%.
The earnings growth rate for 2023 is projected at 4%, lower than the 9% average seen over the last decade. Earnings are expected to increase year-over-year in 7 of the 11 sectors, with the Consumer Discretionary and Financials sectors leading the way. On the other hand, the Energy and Materials sectors are projected to see a decrease.
MARKET SENTIMENT
Measures of investor sentiment can be helpful as they provide insight into the views and opinions of professional or individual investors. However, it's important to note that these measures are not perfect predictors of market movements. They should be combined with other indicators and analysis tools to get a complete market picture.
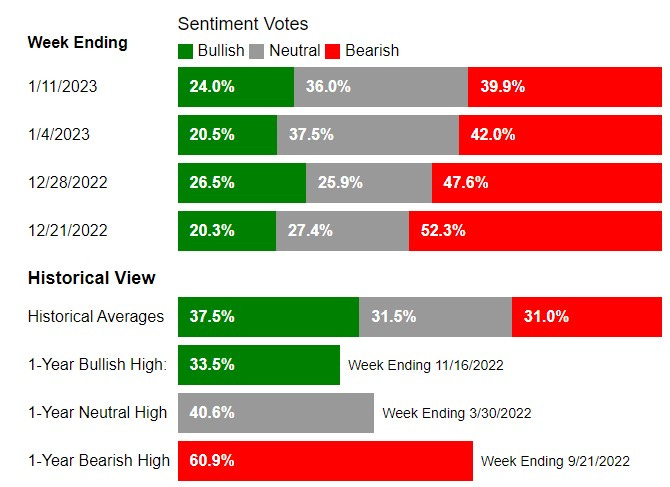
1. Individual Investors (AAII)
The American Association of Individual Investors (AAII) conducts a weekly survey among its members to gauge their expectations for the stock market over the next six months. The results of the survey are published every Wednesday.
According to the most recent AAII survey, 40% of the respondents had a bearish outlook on the stock market, a 2-point decrease from the previous week. The overall market sentiment still leans towards bearishness.
2. Institutional Investors (BofA Bull & Bear Indicator)
The Bank of America Bull-Bear Indicator is a proprietary measure of investor sentiment developed by Bank of America. It is based on a survey of fund managers and institutional investors, and it tracks the percentage of respondents who are bullish, bearish, or neutral on the stock market. Results are published in the form of a score ranging from 0 (extremely bearish) to 10 (extremely bullish)
The indicator is currently at 3.0, slightly improving from the previous week but indicating a primarily bearish sentiment among professional investors.

THE WEEK AHEAD
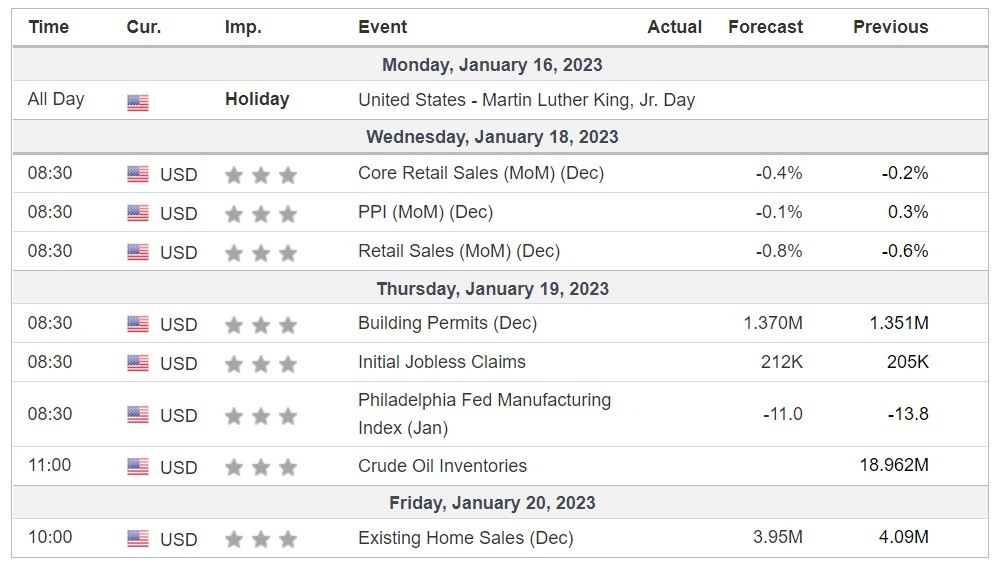
1. Economic Calendar
Next week, the spotlight will be on the consumer, with the Retail Sales data for December due on Wednesday. We will also get another inflation update with the Producer Price Index (PPI), which measures prices from manufacturers' points of view.
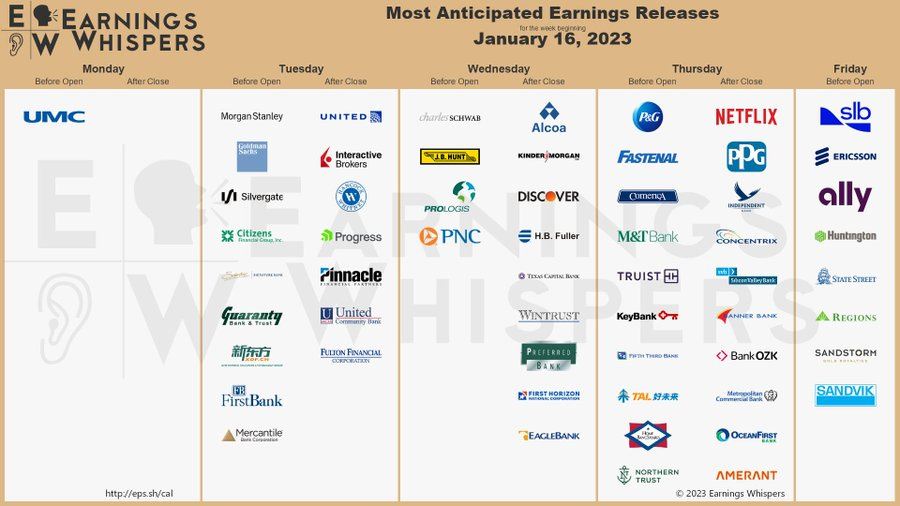
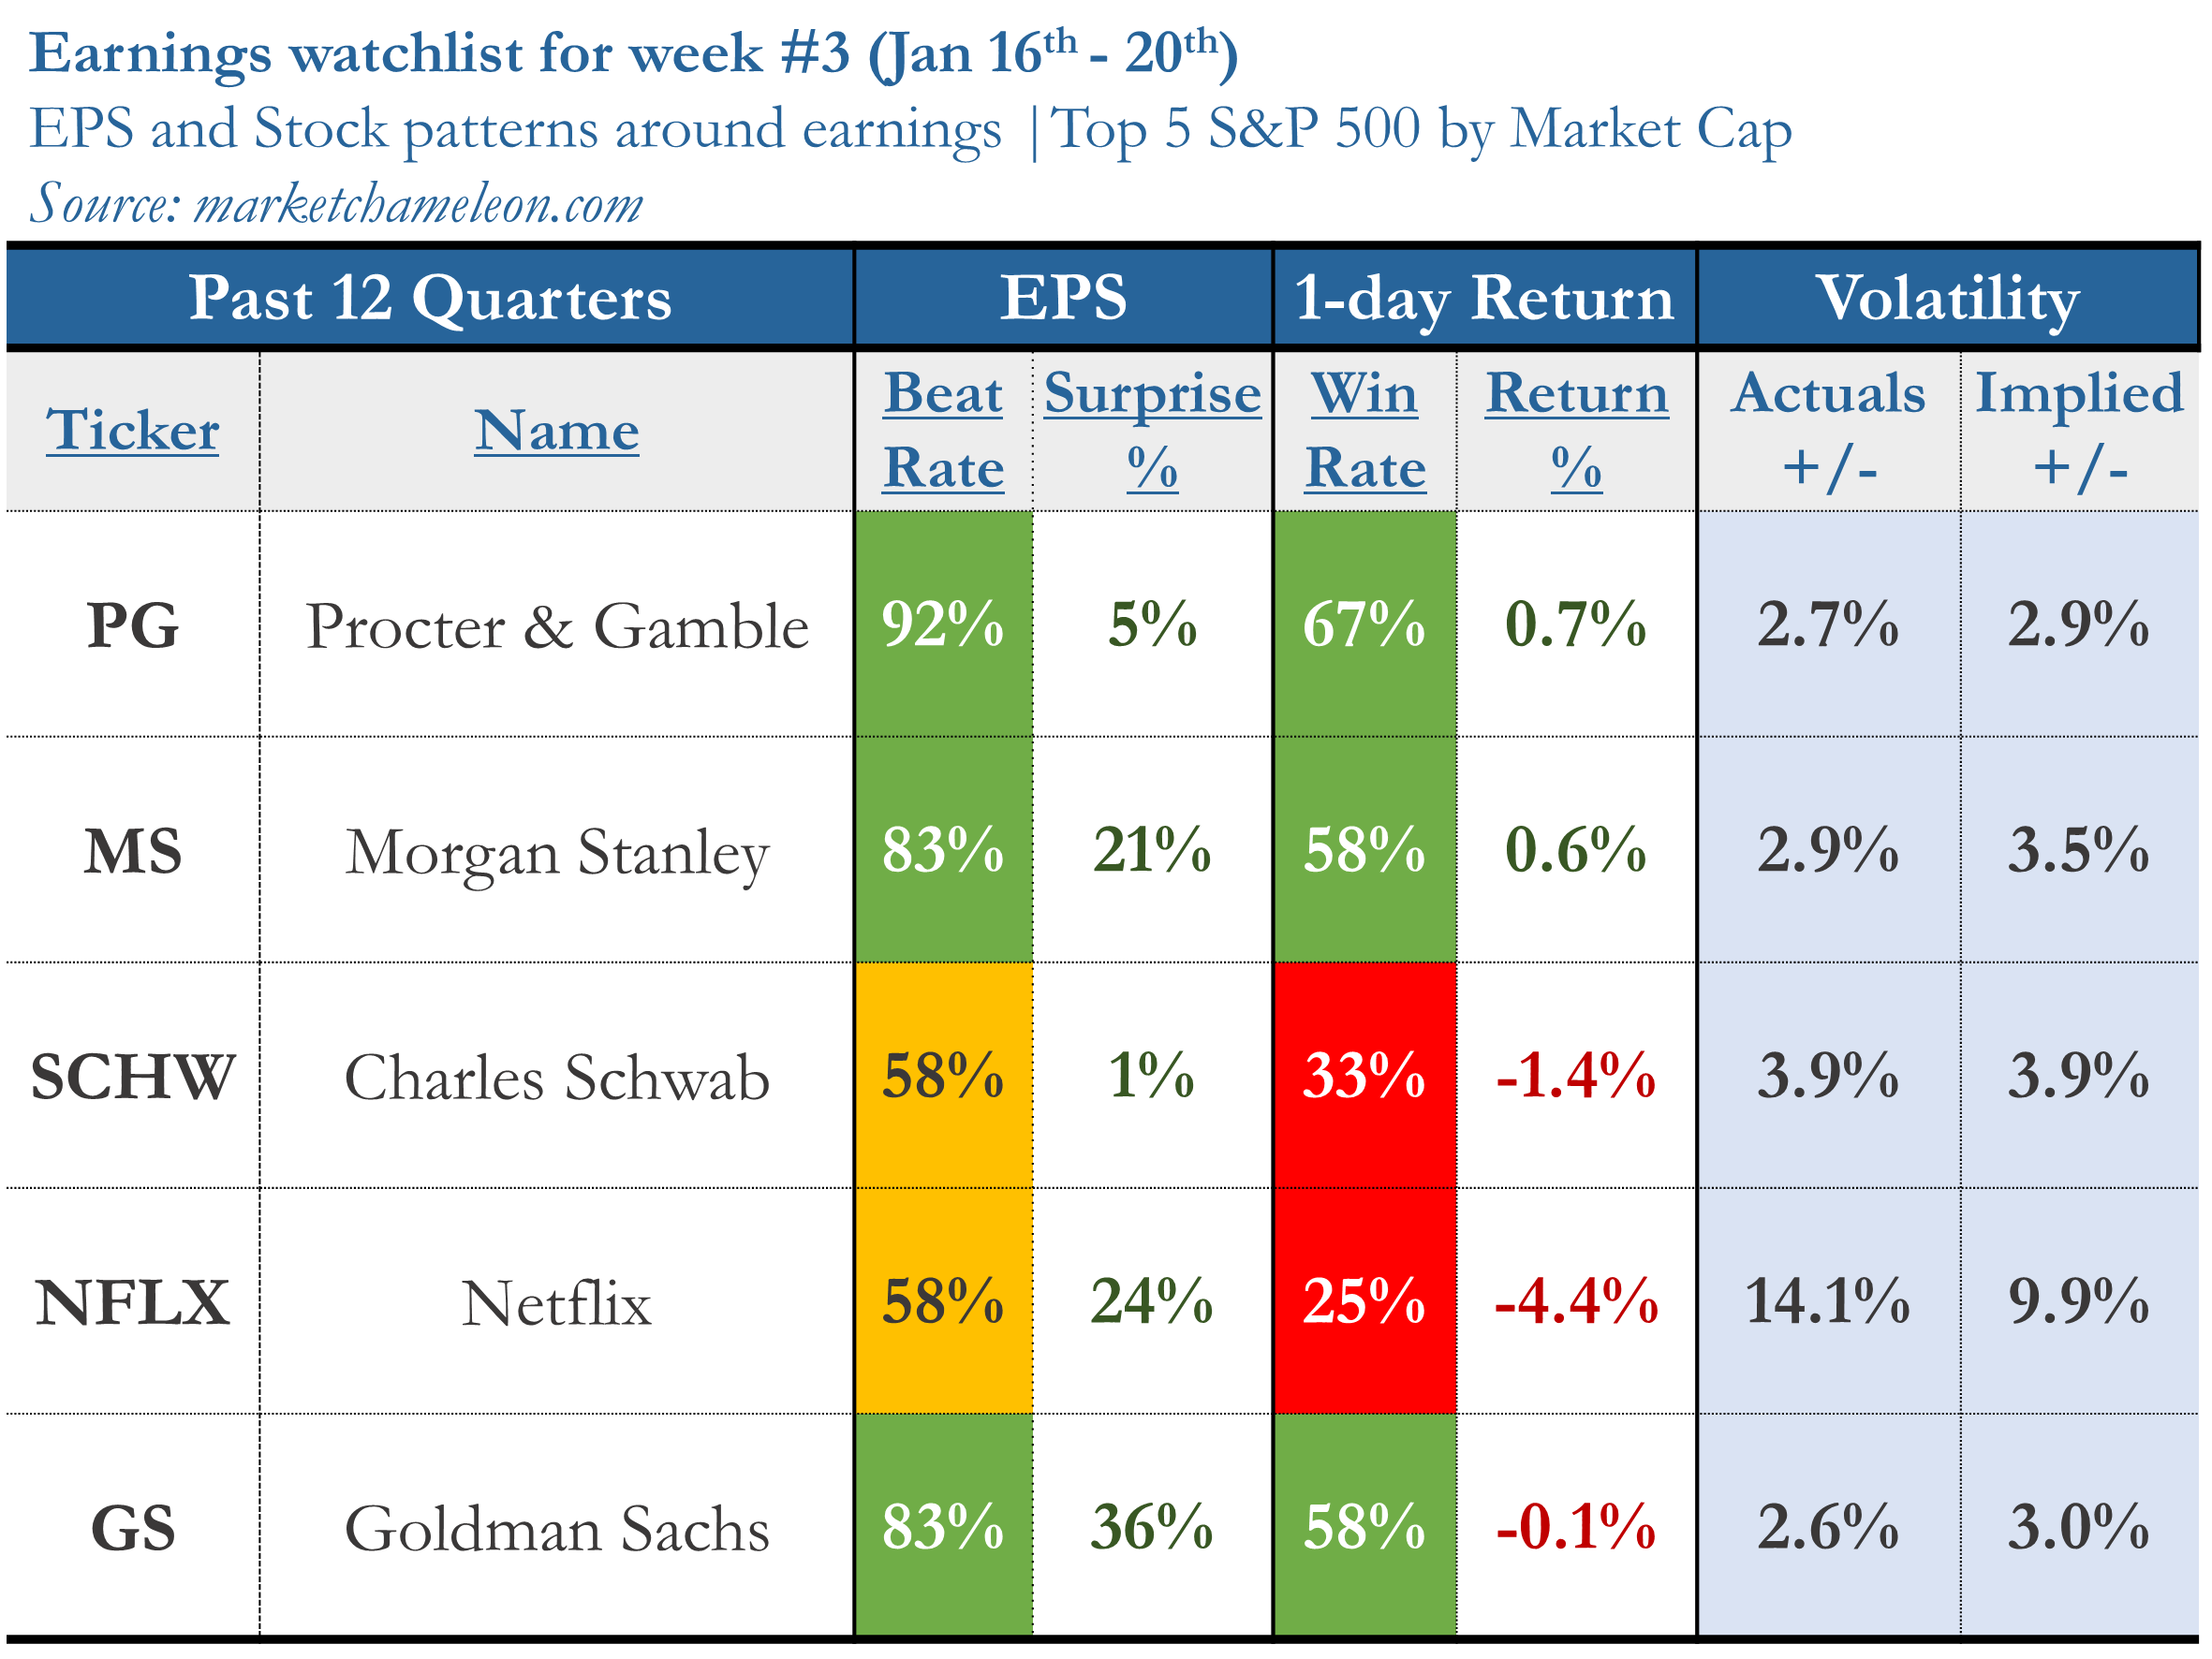
2. Earnings Calendar
26 companies from the S&P 500, including Procter & Gamble, Netflix, and Goldman Sachs, are set to report their quarterly earnings next week.
3. Next Week’s Earnings Watchlist
Thank you for reading my weekly market recap! I hope you found it helpful in understanding the stock markets better. If you did, please share this post with your friends and followers.
If you have any questions or feedback, please don't hesitate to reach out by email or in the comment section. Your support helps me to continue creating high-quality content and is greatly appreciated!
Have a great week!
My Weekly Stock
DISCLAIMER
The information provided in this newsletter is for informational purposes only and should not be taken as financial advice. Any investments or decisions made based on the information provided in this newsletter are the reader's sole responsibility. We recommend that readers conduct their own research and consult a qualified financial professional before making investment decisions. The author does not assume any responsibility for any losses or damages arising from using the information provided in this newsletter.