


Weekly Market Recap (Jul 7-11): Rally Cools Off, But the Bulls Aren’t Done Yet
Everything you need to know about last week's markets performance and what to expect next.
Dear readers,
Welcome back to My Weekly Stock, where in-depth market analysis meets proven momentum-based trading strategies. My mission? To help you win in the markets with unbiased, data-driven insights you can act on.
Friday means it's time to review the week in the markets. Each week, I dedicate hours to curating this market recap, preparing insightful analysis with clear visuals and a structured layout—making it easy for you to find exactly what you need, week after week. And because it's easy to get swayed by personal bias, I like to let the data do most of the talking.
If you want the full experience, consider upgrading your subscription. Paid members get access to all my portfolios, in-depth analysis, and a clear momentum-based framework you can follow and learn from.
Start today. Your first month is completely FREE. If you’re ready to give it a try—or just want to support my work—this is your chance!
Let's dive in!
SUMMARY
Here are this week's highlights and what to look out for next:
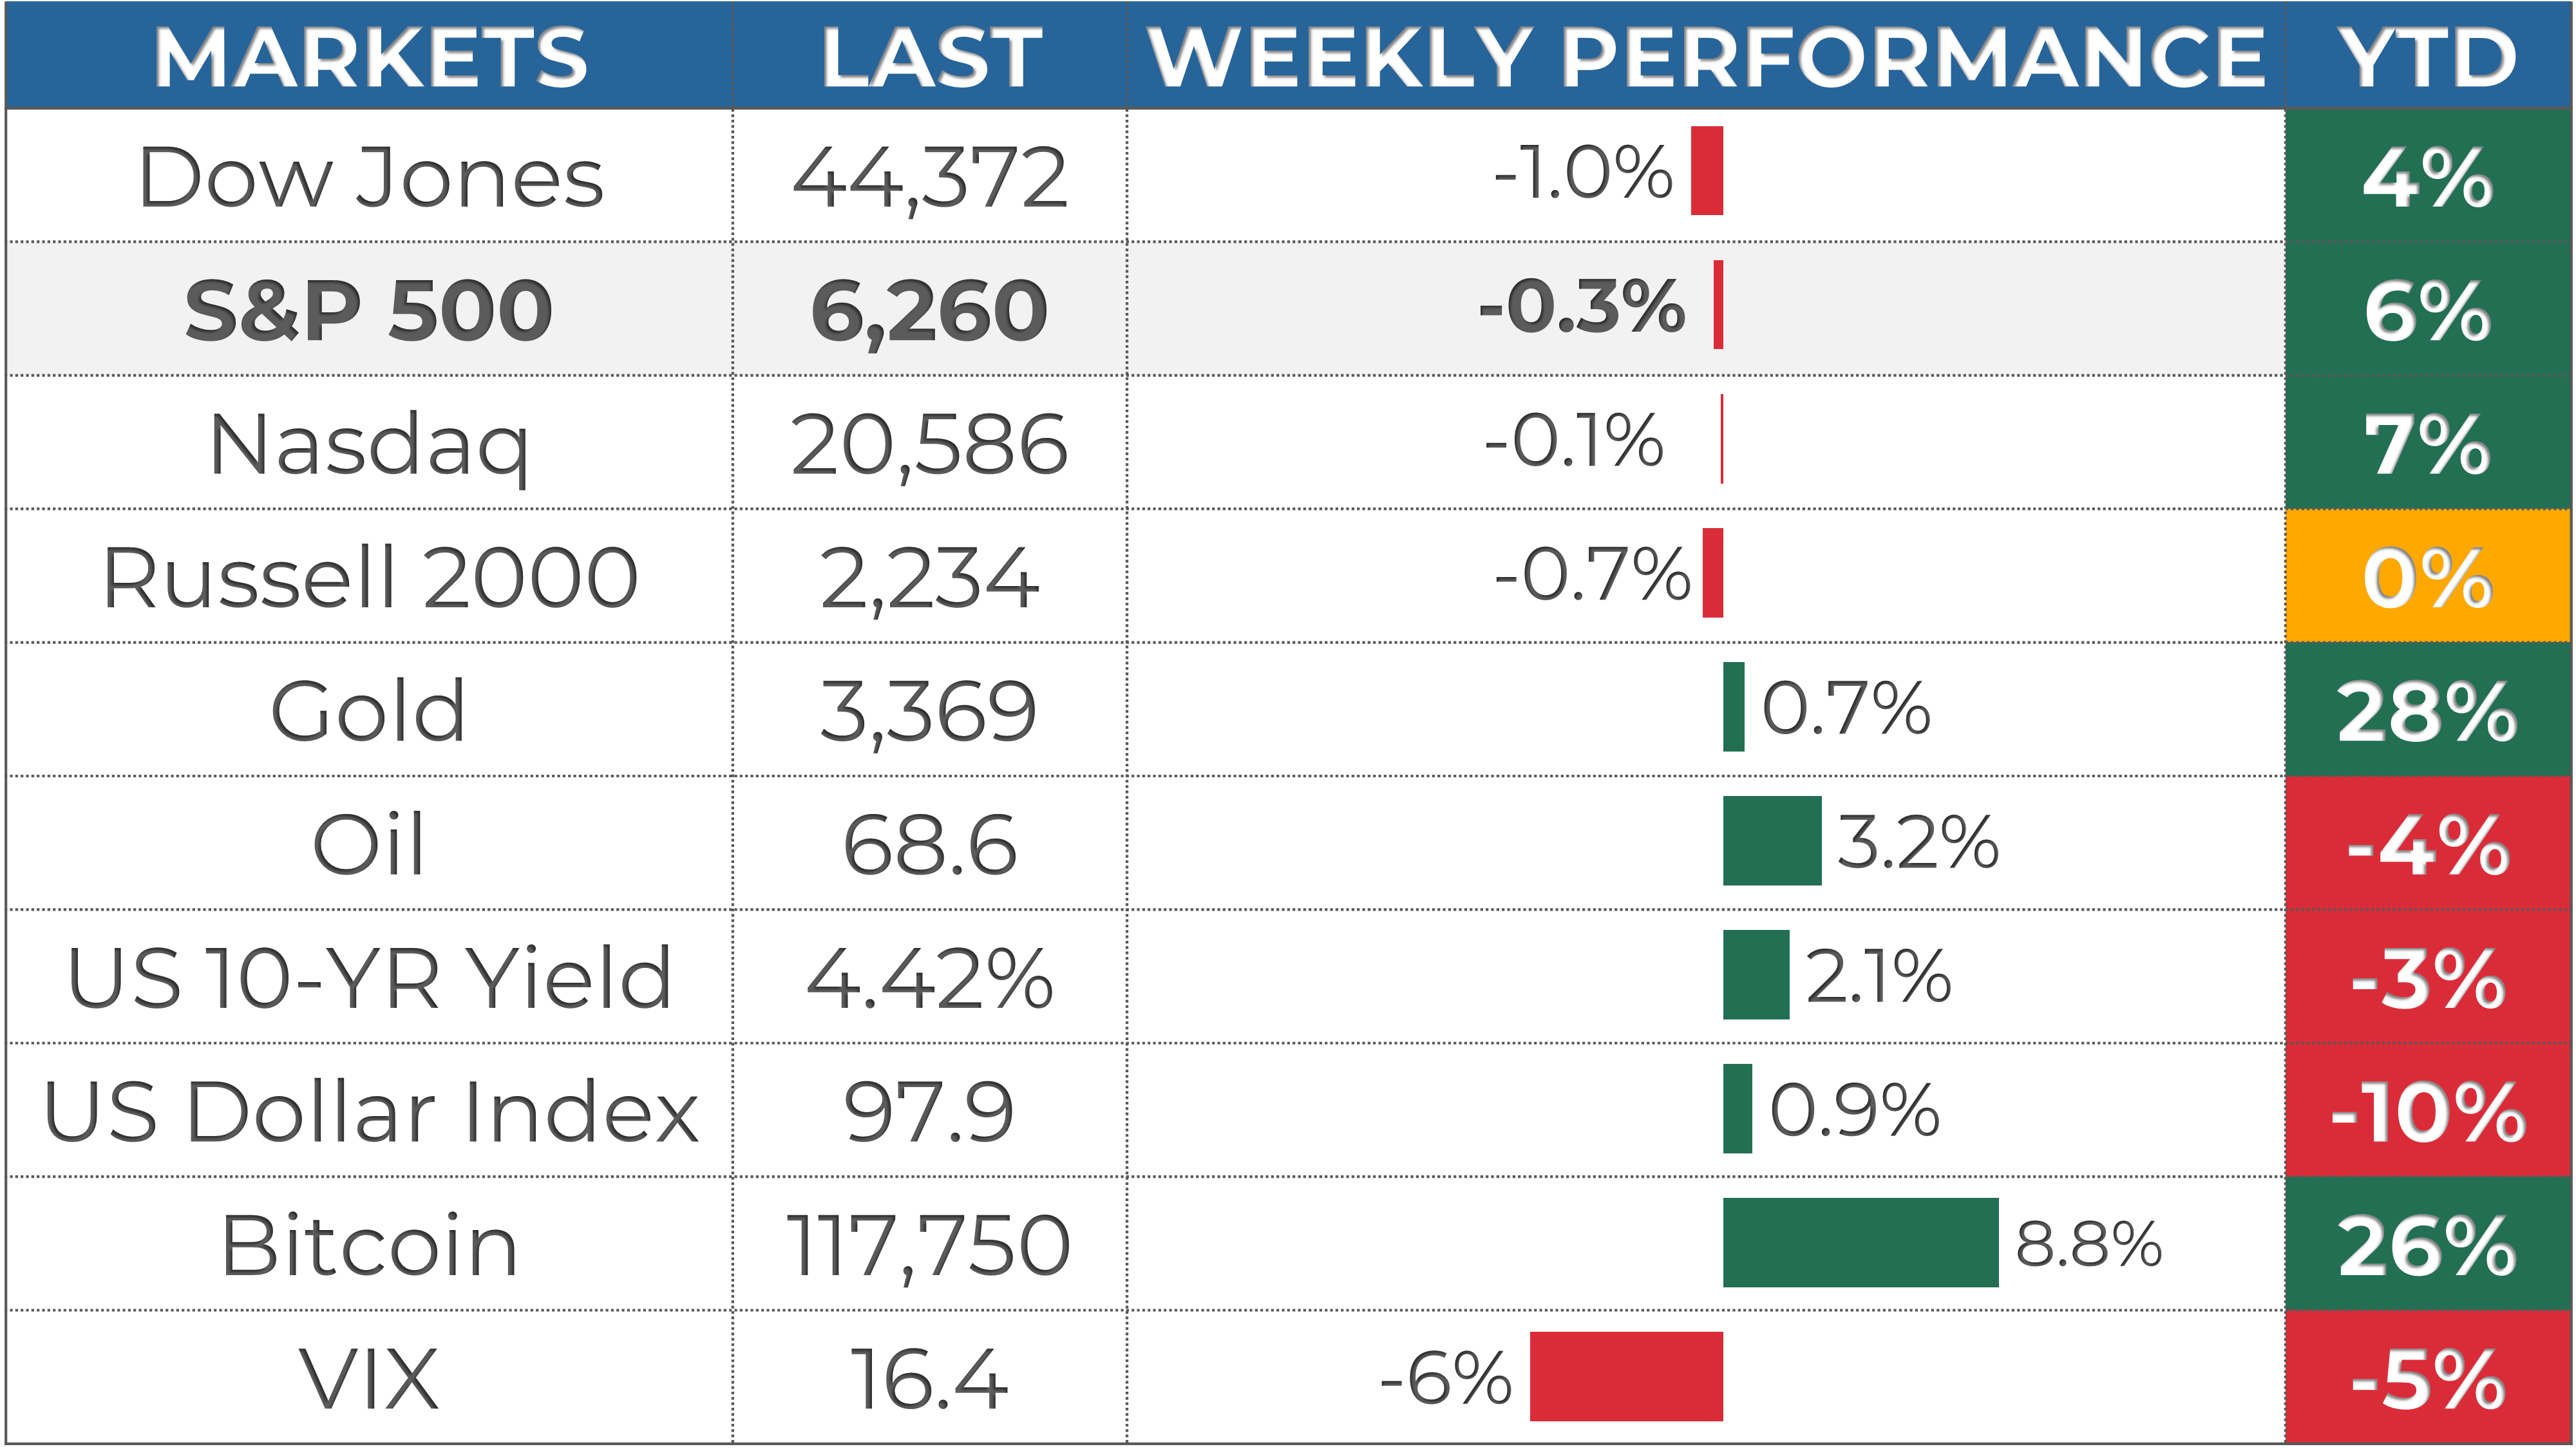
1. The markets were mixed this week, with the S&P 500 down -0.3%, the Nasdaq -0.1%, and the Dow Jones -1%. Energy (+2.4%) and Utilities (+0.8%) were the best-performing sectors.
2. The S&P 500's long-term trend is positive, and the short-term momentum is also positive. 6,300 is the next resistance, while 6,175 is support.
3. The Q2 earnings season is starting and 21 companies from the S&P 500 index have released their quarterly results, with 71% beating estimates. Earnings are expected to be up 6% in Q2 and 9% in 2025.
4. Market sentiment is at the "Extreme Greed" level (75/100) as measured by CNN’s Fear & Greed indicator, while VIX is at a medium value of 16.
5. Earnings report from JPMorgan and Netflix, the latest CPI, PPI reports and the Retail Sales data are scheduled for next week.
My take:
This week, I anticipated some market cooling, given the recent overextended rally. While volatility did make a comeback with a few bearish attempts, the pullbacks were shallow and quickly bought. In fact, the index still managed to reach a new record high on Thursday.
Looking ahead, I expect a potentially bumpier ride over the summer as the market digests the significant gains from April’s low. We will not be lacking reasons for short-term pressure with trade headlines, economic data, Federal Reserve communications, and the upcoming earnings season. However, unless we see a major breakdown, I view any pullback as a healthy consolidation and setting the stage for a continued rally.
PERFORMANCE RECAP
1. S&P 500 Sector Performance
This week, 5 out of the 11 S&P 500 sectors posted gains. Energy led the market with a 2.4% increase, while Financials was the laggard, dropping 1.9%.
Year-to-date, 9 sectors have achieved positive performance. Industrials is the top-performing sector with a 14 % gain, while Health Care lags behind, with a 1.7 % loss.

2. S&P 500 Top & Worst Performers
Over the last five trading days, 44% of the stocks in the S&P 500 index rose in value.
Top Performers:
$DAL (Delta Air Lines, Inc): 11.4%
$MRNA (Moderna Inc): 10.3%
$PTC (PTC Inc): 10%
$AES (AES Corp): 9.3%
$TPR (Tapestry Inc): 9.1%
Worst Performers:
$NOW (ServiceNow Inc): -10.2%
$ADSK (Autodesk Inc): -11.5%
$DDOG (Datadog Inc): -11.5%
$FSLR (First Solar Inc): -12.2%
$FICO (Fair Isaac Corp): -16.8%

In addition, 53 stocks within the S&P 500 reached a new 52-week high, while 7 stocks set new lows. The majority of this week’s highs came from the Technology sector.
Notable Highs:
$NVDA (NVIDIA Corp)
$MSFT (Microsoft Corporation)
$AVGO (Broadcom Inc)
$ORCL (Oracle Corp)
$MS (Morgan Stanley)
Notable Lows:
$ELV (Elevance Health Inc)
$PG (Procter & Gamble Co)
$MOH (Molina Healthcare Inc)
$CAG (Conagra Brands Inc)
$GIS (General Mills, Inc)

MARKET MOMENTUM
1. Momentum Review
To evaluate the market's current health, I examine 4 key elements: performance, breadth, trends, and key levels. Healthy bull markets typically feature indices setting new highs, broad market participation, and ascending trend lines.
Performance (POSITIVE 🟢): evaluating recent market performance to gauge the momentum’s strength. Ideally i want to see returns accelerating short-term and index trading less than 5% from its 1-year high
1-month performance: +3.4% 🟢
3-month performance: +13.7% 🟢
vs. 1-year high: -0.5%🟢
Breadth (POSITIVE 🟢): assessing market participation to understand the health of the trend. Extreme levels (above 80% or below 20%) may indicate overextended trends.
% of stocks above 200-day moving average: 68% (down from 80% last week) 🟢
% of stocks above 20-day moving average: 60% (down from 61% last week) 🟢
Trends: analyzing trend strength across multiple timeframes using exponential moving averages, scored on a scale of 1 to 5. A score of 3 or above suggests solid trends and supports holding a position.
Weekly chart: VERY STRONG ⭐️⭐️⭐️⭐️⭐️ (stable vs last week)

Daily chart: VERY STRONG ⭐️⭐️⭐️⭐️⭐️ (stable vs last week)

4-hour chart: STRONG ⭐️⭐️⭐️⭐️ (worst vs last week)

Key levels: identifying critical price zones to confirm the current trend or signal a potential reversal.
Support:
5,920 (-5.4%)
6,050 (-3.4%)
6,175 (-1.4%)
Resistance:
6,300 (+0.6%)
6,490 (+3.7%)
6,700 (+7.0%)
2. Post of the Week
This week's momentum analysis is about the S&P 500 stocks trading the most above or below their 200-day moving average. The 200-day moving average is a powerful indicator that calculates the average price of a stock over the past 200 trading days. It acts like a "smoothing tool," reducing short-term market noise and giving us a clear view of the long-term trend.
EARNINGS & ECONOMIC REPORTS RECAP
1. Economic Reports
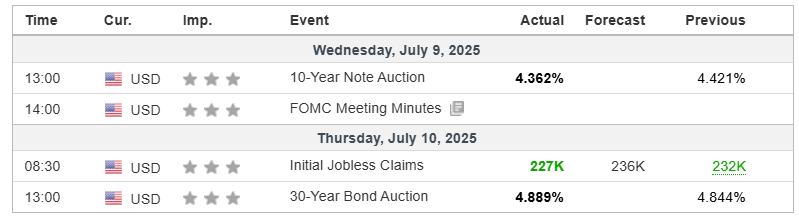
It was a calm week on the economic front, with limited data releases. Key events included the FOMC meeting minutes and Treasury bond auctions. The minutes revealed a divided Fed, though most members see some easing later this year as appropriate. The current consensus points to two 25bps cuts by year-end.
2. Earnings Outlook
Q2 Earnings: S&P 500 earnings are expected to grow by 6%, rising to 8% when excluding the energy sector.
2025 Full-Year Outlook: Earnings are expected to increase by 9%, in line with the 10-year average growth of 9%.
Analyst Revisions: Over the past month, 54% of all earnings revisions by analysts have been upward adjustments to their outlook.
Valuation: The forward 4-quarter P/E ratio stands at 22.4, above the 5-year and 10-year historical averages.

3. Earnings Season Recap
Out of the 21 S&P 500 companies that have reported second-quarter earnings, 71% exceeded EPS expectations. It is below with the four-quarter average of 77% and above the historical average of 67%.
Below are some notable companies that reported earnings last week. I’ve highlighted their EPS and revenue performance vs estimate, as well as their stock return this week.
One highlight of the week was Delta Air Lines ($DAL), which soared 11% for the week after beating Revenue and EPS estimates.
MARKET SENTIMENT
Measures of investor sentiment can be helpful as they provide insight into the views and opinions of professional or individual investors. While not definitive predictors of market direction, these measures can serve as a valuable complement to other indicators and analysis tools, helping to paint a more comprehensive picture of the market's current state.
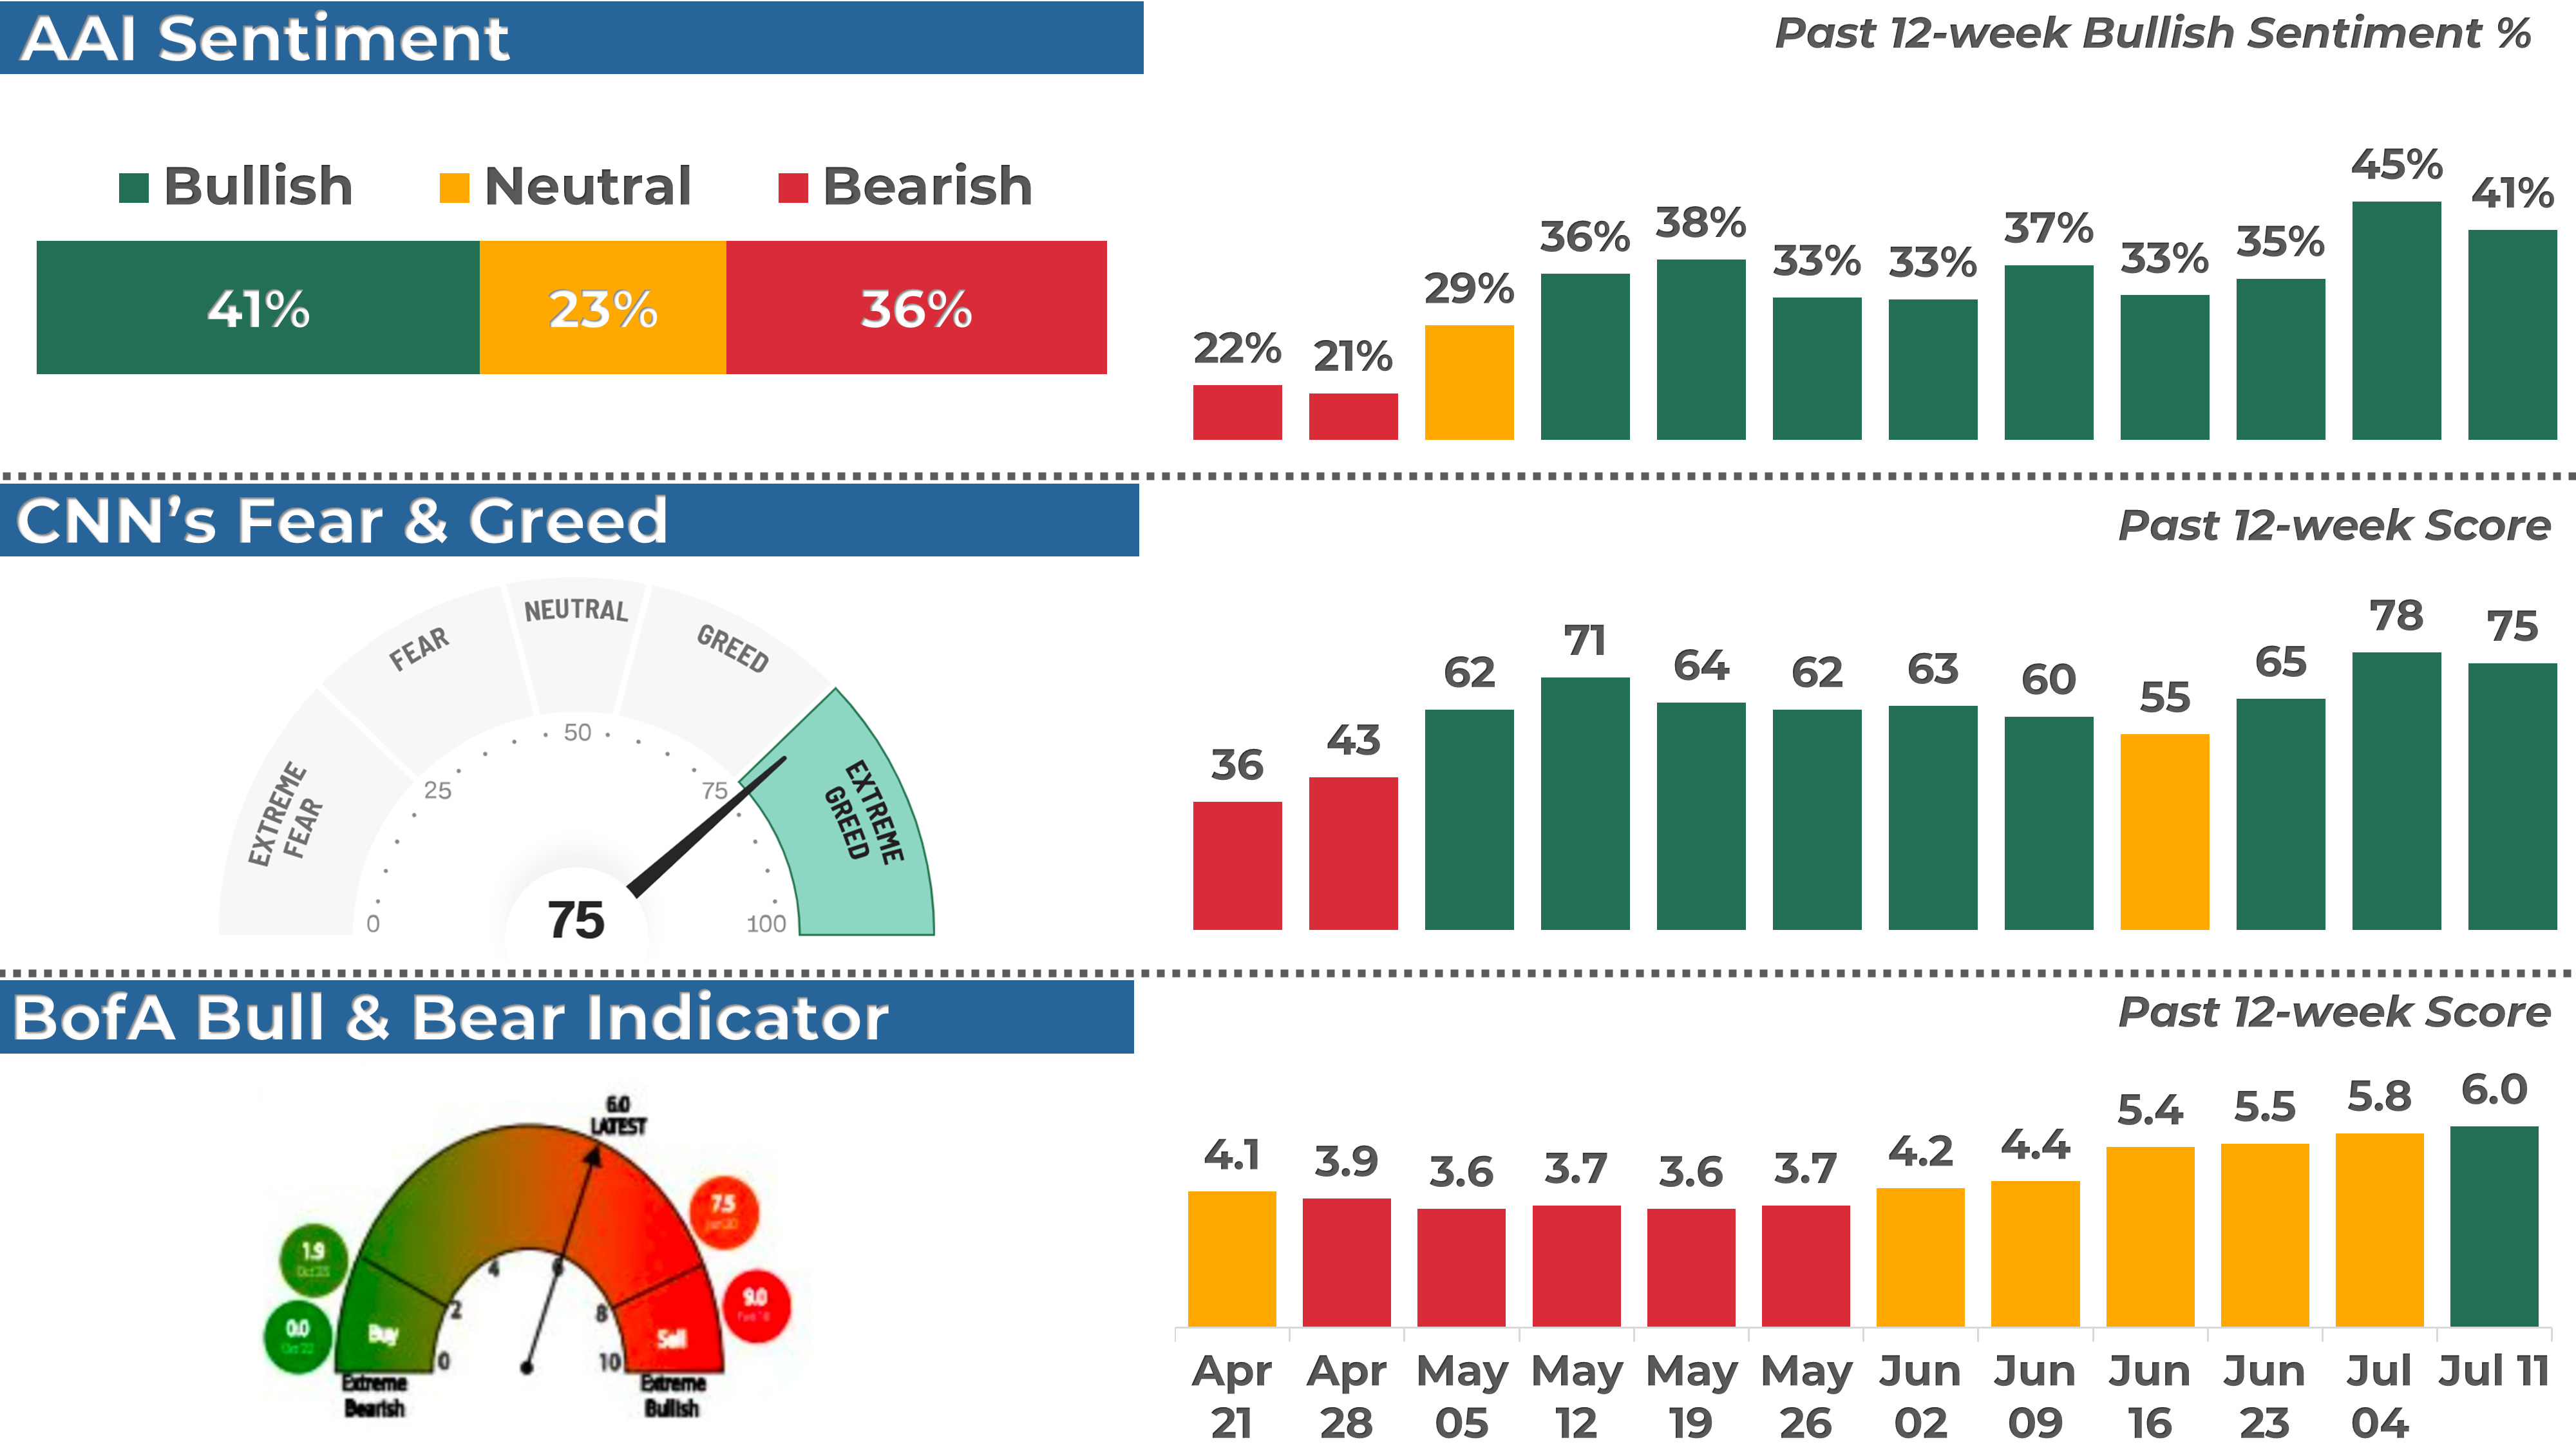
1. AAII Sentiment Survey (Individual Investors)
The American Association of Individual Investors (AAII) conducts a weekly survey to gauge members' expectations for the stock market over the next six months. Results are published every Wednesday.
In the latest survey, 41% of respondents had a bullish outlook, down from 45% the previous week.
2. BofA Bull & Bear Indicator (Institutional Investors)
The Bank of America Bull-Bear Indicator measures investor sentiment based on fund managers' and institutional investors' views. Scores range from 0 (extremely bearish) to 10 (extremely bullish).
The most recent reading was 6.0, a slightly bullish sentiment reading.
3. CNN Fear & Greed Index (Technical)
This daily measure analyzes seven indicators to assess how emotions drive market decisions. Scores range from Extreme Fear to Extreme Greed.
The index closed at 75 (Extreme Greed), down from 78 last Friday.
THE WEEK AHEAD
1. Economic Calendar
It’s shaping up to be a packed week, with several important inflation and consumer-related data releases.
Key reports to watch:
CPI (Tue): Headline inflation is expected to rise 0.3% MoM (previous month: 0.1%), while Core CPI is also forecast at 0.3% MoM (previous: 0.1%). The YoY CPI stood at 2.4% last month.
PPI (Wed): Producer prices are forecast to increase 0.2% MoM, up from last month’s 0.1%.
Retail Sales (Thu): Headline sales are expected to be flat MoM growth (previous: -0.9%), while Core Retail Sales are forecast to rebound to +0.3% MoM (previous: -0.3%).

2. Earnings Calendar
The earnings season is starting and 37 company from the S&P 500, including JPMorgan and Netflix, are expected to release their quarterly results.
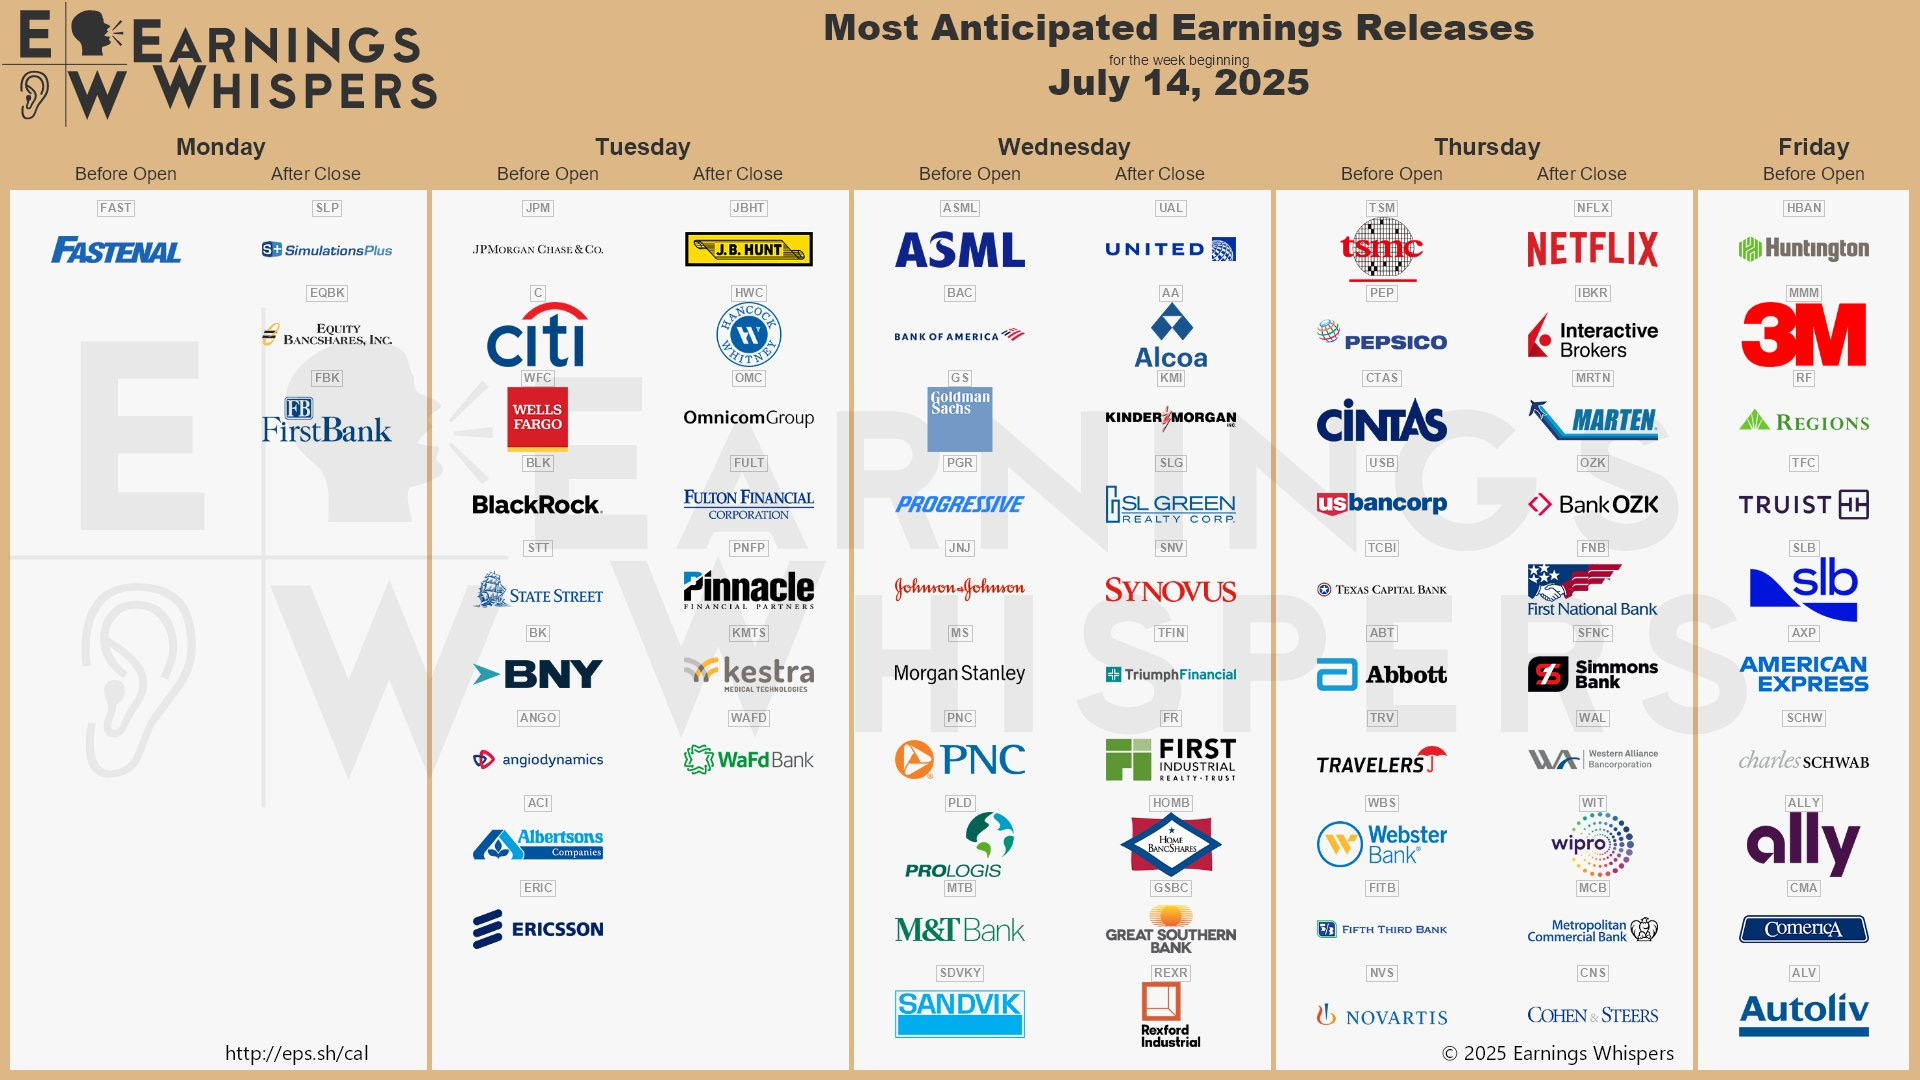
Below are notable stocks reporting earnings next week, along with several key indicators I like to monitor:
Stock Indicators:
3-Month Performance: Assessing recent stock trends.
RSI (Relative Strength Index): A reading above 70 suggests overbought conditions, while below 30 indicates oversold.
P/E Ratio: A value below 25 often points to a "cheap" valuation or low growth expectations.
Stock Price Reactions to Earnings:
1-Day Stock Return on Earnings: How the stock performs on its earnings release day.
Implied Volatility: The options market's forecast for the expected 1-day stock move after earnings.

3. Stock Analysis of the Week
Every week, I share my analysis of 1 stock that has reported earnings in recent weeks, focusing on implications for long-term investors. This week, I prepared an analysis of Delta Air Lines ($DAL).
👨💻 My View:
Delta had a rough start to the year, dropping nearly 50% at the April lows. Since then, the stock has staged a solid recovery in sync with the broader market, but momentum stalled right at the 30-week EMA.
For two months, $DAL has been stuck in a tight range, failing to hold any breakout attempts above the trend line. That changed this week, thanks to a strong earnings report that finally launched the stock.
If this breakout holds, it could signal the start of a broader recovery and possibly lead to a retracement of the Q1 losses.
Check out the post for more details about $DAL performance, trend and key levels.
Community Spotlight
This week, I'm glad to feature
, who trades stock options and futures with a 70% win rate. He manually scroll through 200+ stocks each day and provide trade ideas everyday for my members so they don’t have to search for them! And he also share educational posts on trading strategies
CONCLUSION
Thank you for reading my Weekly Market Recap, which, I hope, got you ready for the week ahead.
If you want to take your investing journey to the next level, consider upgrading to a paid subscription. Subscribe now and learn more about my holistic, end-to-end momentum approach to investing.
Your first month is free, so this is the perfect opportunity to explore the full value of My Weekly Stock with no commitment!
Thanks again, and I look forward to sharing my market recap with you next week.
Happy investing!
My Weekly Stock
DISCLAIMER
The information provided in this newsletter is for informational purposes only and should not be taken as financial advice. Any investments or decisions made based on the information provided in this newsletter are the reader's sole responsibility. We recommend that readers conduct their own research and consult a qualified financial professional before making investment decisions. The author does not assume any responsibility for any losses or damages arising from using the information provided in this newsletter.
Thanks for the mention!! Have a good weekend👊