


Weekly Market Recap (Jun 16-20): S&P 500 Coiled in a Tight Range – Breakout Coming?
Everything you need to know about last week's markets performance and what to expect next.
Dear readers,
Welcome back to My Weekly Stock, where in-depth market analysis meets proven momentum-based trading strategies. My mission? To help you win in the markets with unbiased, data-driven insights you can act on.
Friday means it's time to review the week in the markets. Each week, I dedicate hours to curating this market recap, preparing insightful analysis with clear visuals and a structured layout—making it easy for you to find exactly what you need, week after week. And because it's easy to get swayed by personal bias, I like to let the data do most of the talking.
If you want the full experience, consider upgrading your subscription. Paid members get access to all my portfolios, in-depth analysis, and a clear momentum-based framework you can follow and learn from.
Start today. Your first month is completely FREE. If you’re ready to give it a try—or just want to support my work—this is your chance!
Let's dive in!
SUMMARY
Here are this week's highlights and what to look out for next:
1. The markets were mixed this week, with the S&P 500 down 0.2%, the Nasdaq up 0.2%, and the Dow Jones flat. Energy (+1%) and Financials (+0.8%) were the best-performing sectors.
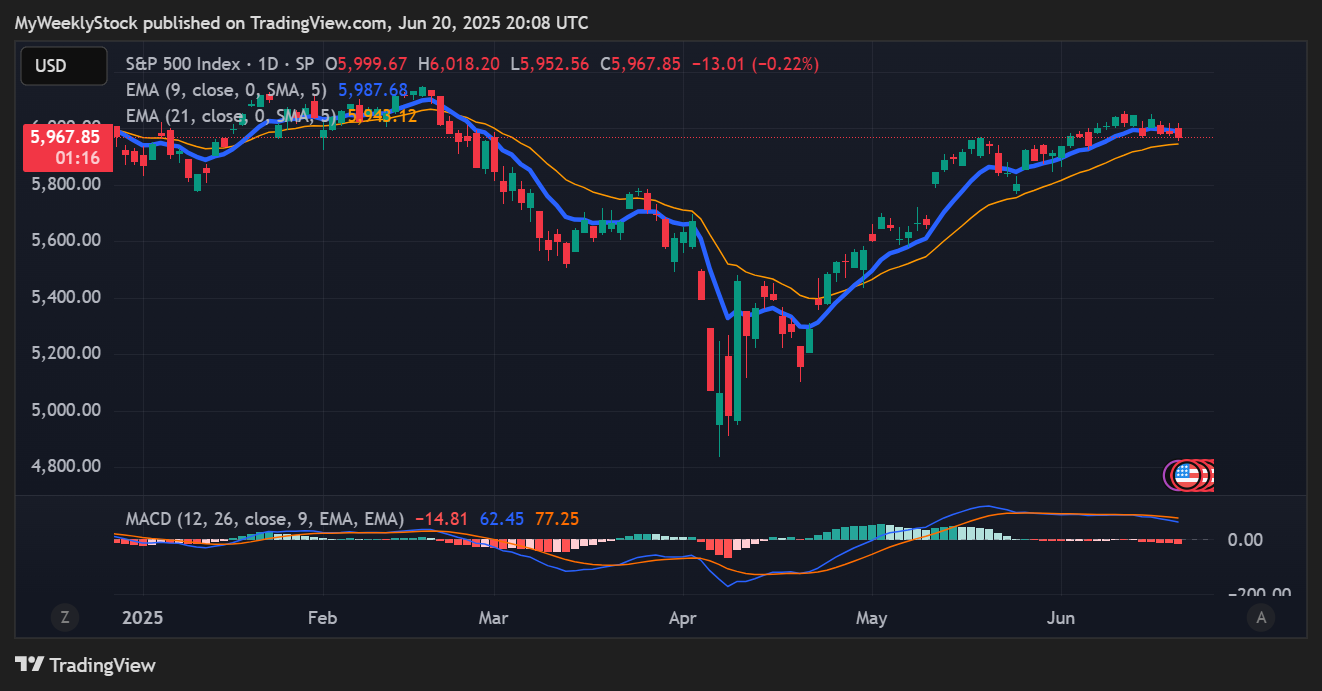
2. The S&P 500's long-term trend is positive, and the short-term momentum is mixed. 6,060 is the next resistance, while 5,920 is support.
3. The Q1 earnings season is almost over and 498 companies from the S&P 500 index have released their quarterly results, with 76% beating estimates. Earnings are expected to be up 14% in Q1 and 8% in 2025.
4. Market sentiment is at the "Neutral" level (55/100) as measured by CNN’s Fear & Greed indicator, while VIX is at a high value of 21.
5. Earnings report from Micron and Nike, the latest PCE price index and Q1 GDP data are scheduled for next week.
My take:
I prefer not to draw too many conclusions from this holiday-shortened week, especially since there was no meaningful breakout or breakdown. The S&P 500 remains stuck in its three-week range, leaving bulls and bears in a temporary stalemate.
There are still too many unresolved risks weighing on sentiment, so we can expect more intraday swings for the time being. That said, the index appears increasingly coiled, and a significant directional move is coming sooner rather than later.
As always, the best approach in this type of environment is to stay focused on the trend and key levels. And the long-term trend remains healthy, and as long as we hold above 5,920, I still see this as a pause within a broader uptrend.
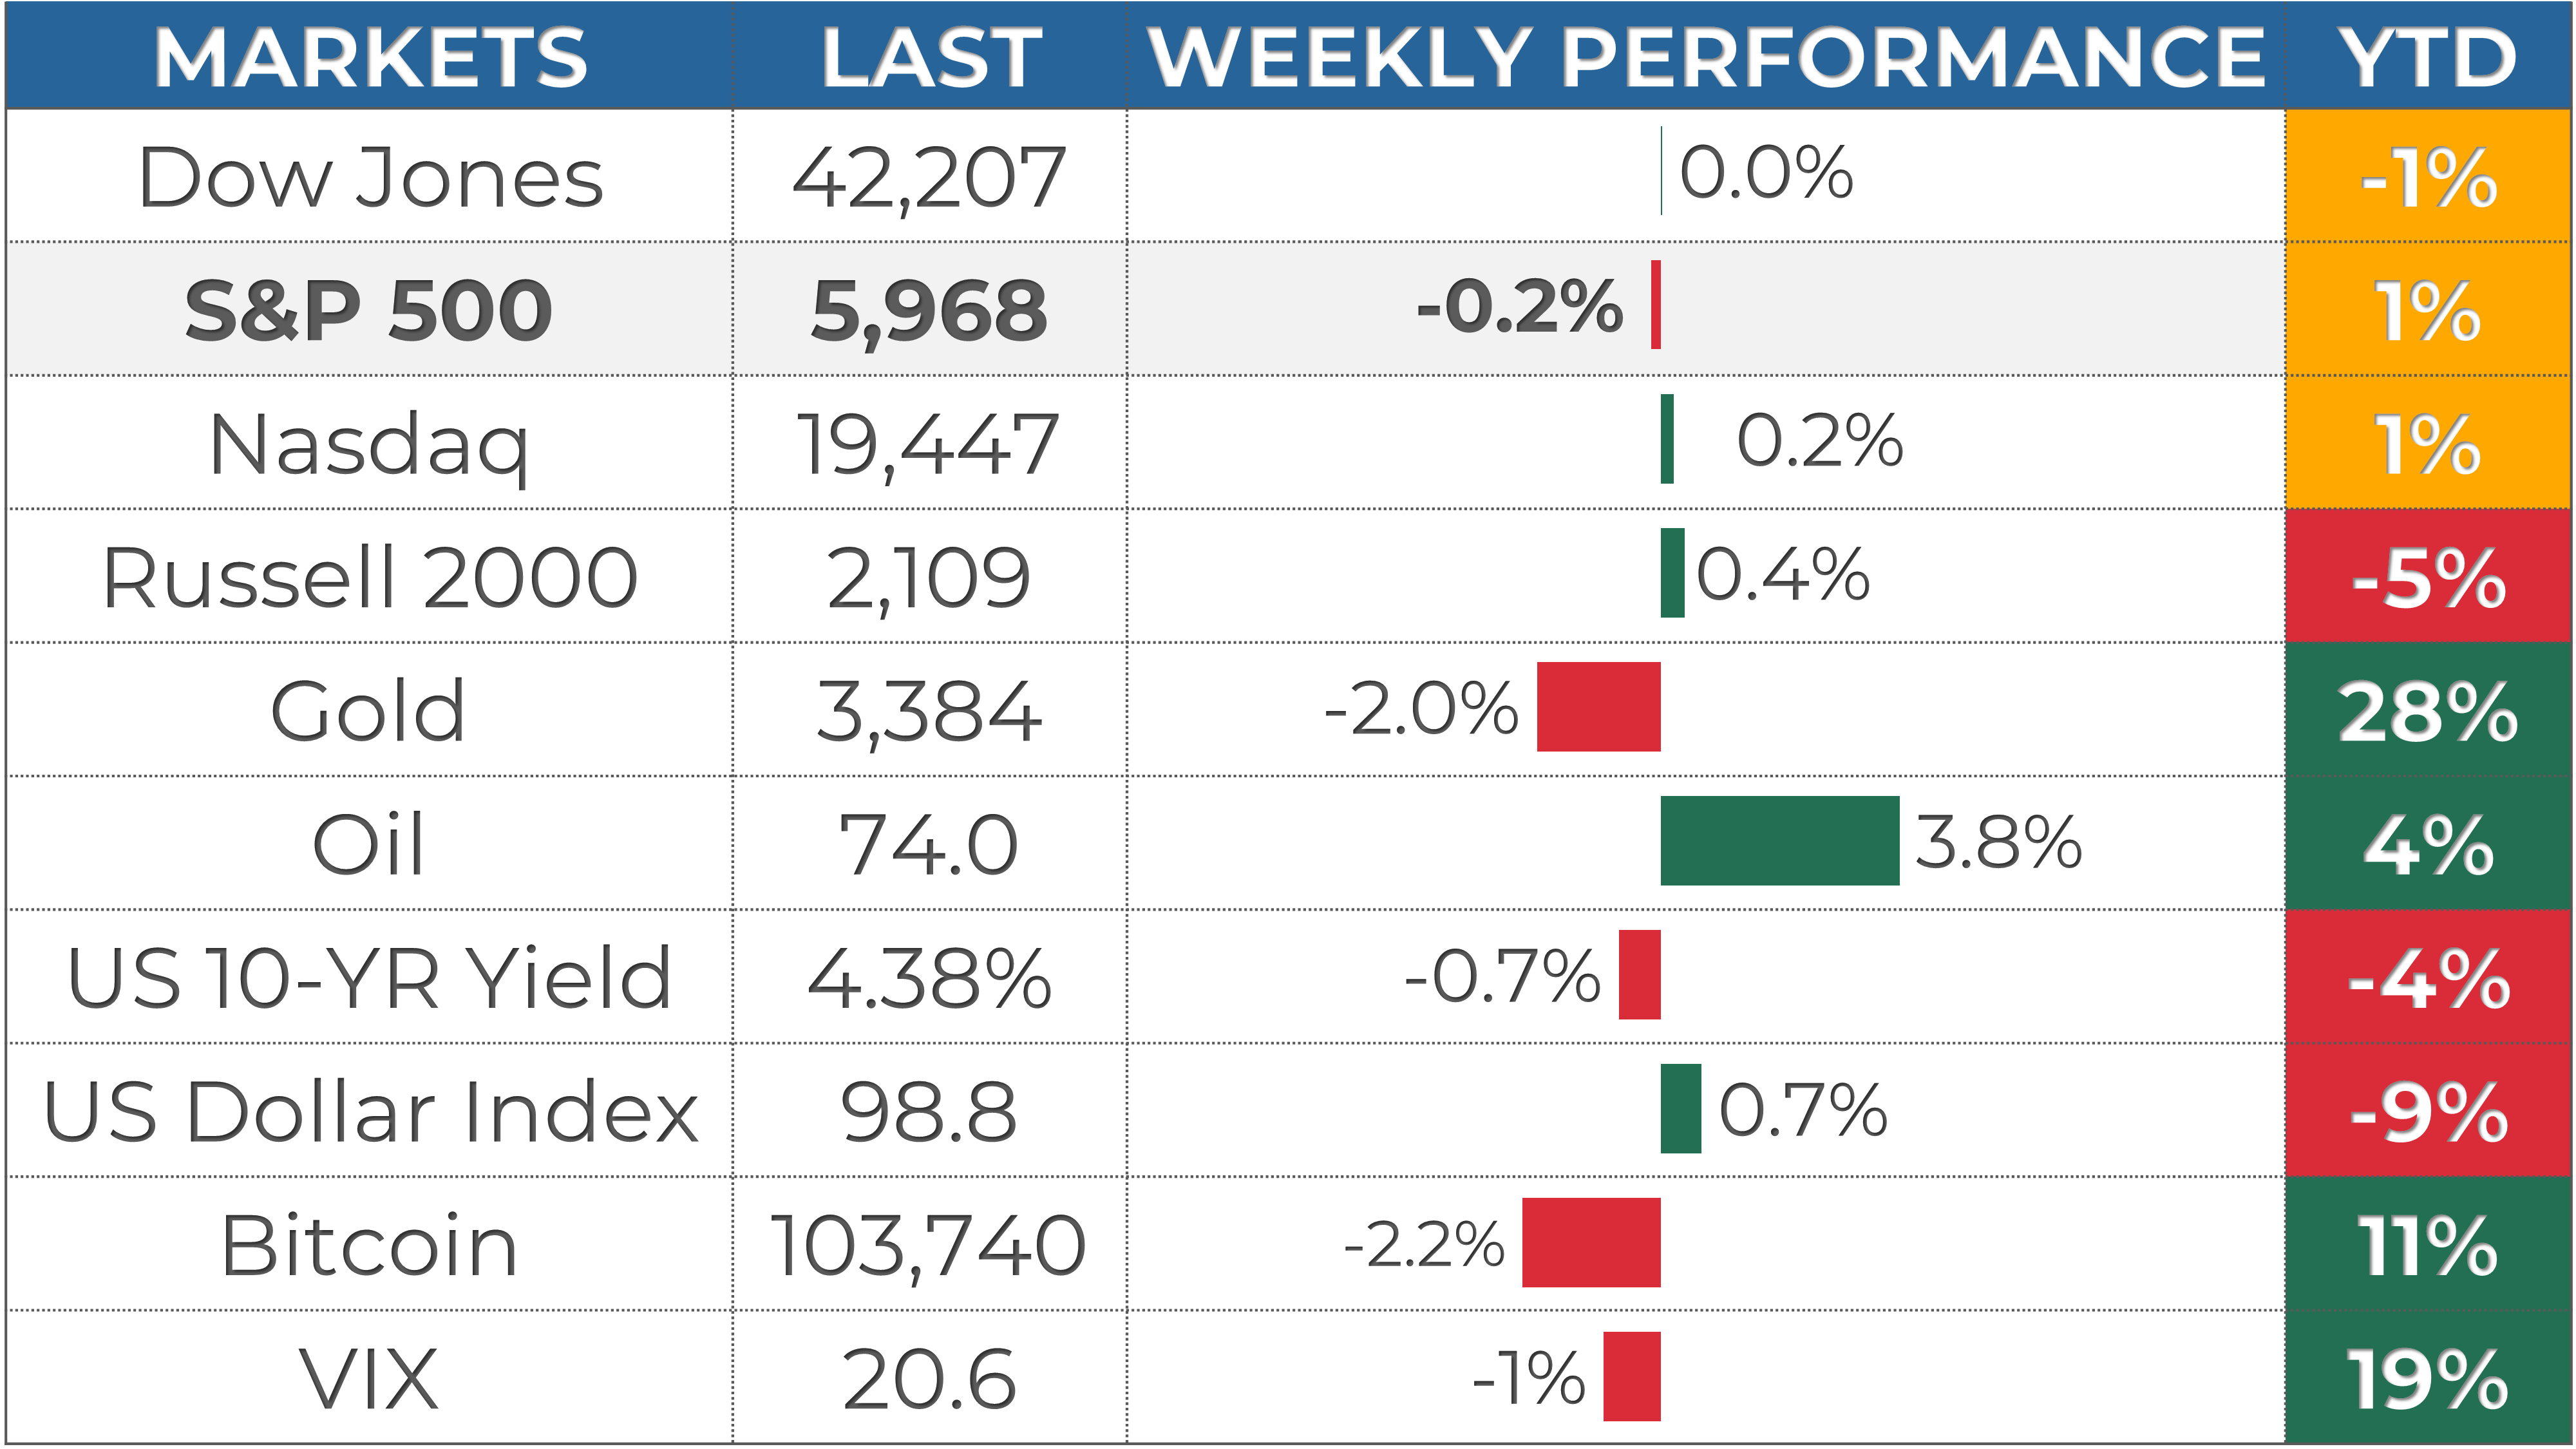
PERFORMANCE RECAP
1. S&P 500 Sector Performance
This week, 5 out of the 11 S&P 500 sectors posted gains. Energy led the market with a 1% increase, while Health Care was the laggard, dropping 2.6%.
Year-to-date, 9 sectors have achieved positive performance. Industrials is the top-performing sector with a 8.1 % gain, while Consumer Cyclical lags behind, with a 6.1% loss.

2. S&P 500 Top & Worst Performers
Over the last five trading days, 28% of the stocks in the S&P 500 index rose in value.
Top Performers:
$COIN (Coinbase Global Inc): 27.9%
$JBL (Jabil Inc): 15.1%
$BG (Bunge Global SA): 10.8%
$KR (Kroger Co): 10.6%
$EQT (EQT Corp): 8.8%
Worst Performers:
$AES (AES Corp): -9.8%
$ANET (Arista Networks Inc): -9.9%
$ACN (Accenture plc): -10.3%
$FSLR (First Solar Inc): -13.6%
$ENPH (Enphase Energy Inc): -19.8%

In addition, 25 stocks within the S&P 500 reached a new 52-week high, while 15 stocks set new lows. The majority of this week’s highs came from the Technology sector.
Notable Highs:
$MSFT (Microsoft Corporation)
$PLTR (Palantir Technologies Inc)
$PM (Philip Morris International Inc)
$IBM (International Business Machines Corp)
$RTX (RTX Corp)
Notable Lows:
$TMO (Thermo Fisher Scientific Inc)
$CPRT (Copart, Inc)
$KHC (Kraft Heinz Co)
$PCG (PG&E Corp)
$STZ (Constellation Brands Inc)

MARKET MOMENTUM
1. Momentum Review
To evaluate the market's current health, I examine 4 key elements: performance, breadth, trends, and key levels. Healthy bull markets typically feature indices setting new highs, broad market participation, and ascending trend lines.
Performance (POSITIVE 🟢): evaluating recent market performance to gauge the momentum’s strength. Ideally i want to see returns accelerating short-term and index trading less than 5% from its 1-year high
1-month performance: +0.2% 🟡
3-month performance: +5.1% 🟢
vs. 1-year high: -3.1%🟢
Breadth (MIXED 🟡): assessing market participation to understand the health of the trend. Extreme levels (above 80% or below 20%) may indicate overextended trends.
% of stocks above 200-day moving average: 45% (down from 47% last week) 🟡
% of stocks above 20-day moving average: 46% (up from 40% last week) 🟡
Trends: analyzing trend strength across multiple timeframes using exponential moving averages, scored on a scale of 1 to 5. A score of 3 or above suggests solid trends and supports holding a position.
Weekly chart: STRONG ⭐️⭐️⭐️⭐️ (stable vs last week)

Daily chart: SOLID ⭐️⭐️⭐️ (worst than last week)
4-hour chart: MIXED⭐️⭐️ (worst than last week)

Key levels: identifying critical price zones to confirm the current trend or signal a potential reversal.
Support:
$5,780 (-3.1%)
$5,850 (-2.0%)
$5,920 (-0.8%)
Resistance:
6,060 (+1.5%)
$6,150 (+3.1%)
$6,250 (+4.7%)
2. Post of the Week
This week's momentum analysis focuses on extended trends in the S&P 500, employing the Relative Strength Index (RSI) to filter stocks. The RSI is a valuable tool for spotting stocks that are potentially "oversold" (RSI below 30) or "overbought" (RSI above 70). Although I wouldn't rely solely on RSI, it helps identify stocks in extended trends that may be approaching a turning point.
EARNINGS & ECONOMIC REPORTS RECAP
1. Earnings Outlook
Q1 Earnings: S&P 500 earnings are expected to grow by 14%, rising to 16% when excluding the energy sector.
2025 Full-Year Outlook: Earnings are expected to increase by 8%, slightly below the 10-year average growth of 9%.
Analyst Revisions: Over the past month, 56% of all earnings revisions by analysts have been upward adjustments to their outlook.
Valuation: The forward 4-quarter P/E ratio stands at 22.2, above the 5-year and 10-year historical averages.

2. Earnings Season Recap
Out of 498 S&P 500 companies that have reported first-quarter earnings, 76% exceeded EPS expectations. It is in line with the four-quarter average of 77% and above the historical average of 67%.
Below are some notable companies that reported earnings last week. I’ve highlighted their EPS and revenue performance vs estimate, as well as their stock return this week.
One highlight of the week was Kroger ($KR), which soared 10% on Friday after beating EPS estimates and raising its full-year forecast.

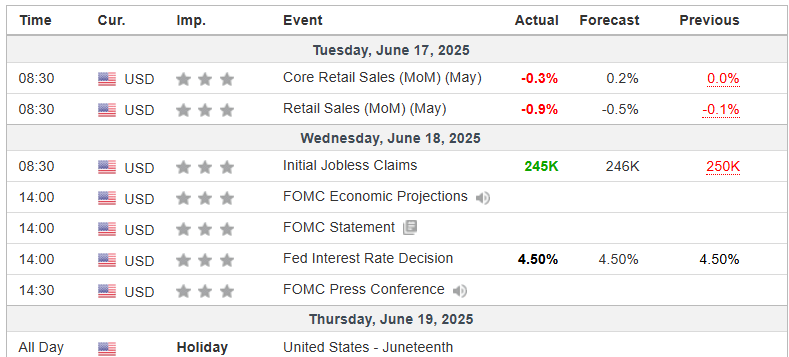
3. Economic Reports
It was a packed week despite a short trading schedule due to the Juneteenth holiday on Thursday. The spotlight was clearly on the Federal Reserve, with its policy decision and updated projections, while disappointing retail sales figures added to concerns over consumer strength.
Key reports included:
Retail Sales (Tue): Both headline and core figures came in well below expectations. Headline retail sales fell -0.9% MoM (vs. -0.5% expected), while core retail sales dropped -0.3% MoM (vs. +0.2% expected), pointing to a weak May for consumer spending.
FOMC Meeting (Wed): As expected, the Fed left its benchmark rate unchanged at 4.50%, but the updated projections of 2 cuts for the rest of the year.
MARKET SENTIMENT
Measures of investor sentiment can be helpful as they provide insight into the views and opinions of professional or individual investors. While not definitive predictors of market direction, these measures can serve as a valuable complement to other indicators and analysis tools, helping to paint a more comprehensive picture of the market's current state.

1. AAII Sentiment Survey (Individual Investors)
The American Association of Individual Investors (AAII) conducts a weekly survey to gauge members' expectations for the stock market over the next six months. Results are published every Wednesday.
In the latest survey, 33% of respondents had a bullish outlook, down from 37% the previous week.
2. BofA Bull & Bear Indicator (Institutional Investors)
The Bank of America Bull-Bear Indicator measures investor sentiment based on fund managers' and institutional investors' views. Scores range from 0 (extremely bearish) to 10 (extremely bullish).
The most recent reading was 5.2, a neutral sentiment reading.
3. CNN Fear & Greed Index (Technical)
This daily measure analyzes seven indicators to assess how emotions drive market decisions. Scores range from Extreme Fear to Extreme Greed.
The index closed at 55 (Neutral), down from 60 last Friday.
THE WEEK AHEAD
1. Economic Calendar
It’s an important week with several critical economic updates that could influence the Fed’s policy outlook. Key data points will include a revised look at Q1 GDP and the latest PCE inflation readings—closely watched by both markets and policymakers.
Key reports to watch:
GDP (Thu): The previous estimate showed the U.S. economy contracted -0.2% QoQ in Q1, a sharp reversal from the 2.4% growth seen in Q4.
Core PCE Price Index (Fri): The Fed’s preferred inflation gauge. Last month’s YoY reading was 2.5%, while the MoM increase was 0.1%.
Fed Chair Powell is scheduled to speak next week and may provide more clarity on the recent FOMC meeting and the central bank’s path for monetary policy going forward.


2. Earnings Calendar
The earnings season continues next week, and 9 companies from the S&P 500, including Micron and Nike, are expected to release their quarterly results.
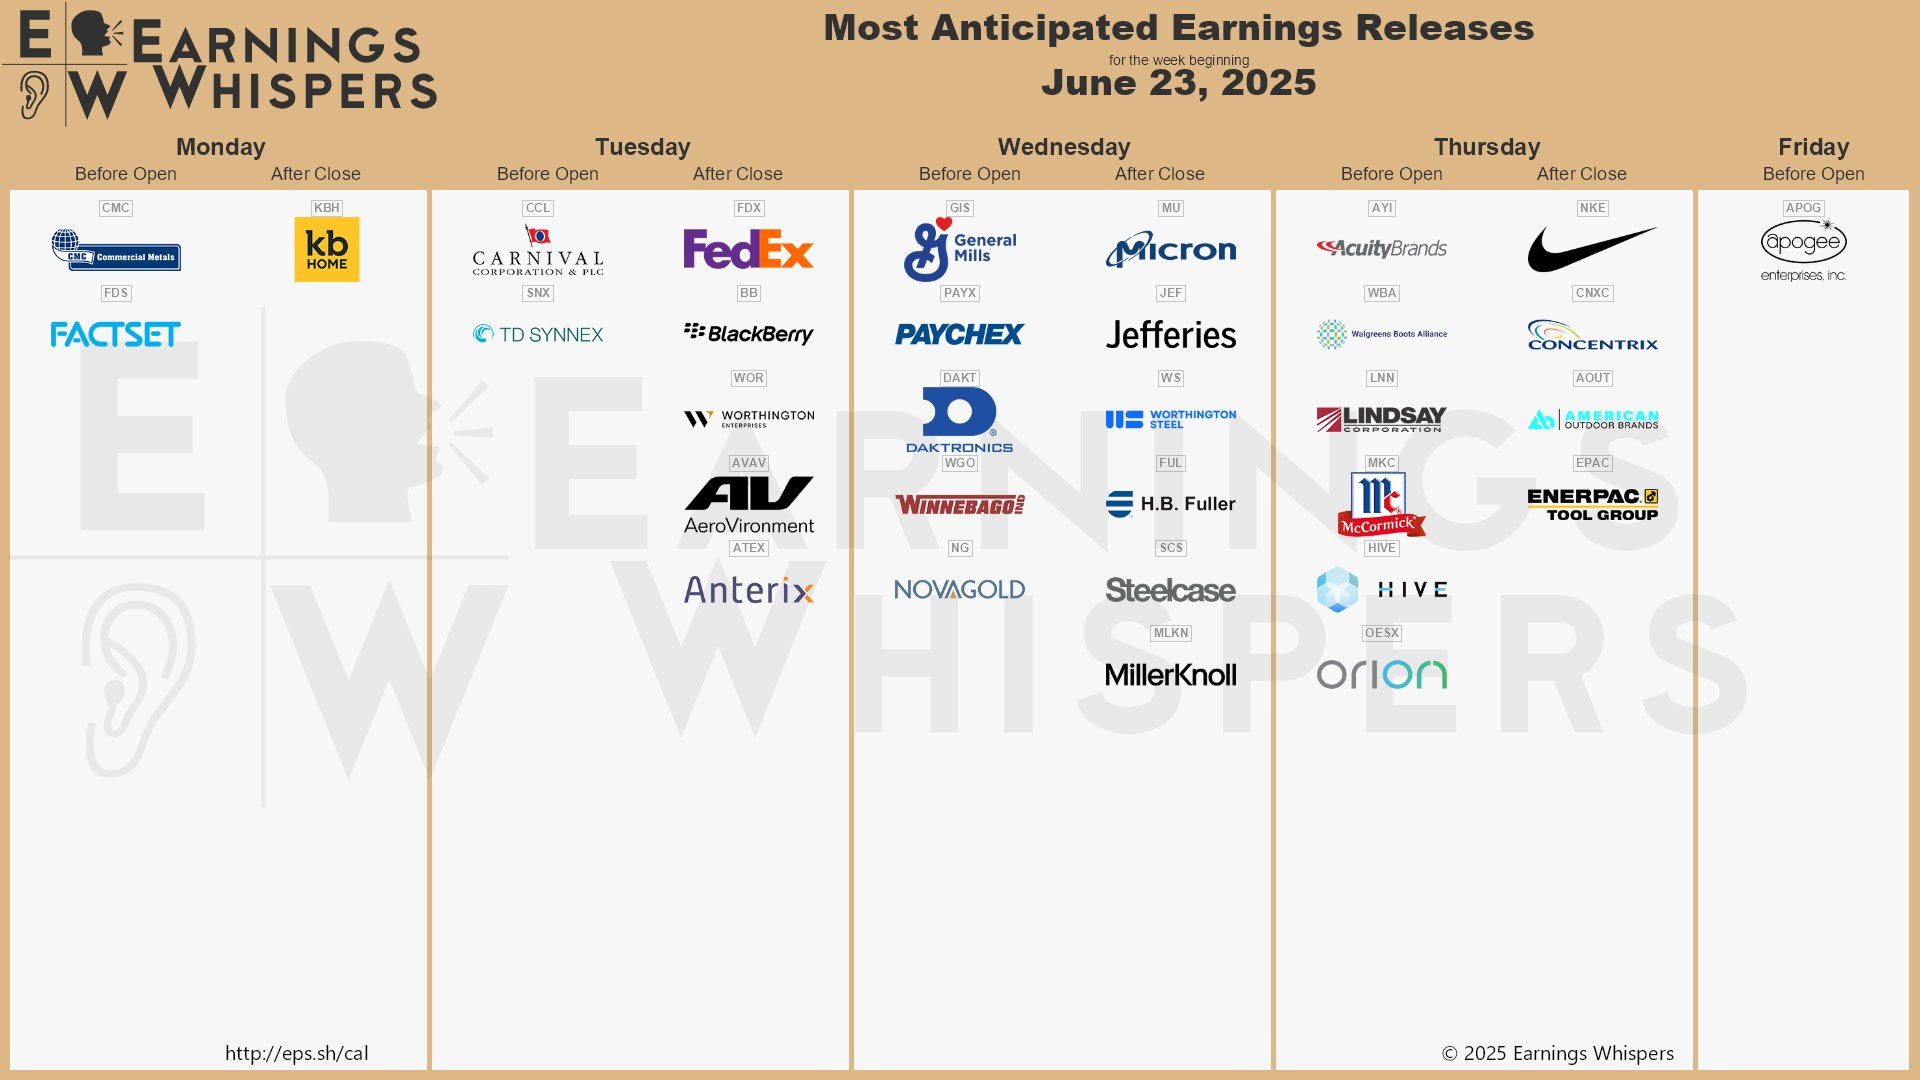
Below are notable stocks reporting earnings next week, along with several key indicators I like to monitor:
Stock Indicators:
3-Month Performance: Assessing recent stock trends.
RSI (Relative Strength Index): A reading above 70 suggests overbought conditions, while below 30 indicates oversold.
P/E Ratio: A value below 25 often points to a "cheap" valuation or low growth expectations.
Stock Price Reactions to Earnings:
1-Day Stock Return on Earnings: How the stock performs on its earnings release day.
Implied Volatility: The options market's forecast for the expected 1-day stock move after earnings.

3. Stock Analysis of the Week
Every week, I share my analysis of 1 stock that has reported earnings in recent weeks, focusing on implications for long-term investors. This week, I prepared an analysis of Adobe ($ADBE).
👨💻 My View: PASS
Adobe has struggled to gain traction for over a year now. After peaking in early 2024, the stock has consistently formed lower highs and lower lows, a classic downtrend.
The recent April bounce gave some hope, but that rally stalled right at the 30-week EMA, which continues to act as resistance. Last week’s earnings did nothing to shift the picture, and we could now be heading back toward April’s low.
While I still like Adobe’s fundamentals long term, the chart leaves little to like from a momentum standpoint. As long as we stay below key trend lines and fail to break into a higher high, this is a "no setup" zone for me.
Check out the post for more details about $ADBE performance, trend and key levels.
Community Spotlight
This week, I'm glad to feature
, a must-read if you want a clear, actionable view of the markets. Each post starts with a sharp market snapshot—covering S&P, Nasdaq, BTC, yields, and key catalysts like CPI or Fed talk. Then it breaks down a high-conviction trade setup with charts, support/resistance levels, and technical patterns. You’ll also get macro and sentiment analysis that ties it all together, followed by a clear trade thesis with entry, stop, and target levels.If you’re trading seriously,
delivers real insight you can use. 👉 You can try it free for 30 days with the link below:
CONCLUSION
Thank you for reading my Weekly Market Recap, which, I hope, got you ready for the week ahead.
If you want to take your investing journey to the next level, consider upgrading to a paid subscription. Subscribe now and learn more about my holistic, end-to-end momentum approach to investing.
Your first month is free, so this is the perfect opportunity to explore the full value of My Weekly Stock with no commitment!
Thanks again, and I look forward to sharing my market recap with you next week.
Happy investing!
My Weekly Stock
DISCLAIMER
The information provided in this newsletter is for informational purposes only and should not be taken as financial advice. Any investments or decisions made based on the information provided in this newsletter are the reader's sole responsibility. We recommend that readers conduct their own research and consult a qualified financial professional before making investment decisions. The author does not assume any responsibility for any losses or damages arising from using the information provided in this newsletter.