


Weekly Market Recap (Jun 2-6): The S&P 500 Hits 6,000 Again - Breakout in Progress?
Everything you need to know about last week's markets performance and what to expect next.
Dear readers,
Welcome back to My Weekly Stock, where in-depth market analysis meets proven momentum-based trading strategies. My mission? To help you win in the markets with unbiased, data-driven insights you can act on.
Friday means it's time to review the week in the markets. Each week, I dedicate hours to curating this market recap, preparing insightful analysis with clear visuals and a structured layout—making it easy for you to find exactly what you need, week after week. And because it's easy to get swayed by personal bias, I like to let the data do most of the talking.
If you want the full experience, consider upgrading your subscription. Paid members get access to all my portfolios, in-depth analysis, and a clear momentum-based framework you can follow and learn from.
Start today. Your first month is completely FREE. If you’re ready to give it a try—or just want to support my work—this is your chance!
Let's dive in!
SUMMARY
Here are this week's highlights and what to look out for next:
1. The markets were positive this week, with the S&P 500 up 1.5%, the Nasdaq 2.2%, and the Dow Jones 1.2%. Technology (+3.2%) and Energy (+2.3%) were the best-performing sectors.
2. The S&P 500's long-term trend is positive, and so is the short-term momentum. 6,150 is the next resistance, while 5,920 is support.
3. The Q1 earnings season is almost over and 496 companies from the S&P 500 index have released their quarterly results, with 76% beating estimates. Earnings are expected to be up 14% in Q1 and 8% in 2025.
4. Market sentiment is at the "Greed" level (63/100) as measured by CNN’s Fear & Greed indicator, while VIX is at a medium value of 17.
5. Earnings reports from Oracle and Adobe, the latest CPI and PPI inflation reports are scheduled for next week.
My take:
Markets continued their upward trend this week, with notable intraday swings that were ultimately met with buying interest. A significant milestone was reached as the S&P 500 touched 6,000, a level not seen since late February. While this is largely symbolic at this stage, a confirmed breakout would make it more meaningful. The next natural target is the previous all-time high, now just 2% away.
Looking ahead, next week could bring increased volatility with key inflation data and US-China trade talks on the horizon. While I am cautiously optimistic, I will be watching whether the index can remain above this week's low of 5,920 and if any weakness proves to be short-lived.

PERFORMANCE RECAP
1. S&P 500 Sector Performance
This week, 8 out of the 11 S&P 500 sectors posted gains. Technology led the market with a 3.2% increase, while Consumer Defensive was the laggard, dropping 1.4%.
Year-to-date, 8 sectors have achieved positive performance. Industrials is the top-performing sector with a 10 % gain, while Consumer Cyclical lags behind, with a 5.4 % loss.

2. S&P 500 Top & Worst Performers
Over the last five trading days, 65% of the stocks in the S&P 500 index rose in value.
Top Performers:
$ON (ON Semiconductor Corp): 19.4%
$DG (Dollar General Corp): 16.7%
$MU (Micron Technology Inc): 14.9%
$MCHP (Microchip Technology, Inc): 12.4%
$ANET (Arista Networks Inc): 12.3%
Worst Performers:
$WYNN (Wynn Resorts Ltd): -8%
$KVUE (Kenvue Inc): -9%
$TSLA (Tesla Inc): -14.8%
$BF-B (Brown-Forman Corp): -15.7%
$LULU (Lululemon Athletica inc): -16.2%

In addition, 41 stocks within the S&P 500 reached a new 52-week high, while 7 stocks set new lows. The majority of this week’s highs came from the Industrials sector.
Notable Highs:
$MSFT (Microsoft Corporation)
$AVGO (Broadcom Inc)
$V (Visa Inc)
$NFLX (Netflix Inc)
$PLTR (Palantir Technologies Inc)
Notable Lows:
$REGN (Regeneron Pharmaceuticals, Inc)
$CNC (Centene Corp)
$ZBH (Zimmer Biomet Holdings Inc)
$CLX (Clorox Co)
$COO (Cooper Companies, Inc)

MARKET MOMENTUM
1. Momentum Review
To evaluate the market's current health, I examine 4 key elements: performance, breadth, trends, and key levels. Healthy bull markets typically feature indices setting new highs, broad market participation, and ascending trend lines.
Performance (POSITIVE 🟢): evaluating recent market performance to gauge the momentum’s strength. Ideally i want to see returns accelerating short-term and index trading less than 5% from its 1-year high
1-month performance: +6.8% 🟢
3-month performance: +4.0% 🟢
vs. 1-year high: -2.3%🟢
Breadth (MIXED 🟡): assessing market participation to understand the health of the trend. Extreme levels (above 80% or below 20%) may indicate overextended trends.
% of stocks above 200-day moving average: 49% (in line with last week) 🟡
% of stocks above 20-day moving average: 60% (up from 57% last week) 🟢
Trends: analyzing trend strength across multiple timeframes using exponential moving averages, scored on a scale of 1 to 5. A score of 3 or above suggests solid trends and supports holding a position.
Weekly chart: SOLID ⭐️⭐️⭐️ (stable vs last week)

Daily chart: VERY STRONG ⭐️⭐️⭐️⭐️⭐️ (improving vs last week)

4-hour chart: STRONG ⭐️⭐️⭐️⭐️ (improving vs last week)

Key levels: identifying critical price zones to confirm the current trend or signal a potential reversal.
Support:
$5,780 (-3.7%)
$5,850 (-2.5%)
$5,920 (-1.3%)
Resistance:
$6,150 (+2.5%)
$6,250 (+4.2%)
2. Post of the Week
This week's momentum analysis is about seasonality, as we just started the month of June. Since 1964, the S&P500 has been up 58% of the time in June averaging a 0.1% return.
EARNINGS & ECONOMIC REPORTS RECAP
1. Earnings Outlook
Q1 Earnings: S&P 500 earnings are expected to grow by 14%, rising to 16% when excluding the energy sector.
2025 Full-Year Outlook: Earnings are expected to increase by 8%, slightly below the 10-year average growth of 9%.
Analyst Revisions: Over the past month, 54% of all earnings revisions by analysts have been upward adjustments to their outlook.
Valuation: The forward 4-quarter P/E ratio stands at 22.0, above the 5-year and 10-year historical averages.

2. Earnings Season Recap
Out of 496 S&P 500 companies that have reported first-quarter earnings, 76% exceeded EPS expectations. It is in line with the four-quarter average of 77% and above the historical average of 67%.
Below are some notable companies that reported earnings last week. I’ve highlighted their EPS and revenue performance vs estimate, as well as their stock return this week.
One highlight of the week was Lululemon ($LULU), with an underwhelming report and guidance, which send the stock down 20% on Friday and 16% for the week.

3. Economic Reports
The focus this week was on the U.S. labor market, with several key employment reports released on Friday, which were met with enthusiasm by markets.
Key reports included:
Nonfarm Payrolls (Fri): The U.S. economy added 139K jobs in May, slightly above expectations (126K) but down from April’s 147K.
Unemployment Rate (Fri): Held steady at 4.2%, in line with both expectations and the previous month’s reading.
Average Hourly Earnings (Fri): Rose 0.4% MoM, beating the 0.3% forecast and accelerating from the prior 0.2%, indicating continued wage pressure.

MARKET SENTIMENT
Measures of investor sentiment can be helpful as they provide insight into the views and opinions of professional or individual investors. While not definitive predictors of market direction, these measures can serve as a valuable complement to other indicators and analysis tools, helping to paint a more comprehensive picture of the market's current state.

1. AAII Sentiment Survey (Individual Investors)
The American Association of Individual Investors (AAII) conducts a weekly survey to gauge members' expectations for the stock market over the next six months. Results are published every Wednesday.
In the latest survey, 33% of respondents had a bullish outlook, flat vs. he previous week.
2. BofA Bull & Bear Indicator (Institutional Investors)
The Bank of America Bull-Bear Indicator measures investor sentiment based on fund managers' and institutional investors' views. Scores range from 0 (extremely bearish) to 10 (extremely bullish).
The most recent reading was 4.2, a neutral sentiment reading.
3. CNN Fear & Greed Index (Technical)
This daily measure analyzes seven indicators to assess how emotions drive market decisions. Scores range from Extreme Fear to Extreme Greed.
The index closed at 63 (Greed), up from 62 last Friday.
THE WEEK AHEAD
1. Economic Calendar
Next week, the main focus will be on inflation, with fresh CPI and PPI data set to offer more clarity on price trends. Treasury bond auctions will also be watched closely, particularly as yields remain elevated.
Key reports to watch:
Core CPI (Wed): Last month’s core inflation rose 0.2% MoM.
CPI YoY (Wed): The headline year-over-year inflation rate was 2.3% in April, still above the Fed’s 2% target.
PPI (Thu): Producer prices fell -0.5% MoM last month, but markets will look at any sign of impact from tariffs.

2. Earnings Calendar
The earnings season continues next week, and 3 companies from the S&P 500, including Oracle and Adobe, are expected to release their quarterly results.
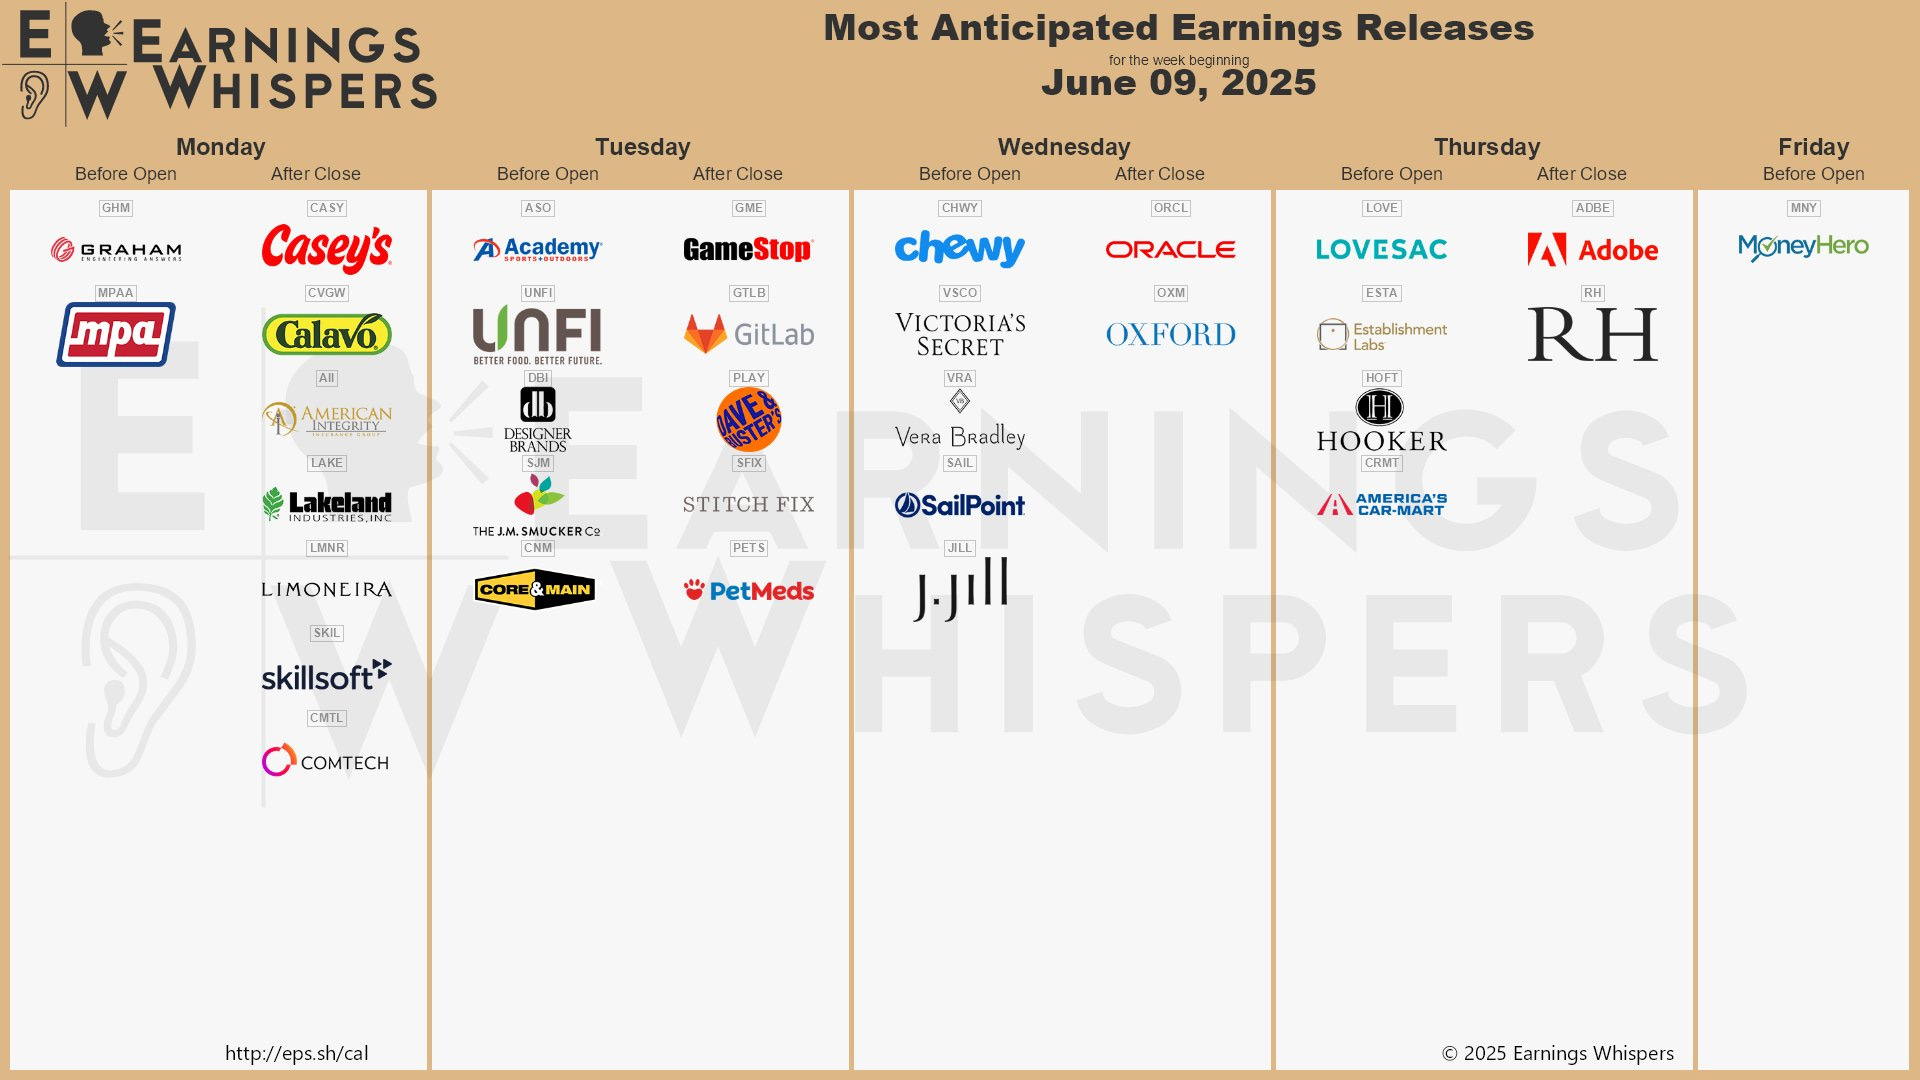
Below are notable stocks reporting earnings next week, along with several key indicators I like to monitor:
Stock Indicators:
3-Month Performance: Assessing recent stock trends.
RSI (Relative Strength Index): A reading above 70 suggests overbought conditions, while below 30 indicates oversold.
P/E Ratio: A value below 25 often points to a "cheap" valuation or low growth expectations.
Stock Price Reactions to Earnings:
1-Day Stock Return on Earnings: How the stock performs on its earnings release day.
Implied Volatility: The options market's forecast for the expected 1-day stock move after earnings.

3. Stock Analysis of the Week
Every week, I share my analysis of 1 stock that has reported earnings in recent weeks, focusing on implications for long-term investors. This week, I prepared an analysis of Costco ($COST).
👨💻 My View: HOLD
Costco has been one of the market’s most reliable leaders, climbing steadily since early 2023. Even during the Q1 shakeout, the momentum stayed intact, as the 9-week EMA held above the 30-week EMA the entire time.
Since mid-April, the stock has reclaimed both trend lines, and with the MACD resetting, it may be setting up for another push higher.
The next challenge is the $1,000 to $1,100 resistance zone that capped the rally earlier this year and where sellers stepped in again this week. That’s the level bulls need to break to keep the trend going.
Check out the post for more details about $COST performance, trend and key levels.
Community Spotlight
This week, I am glad to feature
, founder of — a Substack that tracks a fully rule-based model built to outperform the NASDAQ. Since 1999, the system has delivered 27% p.a. through all kinds of markets — by knowing when to lean in, and when to stay out. His publication combines weekly model insights with educational deep dives — no fluff, no forecasts, just structured signals.Check out this post breaking how his model avoids the large drawdowns:

CONCLUSION
Thank you for reading my Weekly Market Recap, which, I hope, got you ready for the week ahead.
If you want to take your investing journey to the next level, consider upgrading to a paid subscription. Subscribe now and learn more about my holistic, end-to-end momentum approach to investing.
Your first month is free, so this is the perfect opportunity to explore the full value of My Weekly Stock with no commitment!
Thanks again, and I look forward to sharing my market recap with you next week.
Happy investing!
My Weekly Stock
DISCLAIMER
The information provided in this newsletter is for informational purposes only and should not be taken as financial advice. Any investments or decisions made based on the information provided in this newsletter are the reader's sole responsibility. We recommend that readers conduct their own research and consult a qualified financial professional before making investment decisions. The author does not assume any responsibility for any losses or damages arising from using the information provided in this newsletter.
Thanks for the feature buddy!