


Weekly Market Recap (Jun 9-13): Headline-Driven Week Ends on a Sour Note – Is Momentum Fading?
Everything you need to know about last week's markets performance and what to expect next.
Dear readers,
Welcome back to My Weekly Stock, where in-depth market analysis meets proven momentum-based trading strategies. My mission? To help you win in the markets with unbiased, data-driven insights you can act on.
Friday means it's time to review the week in the markets. Each week, I dedicate hours to curating this market recap, preparing insightful analysis with clear visuals and a structured layout—making it easy for you to find exactly what you need, week after week. And because it's easy to get swayed by personal bias, I like to let the data do most of the talking.
If you want the full experience, consider upgrading your subscription. Paid members get access to all my portfolios, in-depth analysis, and a clear momentum-based framework you can follow and learn from.
Start today. Your first month is completely FREE. If you’re ready to give it a try—or just want to support my work—this is your chance!
Let's dive in!
SUMMARY
Here are this week's highlights and what to look out for next:
1. The markets were negative this week, with the S&P 500 down -0.4%, the Nasdaq -0.6%, and the Dow Jones -1.3%. Energy (+5.6%) and Health Care (+1.3%) were the best-performing sectors.
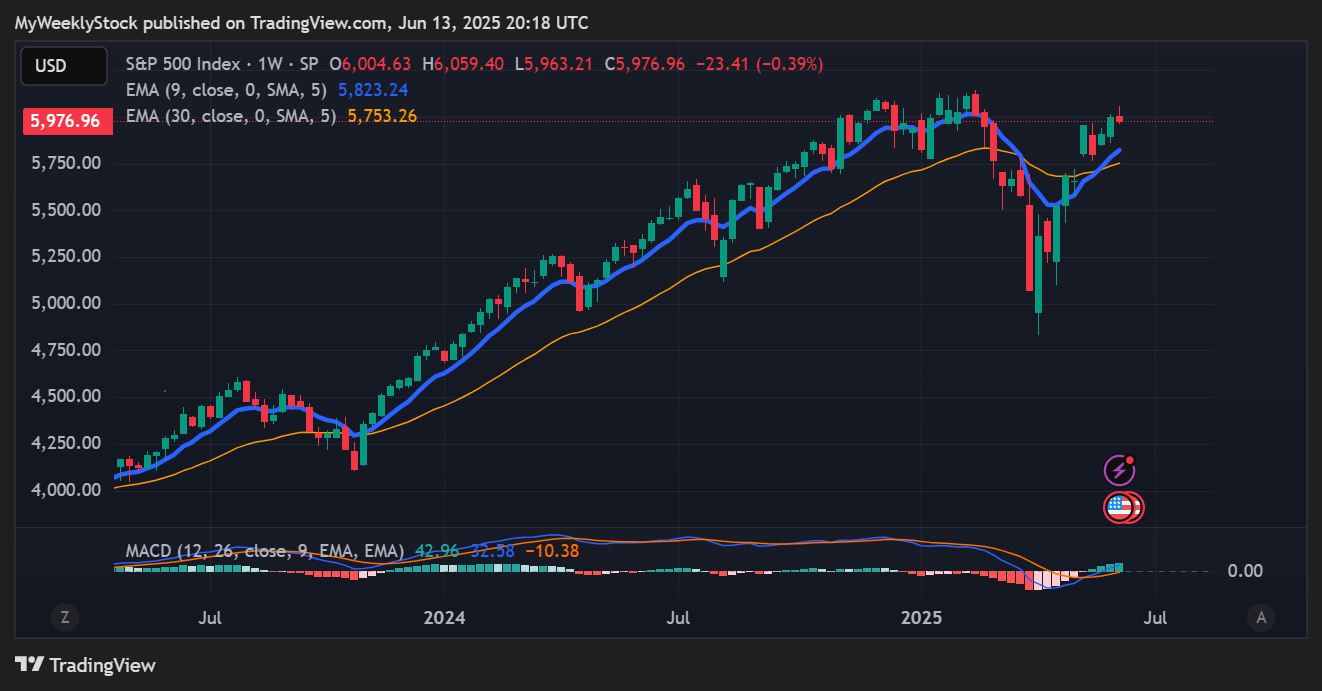
2. The S&P 500's long-term trend is positive, and so is the short-term momentum. 6,060 is the next resistance, while 5,920 is support.
3. The Q1 earnings season is almost over and 497 companies from the S&P 500 index have released their quarterly results, with 76% beating estimates. Earnings are expected to be up 14% in Q1 and 8% in 2025.
4. Market sentiment is at the "Greed" level (60/100) as measured by CNN’s Fear & Greed indicator, while VIX is at a high value of 21.
5. Earnings report from Kroger, the Fed meeting, and Retail Sales data are scheduled for next week.
My take:
A red week for the markets this week in another volatile, headline-driven environment. It was somewhat frustrating, as we had several positive catalysts, including good progress on US-China trade discussions and two consecutive favorable inflation reports. Yet, markets failed to deliver a meaningful breakout and remained vulnerable to sellers stepping in at the first signs of weakness. That’s exactly what happened Friday, as renewed tensions in the Middle East and a surge in oil prices triggered some selling pressure.
Stepping back, while the week ended on a sour note, we’re still holding above key support levels, and the setup that pushed the S&P 500 back above 6,000 remains intact for now. With many headlines still to come, including those from the Fed, trade talks, and geopolitical developments, it’s critical to stay level-headed and let price action be the guide. At this stage, while I am cautious, I am not overly concerned.

PERFORMANCE RECAP
1. S&P 500 Sector Performance
This week, 4 out of the 11 S&P 500 sectors posted gains. Energy led the market with a 5.6% increase, while Financials was the laggard, dropping 2.6%.
Year-to-date, 9 sectors have achieved positive performance. Industrials is the top-performing sector with a 8.3 % gain, while Consumer Cyclical lags behind, with a 5.6 % loss.

2. S&P 500 Top & Worst Performers
Over the last five trading days, 35% of the stocks in the S&P 500 index rose in value.
Top Performers:
$ORCL (Oracle Corp): 23.7%
$APA (APA Corporation): 13.6%
$HAL (Halliburton Co): 13%
$COP (Conoco Phillips): 11.2%
$ENPH (Enphase Energy Inc): 10.7%
Worst Performers:
$LULU (Lululemon Athletica inc): -9.9%
$EIX (Edison International): -10.1%
$UAL (United Airlines Holdings Inc): -12.2%
$PCG (PG&E Corp): -12.8%
$SJM (J.M. Smucker Co): -13.7%
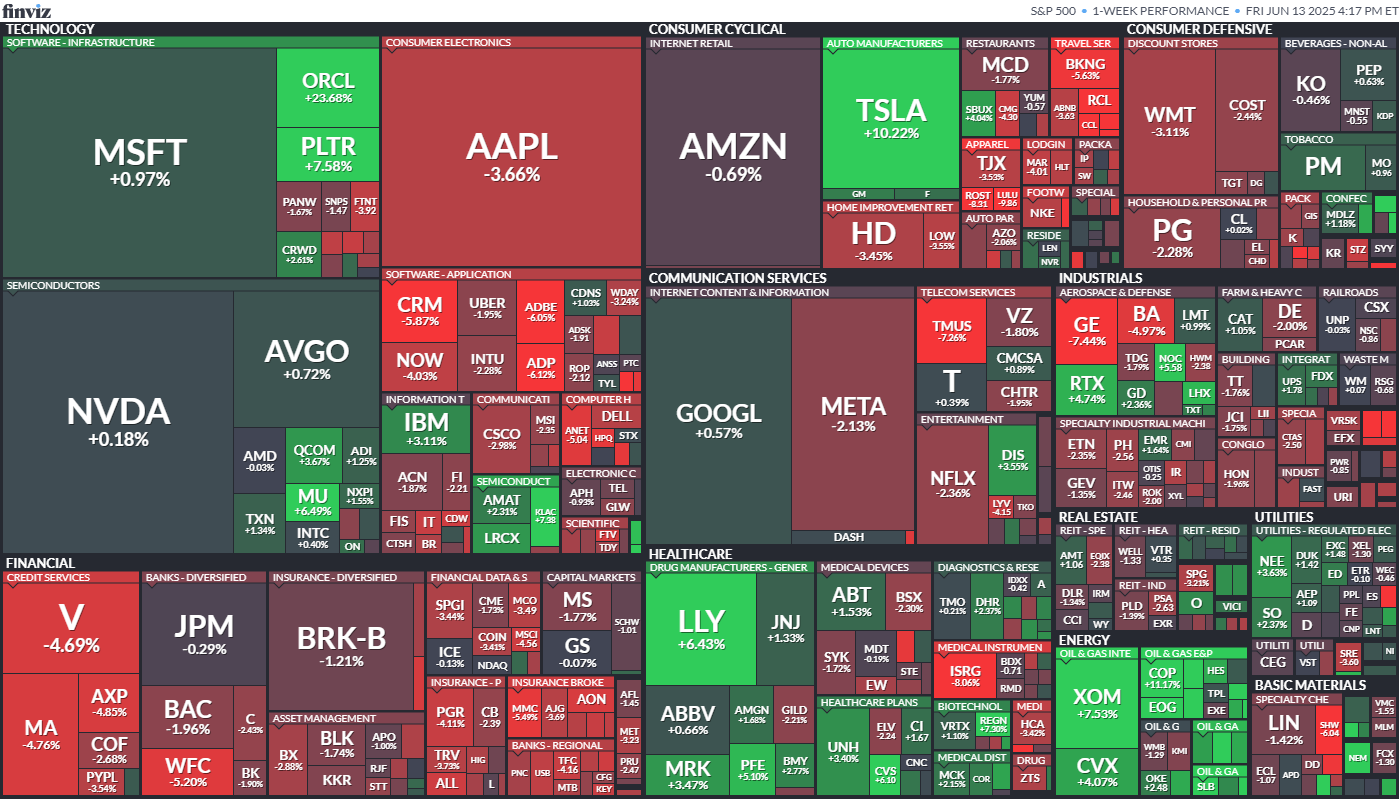
In addition, 26 stocks within the S&P 500 reached a new 52-week high, while 6 stocks set new lows. The majority of this week’s highs came from the Technology sector.
Notable Highs:
$MSFT (Microsoft Corporation)
$V (Visa Inc)
$MA (Mastercard Incorporated)
$ORCL (Oracle Corp)
$PLTR (Palantir Technologies Inc)
Notable Lows:
$EIX (Edison International)
$CLX (Clorox Co)
$CAG (Conagra Brands Inc)
$SJM (J.M. Smucker Co)
$CPB (Campbells Co)

MARKET MOMENTUM
1. Momentum Review
To evaluate the market's current health, I examine 4 key elements: performance, breadth, trends, and key levels. Healthy bull markets typically feature indices setting new highs, broad market participation, and ascending trend lines.
Performance (POSITIVE 🟢): evaluating recent market performance to gauge the momentum’s strength. Ideally i want to see returns accelerating short-term and index trading less than 5% from its 1-year high
1-month performance: +1.6% 🟢
3-month performance: +6.1% 🟢
vs. 1-year high: -2.7%🟢
Breadth (MIXED 🟡): assessing market participation to understand the health of the trend. Extreme levels (above 80% or below 20%) may indicate overextended trends.
% of stocks above 200-day moving average: 47% (down from 49 last week) 🟡
% of stocks above 20-day moving average: 40% (down from 60% last week) 🔴
Trends: analyzing trend strength across multiple timeframes using exponential moving averages, scored on a scale of 1 to 5. A score of 3 or above suggests solid trends and supports holding a position.
Weekly chart: STRONG ⭐️⭐️⭐️⭐️ (better than last week)
Daily chart: STRONG ⭐️⭐️⭐️⭐️ (worst last week)
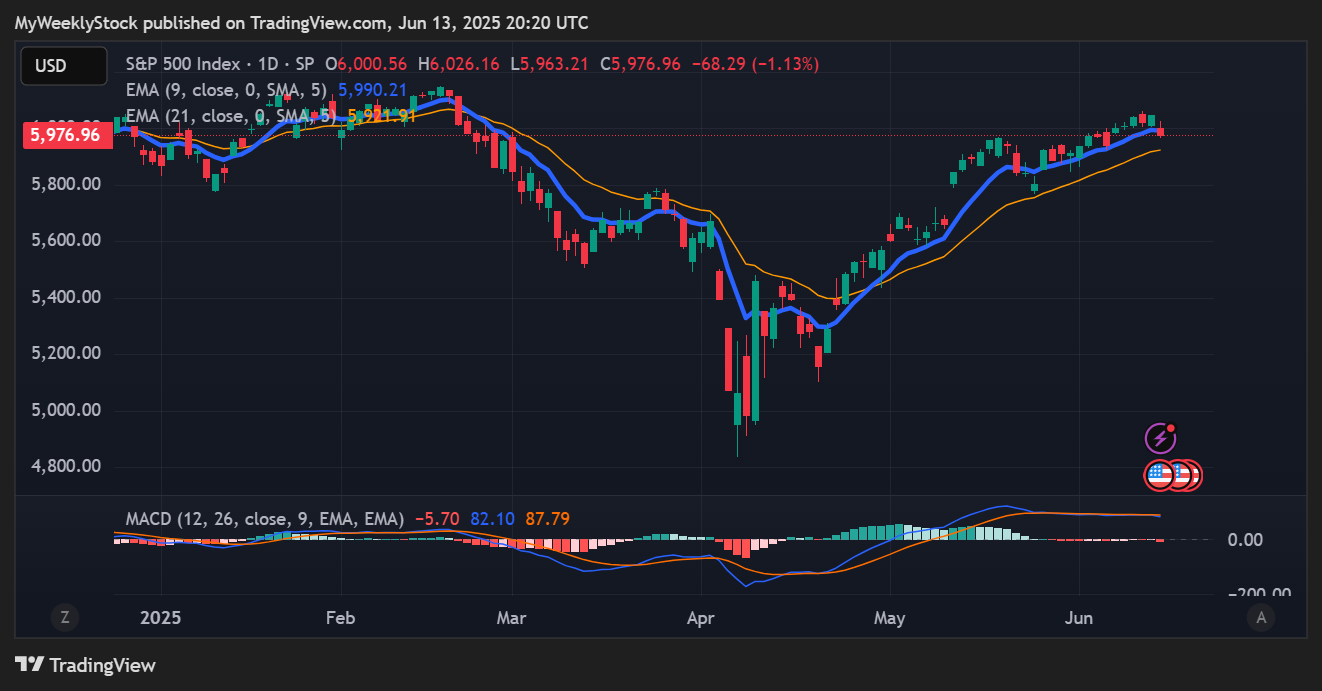
4-hour chart: SOLID⭐️⭐️⭐️ (worst than last week)

Key levels: identifying critical price zones to confirm the current trend or signal a potential reversal.
Support:
$5,780 (-3.3%)
$5,850 (-2.1%)
$5,920 (-1.0%)
Resistance:
6,060 (+1.4%)
$6,150 (+2.9%)
$6,250 (+4.6%)
2. Post of the Week
This week's momentum analysis focuses on the S&P 500 sectors' trends. Using a combination of performance metrics and technical indicators, I've developed a proprietary algorithm to rank these sectors and identify potential outperformers. Based on this approach, I've identified the Industrials and Communication Services sectors as having the best relative momentum this week.
EARNINGS & ECONOMIC REPORTS RECAP
1. Earnings Outlook
Q1 Earnings: S&P 500 earnings are expected to grow by 14%, rising to 16% when excluding the energy sector.
2025 Full-Year Outlook: Earnings are expected to increase by 8%, slightly below the 10-year average growth of 9%.
Analyst Revisions: Over the past month, 54% of all earnings revisions by analysts have been upward adjustments to their outlook.
Valuation: The forward 4-quarter P/E ratio stands at 22.4, above the 5-year and 10-year historical averages.

2. Earnings Season Recap
Out of 497 S&P 500 companies that have reported first-quarter earnings, 76% exceeded EPS expectations. It is in line with the four-quarter average of 77% and above the historical average of 67%.
Below are some notable companies that reported earnings last week. I’ve highlighted their EPS and revenue performance vs estimate, as well as their stock return this week.
One highlight of the week was Oracle ($ORCL), with a double beat on Earnings and Revenue, which send the stock up 23% for the week.

3. Economic Reports
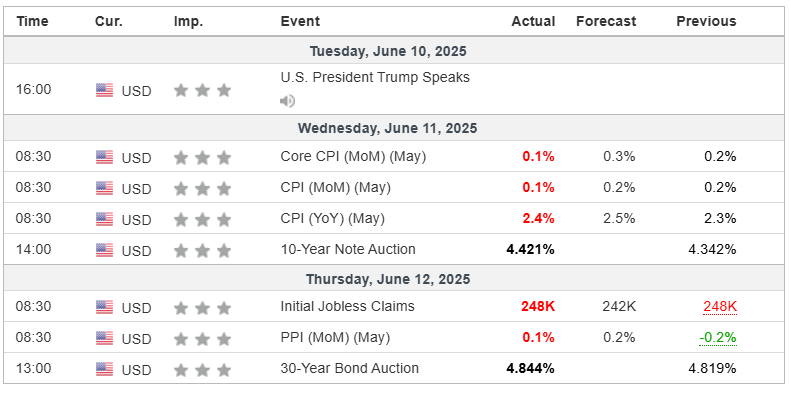
The main focus this week was on inflation, with both CPI and PPI reports offering new data on price pressures. Treasury bond auctions were also closely watched..
Key reports included:
Core CPI (Wed): Rose 0.1% MoM, coming in below expectations (0.3%) and down from the prior 0.2%, signaling a softer increase in core inflation.
CPI YoY (Wed): Headline inflation came in at 2.4% YoY, slightly below expectations (2.5%) but up from 2.3% the previous month.
PPI (Thu): Producer prices rose 0.1% MoM, softer than expected (0.2%) but reversing from last month’s decline of -0.2%.
MARKET SENTIMENT
Measures of investor sentiment can be helpful as they provide insight into the views and opinions of professional or individual investors. While not definitive predictors of market direction, these measures can serve as a valuable complement to other indicators and analysis tools, helping to paint a more comprehensive picture of the market's current state.
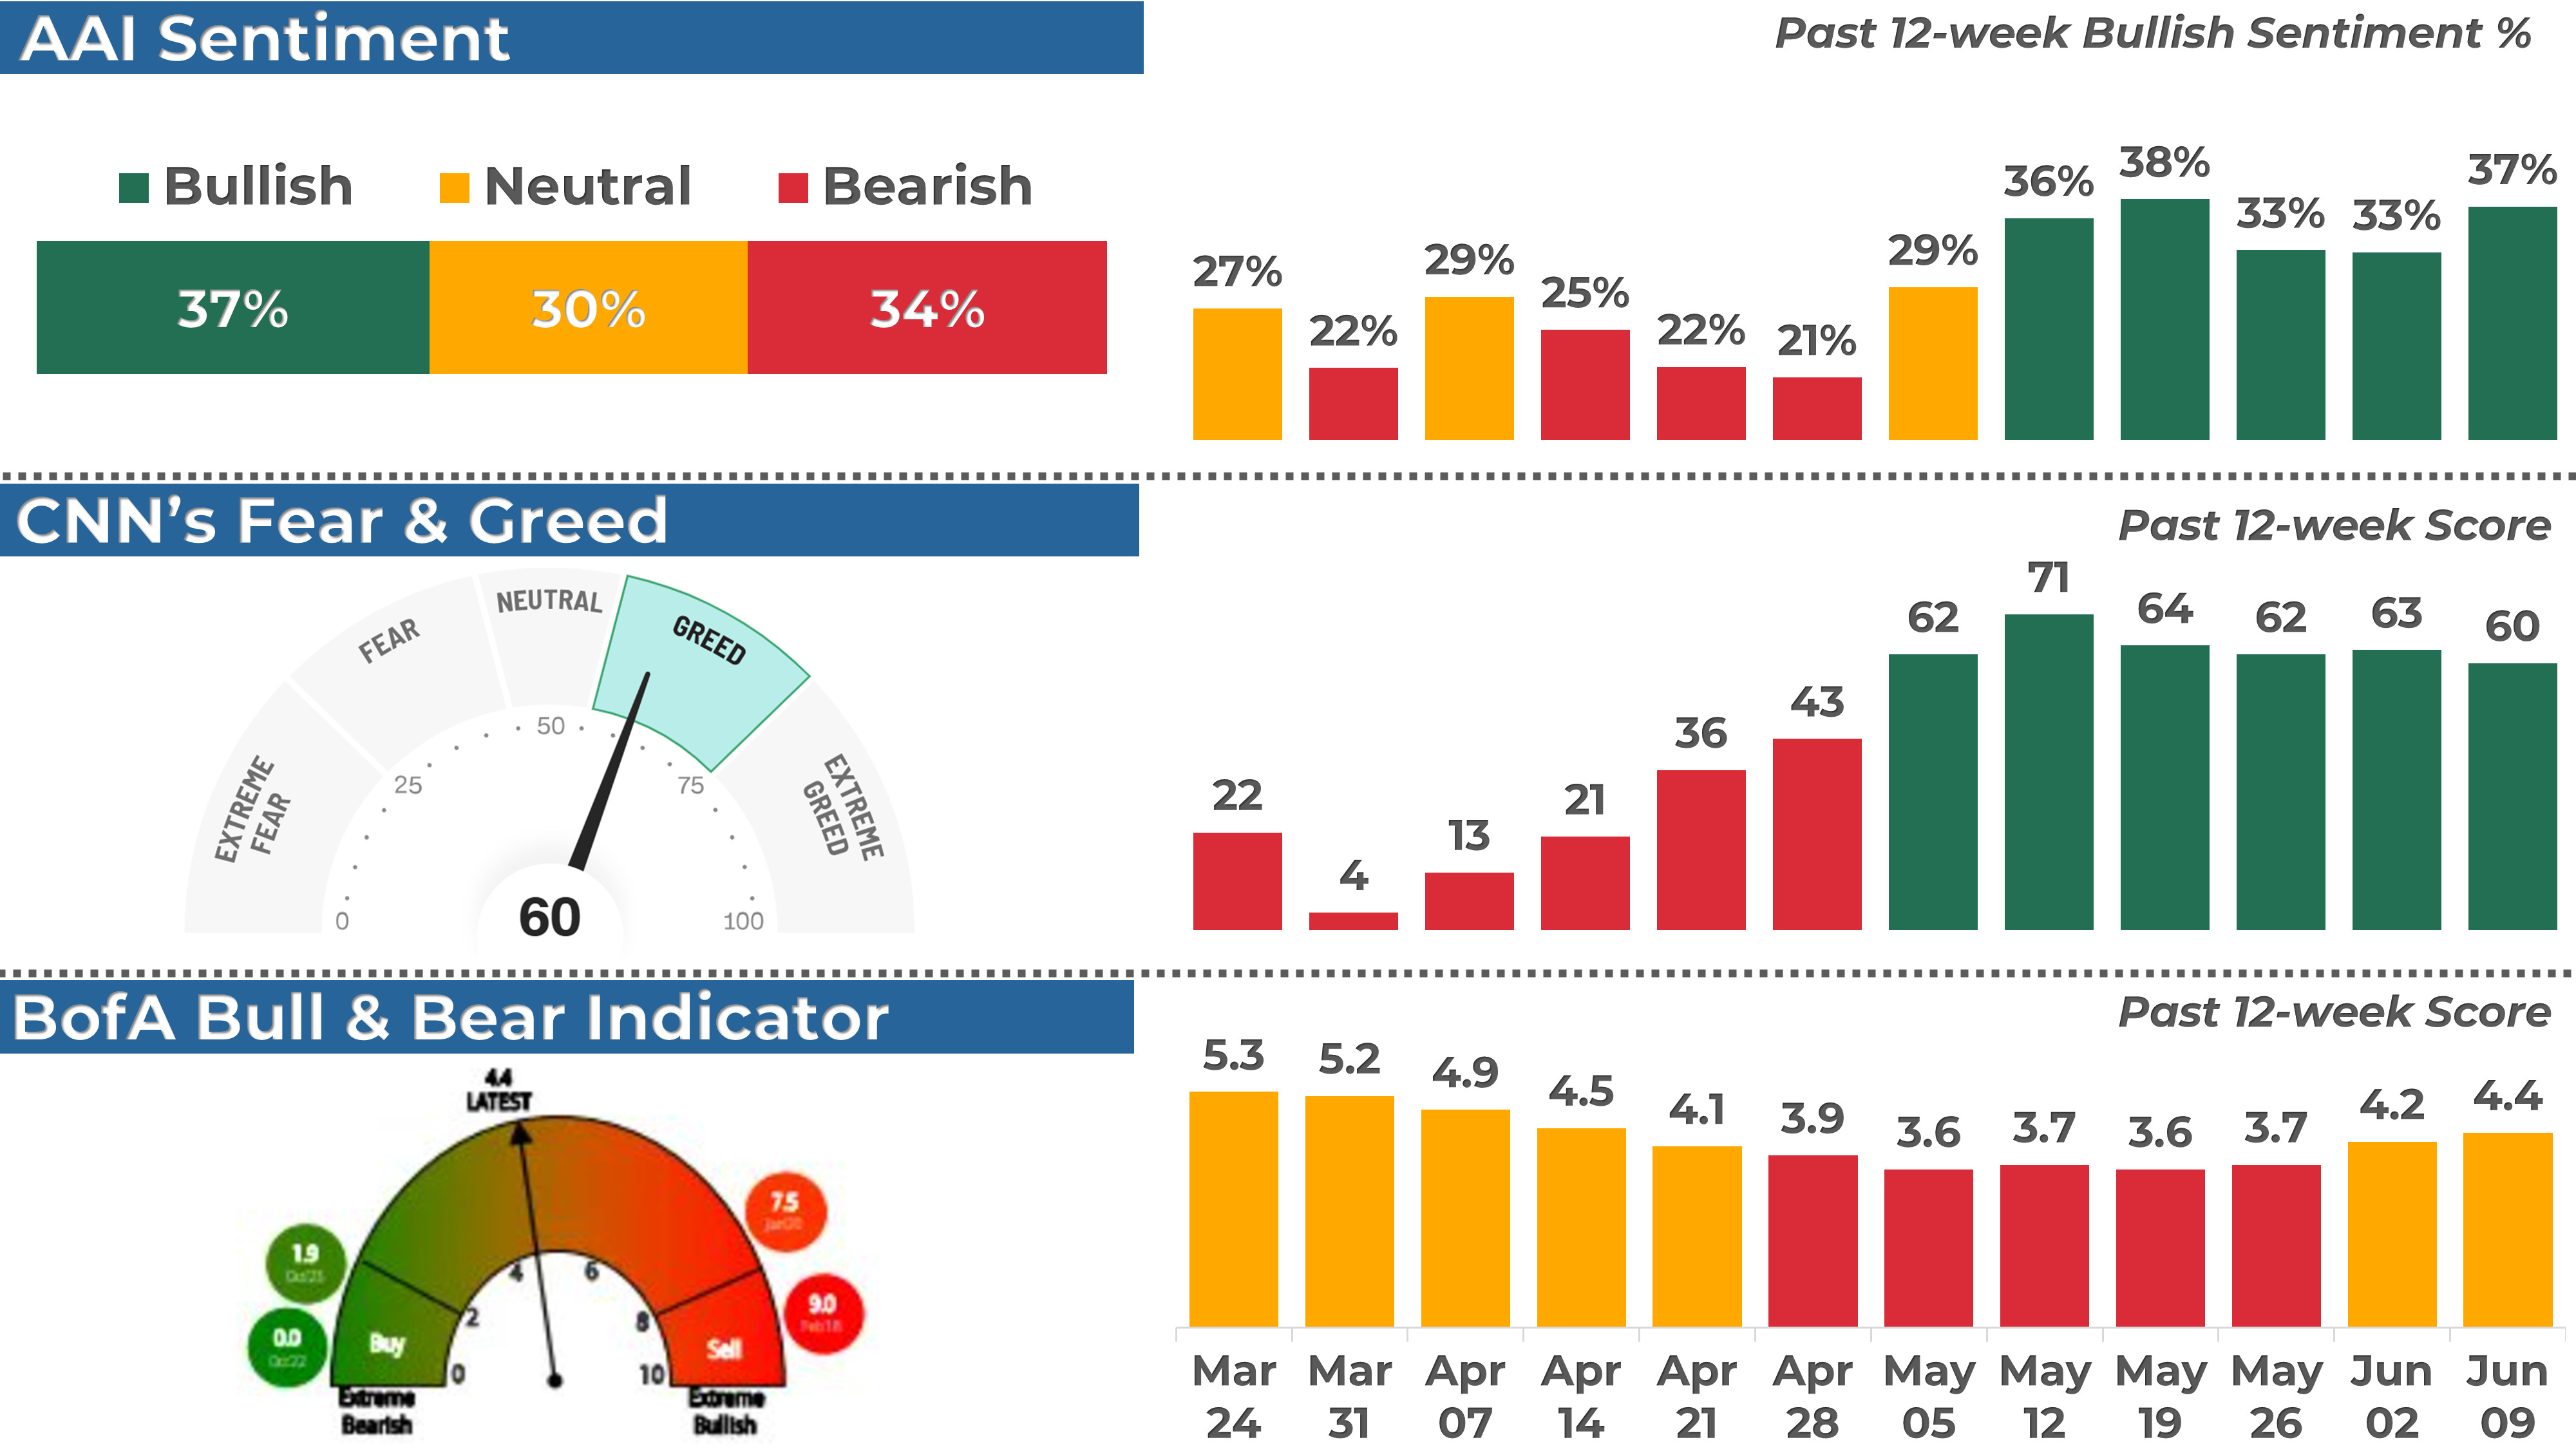
1. AAII Sentiment Survey (Individual Investors)
The American Association of Individual Investors (AAII) conducts a weekly survey to gauge members' expectations for the stock market over the next six months. Results are published every Wednesday.
In the latest survey, 37% of respondents had a bullish outlook, up from 33% the previous week.
2. BofA Bull & Bear Indicator (Institutional Investors)
The Bank of America Bull-Bear Indicator measures investor sentiment based on fund managers' and institutional investors' views. Scores range from 0 (extremely bearish) to 10 (extremely bullish).
The most recent reading was 4.4, a neutral sentiment reading.
3. CNN Fear & Greed Index (Technical)
This daily measure analyzes seven indicators to assess how emotions drive market decisions. Scores range from Extreme Fear to Extreme Greed.
The index closed at 60 (Greed), down from 63 last Friday.
THE WEEK AHEAD
1. Economic Calendar
It will be a packed week despite a short trading schedule, due to the Juneteenth holiday on Thursday. The main focus will be on the Federal Reserve, as markets await Wednesday’s highly anticipated policy decision and updated projections. Key consumer spending data will also be released earlier in the week.
Key reports to watch:
Retail Sales (Tue): Last month’s report showed headline and core sales both rising 0.1% MoM, highlighting soft but still positive consumer activity heading into the summer.
FOMC Meeting (Wed): The Fed is widely expected to leave rates unchanged at 4.50%, but the updated economic projections and Powell’s press conference will be closely monitored for any shifts in the Fed’s policy outlook.

2. Earnings Calendar
The earnings season continues next week, and 6 companies from the S&P 500, including Kroger and Accenture, are expected to release their quarterly results.
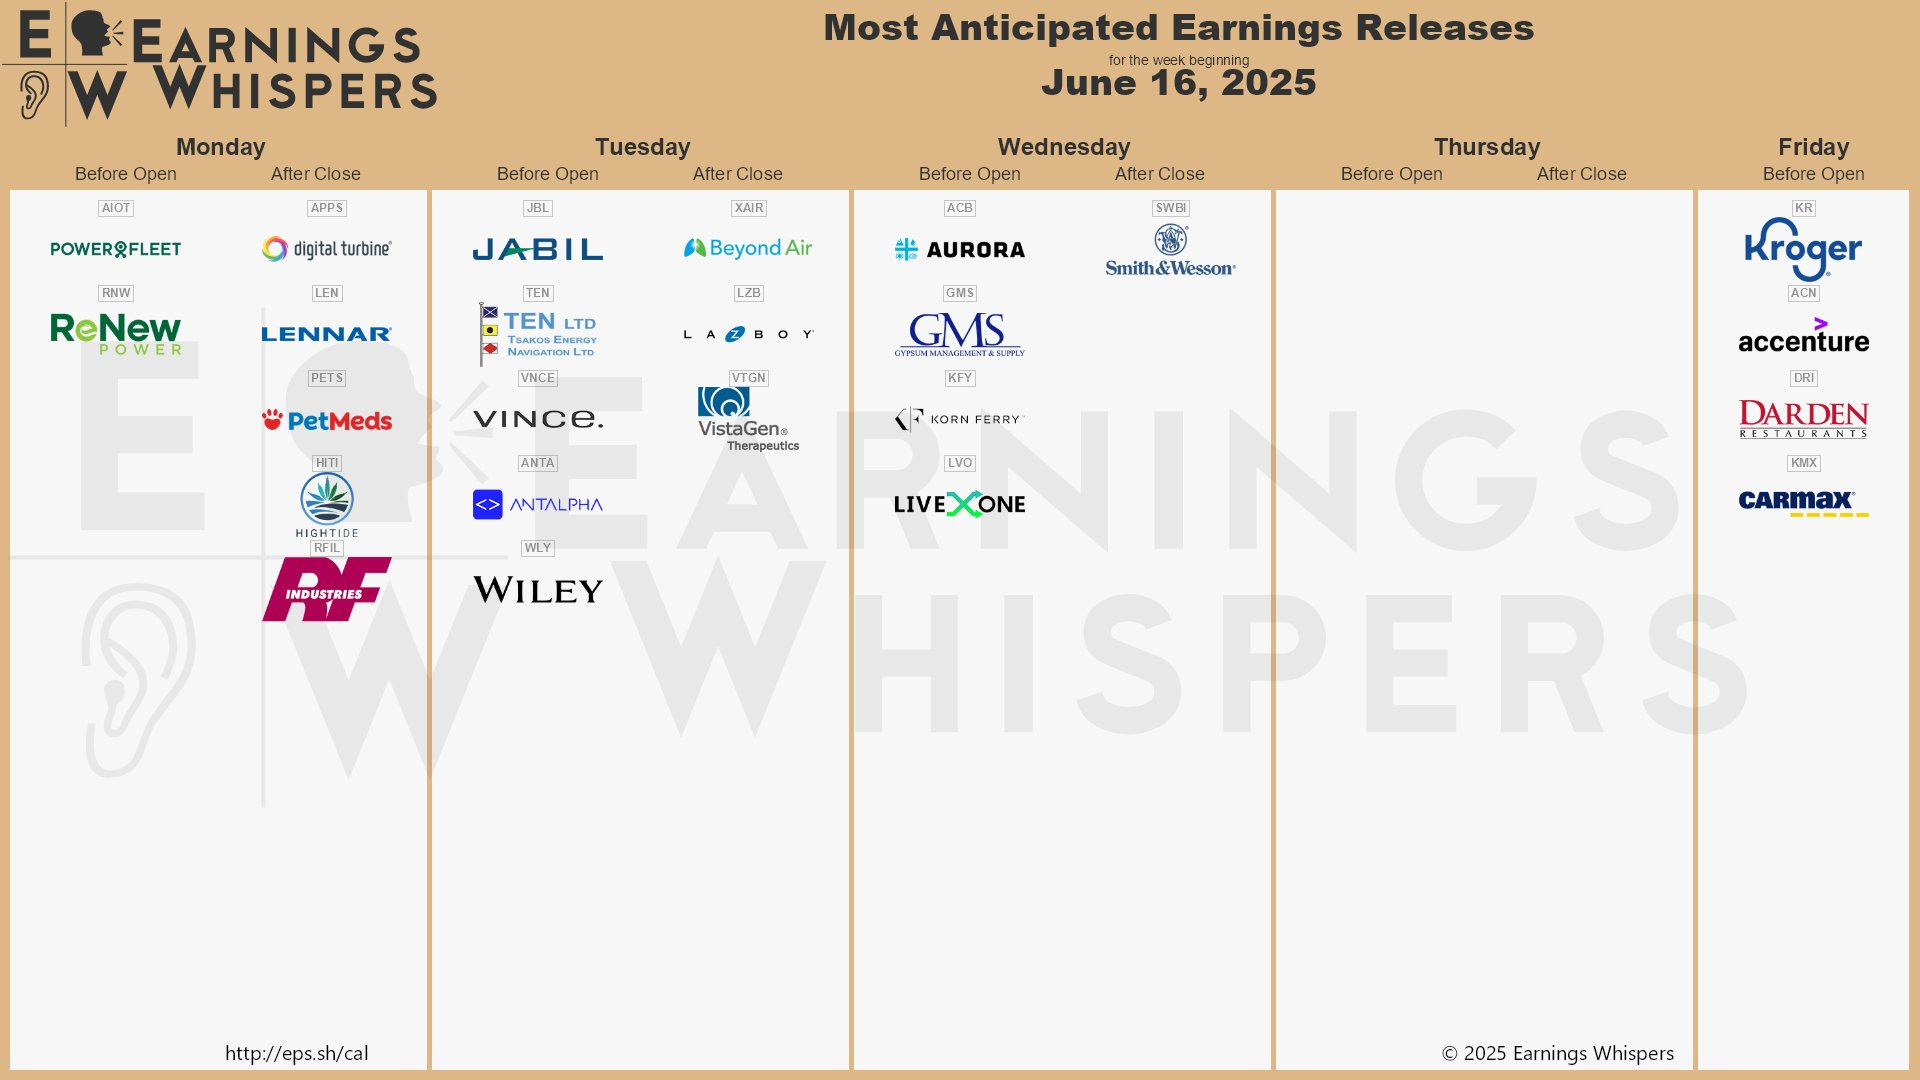
Below are notable stocks reporting earnings next week, along with several key indicators I like to monitor:
Stock Indicators:
3-Month Performance: Assessing recent stock trends.
RSI (Relative Strength Index): A reading above 70 suggests overbought conditions, while below 30 indicates oversold.
P/E Ratio: A value below 25 often points to a "cheap" valuation or low growth expectations.
Stock Price Reactions to Earnings:
1-Day Stock Return on Earnings: How the stock performs on its earnings release day.
Implied Volatility: The options market's forecast for the expected 1-day stock move after earnings.

3. Stock Analysis of the Week
Every week, I share my analysis of 1 stock that has reported earnings in recent weeks, focusing on implications for long-term investors. This week, I prepared an analysis of Lululemon ($LULU).
👨💻 My View: PASS
Lululemon topped earlier this year as trade war headlines weighed on sentiment. After a short-lived bounce in April and May, sellers stepped back in after last week’s disappointing earnings.
The stock is now approaching a key support zone around $225-230, which has acted as a floor during previous selloffs. Buyers may try to defend here, but if selling pressure continues, it could open the door for much more downside.
Check out the post for more details about $LULU performance, trend and key levels.
Community Spotlight
This week, I'm glad to feature
- creator of a European investment newsletter - - that turns seven years of real investing experience into digestible insights that make you a smarter investor.Alexis built a simple system focused on strong ETFs and quality opportunities globally, with a special eye for overlooked European businesses most investors miss. He teaches what he learns with brutal honesty, helping you understand what's happening in markets, why it matters, and how it affects you.
The result? Straightforward guidance and a consistent portfolio approach that builds wealth while you get on with your life.
Check out his post where he breaks down the exact 7-step process he uses to analyse stocks - from understanding the business to making the final investment decision

CONCLUSION
Thank you for reading my Weekly Market Recap, which, I hope, got you ready for the week ahead.
If you want to take your investing journey to the next level, consider upgrading to a paid subscription. Subscribe now and learn more about my holistic, end-to-end momentum approach to investing.
Your first month is free, so this is the perfect opportunity to explore the full value of My Weekly Stock with no commitment!
Thanks again, and I look forward to sharing my market recap with you next week.
Happy investing!
My Weekly Stock
DISCLAIMER
The information provided in this newsletter is for informational purposes only and should not be taken as financial advice. Any investments or decisions made based on the information provided in this newsletter are the reader's sole responsibility. We recommend that readers conduct their own research and consult a qualified financial professional before making investment decisions. The author does not assume any responsibility for any losses or damages arising from using the information provided in this newsletter.