


Weekly Market Recap (Mar 10-14): The S&P 500 Bounces After Dipping Into Correction – Is the Worst Behind?
Everything you need to know about last week's markets performance and what to expect next.
Dear readers,
Welcome back to My Weekly Stock, where in-depth market analysis meets proven momentum-based trading strategies. My mission? To help you win in the markets with unbiased, data-driven insights you can act on.
Friday means it's time to review the week in the markets. Each week, I dedicate hours to curating this market recap, preparing insightful analysis with clear visuals and a structured layout—making it easy for you to find exactly what you need, week after week. And because it's easy to get swayed by personal bias, I like to let the data do most of the talking.
If you want the full experience, consider upgrading your subscription. As a paid subscriber, you'll gain access to my 3 winning portfolios—and so much more: a clear investing framework, my momentum-based analysis, and live portfolio updates
Plus, as a token of my appreciation, your first month is FREE. If you're ready to give it a try—or simply want to support my work—this is your chance!
Let's dive in!
SUMMARY
Here are this week's highlights and what to look out for next:
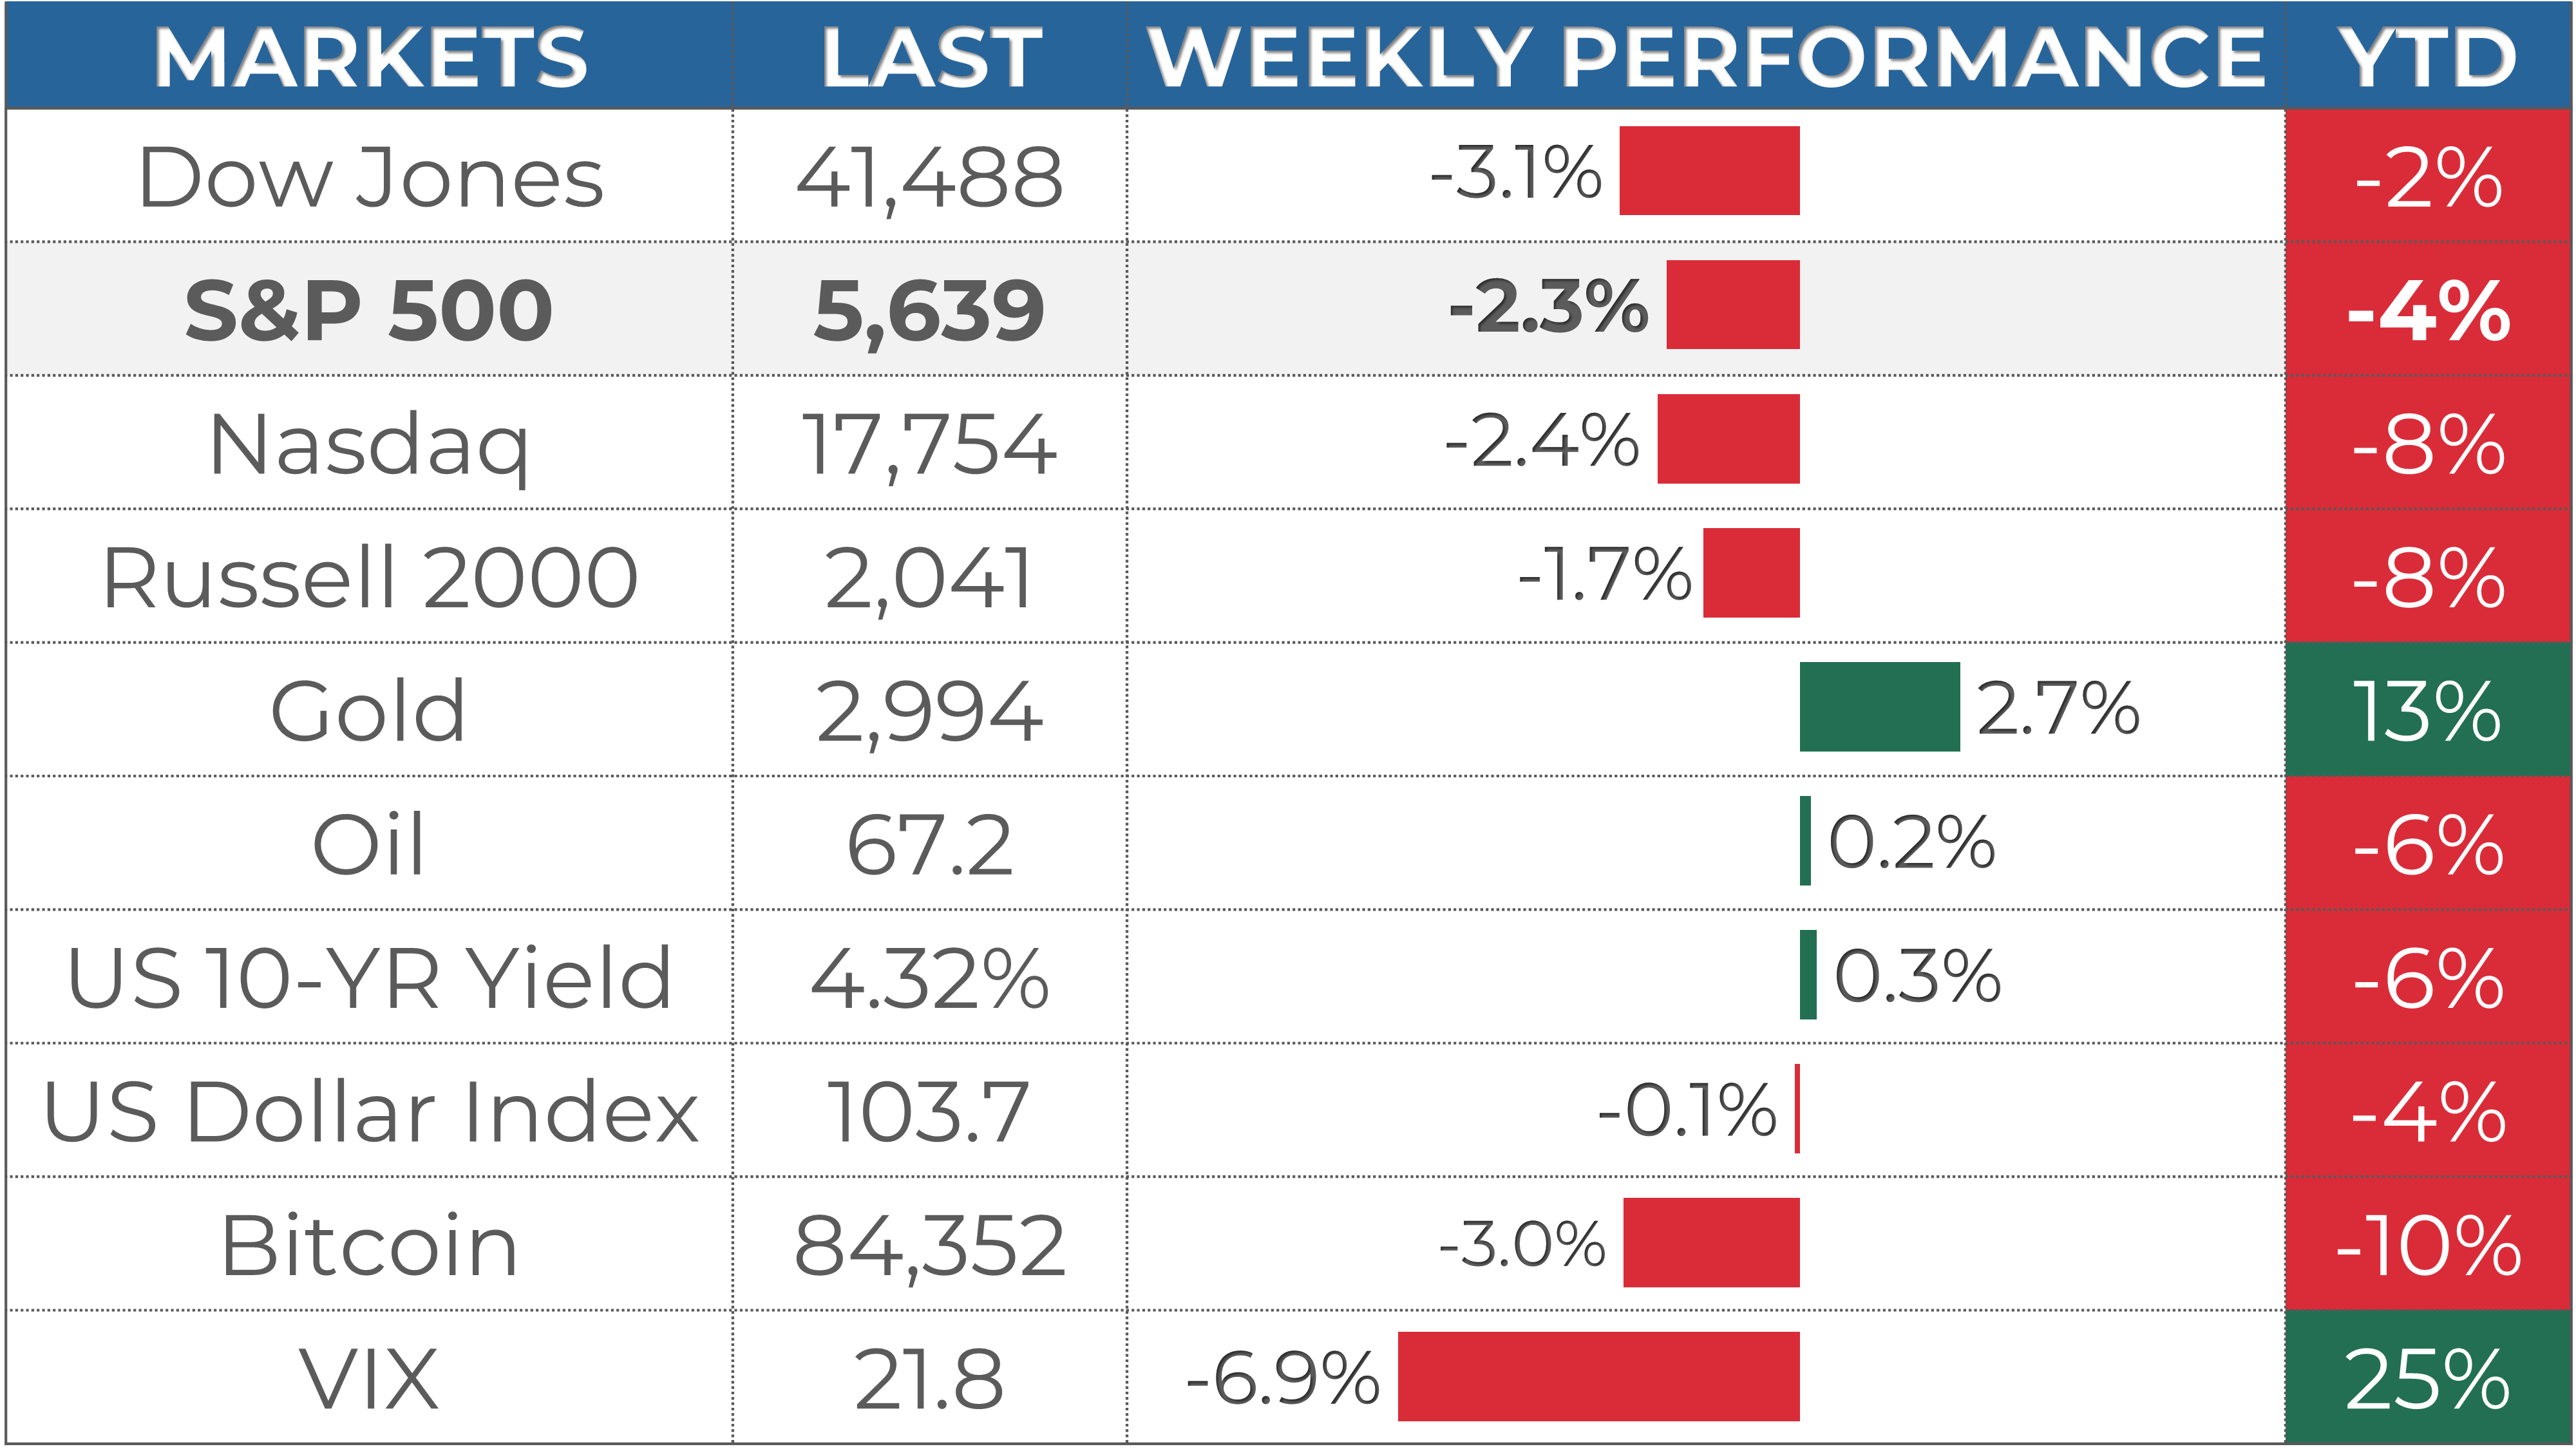
1. The markets were negative this week, with the S&P 500 down -2.3%, the Nasdaq -2.4%, and the Dow Jones -3.1%. Energy (+2.7%) and Utilities (+2%) were the best-performing sectors.
2. The S&P 500's long-term trend is mixed, and the short-term momentum is weak. 5,700 is the next resistance, while 5,500 is support.
3. The Q4 earnings season is almost over and 497 companies from the S&P 500 index have released their quarterly results, with 74% beating estimates. Earnings are expected to be up 17% in Q4 2024 and 11% in 2025.
4. Market sentiment is at the "Extreme Fear" level (21) as measured by CNN’s Fear & Greed indicator, while VIX is at a high value of 22.
5. Earnings reports from Nike and Micron, the Fed meeting and the latest Retail sales data are scheduled for next week.
My take:
The S&P 500 gave bulls another scare last week, briefly dipping into correction territory—down more than 10% from its recent highs—before bouncing on Friday. Although ending on a positive note was encouraging, we're still significantly below the key 21-day EMA, my favorite short-term trend line. So, it's premature to call an end to the pullback.
Next week is unlikely to be easier to navigate with the Fed meeting and retail sales data. Still, it could give us more clarity on the market direction. And while the bounce can continue, caution remains necessary until the index reclaims its short-term trend line.
PERFORMANCE RECAP
1. S&P 500 Sector Performance
This week, 2 out of the 11 S&P 500 sectors posted gains. Energy led the market with a 2.7% increase, while Consumer Cyclical was the laggard, dropping 4.4%.
Year-to-date, 7 sectors have achieved positive performance. Health Care is the top-performing sector with a 5.4 % gain, while Consumer Cyclical lags behind, with a 12.3 % loss.

2. S&P 500 Top & Worst Performers
Over the last five trading days, 24% of the stocks in the S&P 500 index rose in value.
Top Performers:
$INTC (Intel Corp): 16.5%
$SMCI (Super Micro Computer Inc): 10.3%
$AES (AES Corp): 9.4%
$COP (Conoco Phillips): 9.2%
$VST (Vistra Corp): 8.9%
Worst Performers:
$AAPL (Apple Inc): -10.7%
$UAL (United Airlines Holdings Inc): -11.1%
$EXPE (Expedia Group Inc): -12.1%
$ADBE (Adobe Inc): -12.2%
$DAL (Delta Air Lines, Inc): -12.3%

In addition, 25 stocks within the S&P 500 reached a new 52-week high, while 47 stocks set new lows. The majority of this week’s lows came from the Technology sector.
Notable Highs:
$ABBV (Abbvie Inc)
$IBM (International Business Machines Corp)
$MCD (McDonald's Corp)
$VZ (Verizon Communications Inc)
$GILD (Gilead Sciences, Inc)
Notable Lows:
$MSFT (Microsoft Corporation)
$ADBE (Adobe Inc)
$$AMD (Advanced Micro Devices Inc)
$AMAT (Applied Materials Inc)
$SNPS (Synopsys, Inc)

MARKET MOMENTUM
1. Momentum Review
To evaluate the market's current health, I examine 4 key elements: performance, breadth, trends, and key levels. Healthy bull markets typically feature indices setting new highs, broad market participation, and ascending trend lines.
Performance (WEAK 🔴): evaluating recent market performance to gauge the momentum’s strength. Ideally i want to see returns accelerating short-term and index trading less than 5% from its 1-year high
1-month performance: -6.7% 🔴
3-month performance: -6.6% 🔴
vs. 1-year high: -8.2% 🟡
Breadth (WEAK 🔴): assessing market participation to understand the health of the trend. Extreme levels (above 80% or below 20%) may indicate overextended trends.
% of stocks above 200-day moving average: 39% (down from 50% last week) 🔴
% of stocks above 20-day moving average: 27% (down from 42% last week) 🔴
Trends: analyzing trend strength across multiple timeframes using exponential moving averages, scored on a scale of 1 to 5. A score of 3 or above suggests solid trends and supports holding a position.
Weekly chart: MIXED ⭐️⭐️

Daily chart: WEAK

4-hour chart: WEAK ⭐️

Key levels: identifying critical price zones to confirm the current trend or signal a potential reversal.
Support:
$5,190 (-8.0%)
$5,410 (-4.1%)
$5,500 (-2.5%)
Resistance:
$5,700 (+1.1%)
$5,850 (+3.7%)
$6,000 (+6.4%)
Enjoying the analysis so far? There’s so much more in the paid version, where I cover 70+ stocks and ETFs every month. Subscribe now to learn how I connect strategy to insights and, ultimately, portfolio decisions.
2. Post of the Week
This week's momentum analysis is about the Mega Caps. Using a combination of performance metrics and technical indicators, I've developed a proprietary algorithm to rank 10 mega caps. Based on this approach, I've identified Berkshire Hathaway ($BRK), Meta Platforms ($META) and Eli Lilly ($LLY) as having the best relative momentum currently.
EARNINGS & ECONOMIC REPORTS RECAP
1. Earnings Outlook
Q4 Earnings: S&P 500 earnings are expected to grow by 17%, rising to 21% when excluding the energy sector.
2025 Full-Year Outlook: Earnings are expected to increase by 11%, above the 10-year average growth of 9%.
Analyst Revisions: Over the past month, 41% of all earnings revisions by analysts have been upward adjustments to their outlook.
Valuation: The forward 4-quarter P/E ratio stands at 20.4, above the 5-year and 10-year historical averages.

2. Earnings Season Recap
Out of 497 S&P 500 companies that have reported fourth-quarter earnings, 74% exceeded EPS expectations. It is slightly below with the four-quarter average of 78% but above the historical average of 67%.
Below are some notable companies that reported earnings last week. I’ve highlighted their EPS and revenue performance vs estimate, as well as their stock return this week.
One highlight of the week was Adobe, which topped Revenues and EPS estimates. However, the stock still lost 12% for the week.

3. Economic Reports
Here are this week’s key economic reports:
This week’s inflation data came in softer than expected, easing concerns over persistent price pressures.
CPI (YoY) for February rose 2.8%, slightly below the 2.9% forecast, signaling a modest deceleration in inflation.
Core CPI (MoM) and Headline CPI (MoM) both increased by 0.2%, softer than the expected 0.3% and previous month.
PPI (MoM) came in flat at 0.0%, below expectations of 0.3% and cooling from the prior month’s 0.6%.

MARKET SENTIMENT
Measures of investor sentiment can be helpful as they provide insight into the views and opinions of professional or individual investors. While not definitive predictors of market direction, these measures can serve as a valuable complement to other indicators and analysis tools, helping to paint a more comprehensive picture of the market's current state.

1. AAII Sentiment Survey (Individual Investors)
The American Association of Individual Investors (AAII) conducts a weekly survey to gauge members' expectations for the stock market over the next six months. Results are published every Wednesday.
In the latest survey, 19% of respondents had a bullish outlook, stable from 19% the previous week.
2. BofA Bull & Bear Indicator (Institutional Investors)
The Bank of America Bull-Bear Indicator measures investor sentiment based on fund managers' and institutional investors' views. Scores range from 0 (extremely bearish) to 10 (extremely bullish).
The most recent reading was 5.4, a neutral sentiment.
3. CNN Fear & Greed Index (Technical)
This daily measure analyzes seven indicators to assess how emotions drive market decisions. Scores range from Extreme Fear to Extreme Greed.
The index closed at 21 (Extreme Fear), flat from 21 last Friday.
THE WEEK AHEAD
1. Economic Calendar
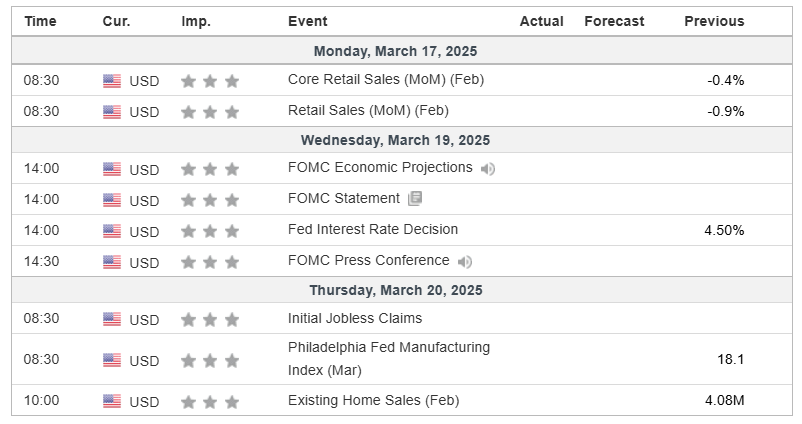
This week brings two major events that could drive market sentiment:
Retail Sales (Monday, March 17): Markets will be closely watching February’s retail sales data, which declined -0.9% last month. Another weak reading could fuel concerns over slowing consumer demand.
FOMC Meeting & Fed Rate Decision (Wednesday, March 19): The Fed is widely expected to hold rates at 4.50%, but all eyes will be on the FOMC economic projections and Powell’s press conference for insights into the Fed’s future policy path.
2. Earnings Calendar
Earnings season continues next week, and 10 companies from the S&P 500, including Nike and Micron, are expected to release their quarterly results.

Below are notable stocks reporting earnings next week, along with several key indicators I like to monitor:
Stock Indicators:
3-Month Performance: Assessing recent stock trends.
RSI (Relative Strength Index): A reading above 70 suggests overbought conditions, while below 30 indicates oversold.
P/E Ratio: A value below 25 often points to a "cheap" valuation or low growth expectations.
Stock Price Reactions to Earnings:
1-Day Stock Return on Earnings: How the stock performs on its earnings release day.
Implied Volatility: The options market's forecast for the expected 1-day stock move after earnings.

3. Stock Analysis of the Week
Every week, I share my analysis of 1 stock that has reported earnings in recent weeks, focusing on implications for long-term investors. This week, I prepared an analysis of CrowdStrike ($CRWD).
👨💻 My View: HOLD
The past year has been a wild ride for $CRWD shareholders. The stock surged to $400 by July before plunging 50% in a matter of weeks due to the IT outage. It then staged an impressive recovery, reaching a new all-time high of $450 in early February.
However, like many growth stocks, the past month has been rough, particularly with a 14% selloff following the earnings report.
While I’m not turning bearish just yet, I always get concerned when a stock loses its 30-week EMA—my favorite long-term trend indicator.
The stock is attempting to bounce this week, but I would like to see it firmly reclaim the 30-week EMA soon to remain constructive on the trend
Check out the post for more details about $CRWD performance, trend and key levels.
CONCLUSION
Thank you for reading my Weekly Market Recap, which, I hope, got you ready for the week ahead.
If you want to take your investing journey to the next level, consider upgrading to a paid subscription. Subscribe now and learn more about my holistic, end-to-end momentum approach to investing.
Your first month is free, so this is the perfect opportunity to explore the full value of My Weekly Stock at no risk!
Thanks again, and I look forward to sharing my market recap with you next week.
Happy investing!
My Weekly Stock
DISCLAIMER
The information provided in this newsletter is for informational purposes only and should not be taken as financial advice. Any investments or decisions made based on the information provided in this newsletter are the reader's sole responsibility. We recommend that readers conduct their own research and consult a qualified financial professional before making investment decisions. The author does not assume any responsibility for any losses or damages arising from using the information provided in this newsletter.