


Weekly Market Recap (Mar 3-7): The S&P 500 Goes Negative for 2025 – More Pain Ahead?
Everything you need to know about last week's markets performance and what to expect next.
Dear readers,
Welcome back to My Weekly Stock, where in-depth market analysis meets proven momentum-based trading strategies. My mission? To help you win in the markets with unbiased, data-driven insights you can act on.
Friday means it's time to review the week in the markets. Each week, I dedicate hours to curating this market recap, preparing insightful analysis with clear visuals and a structured layout—making it easy for you to find exactly what you need, week after week. And because it's easy to get swayed by personal bias, I like to let the data do most of the talking.
If you want the full experience, consider upgrading your subscription. As a paid subscriber, you'll gain access to my 3 winning portfolios—and so much more: a clear investing framework, my momentum-based analysis, and live portfolio updates
Plus, as a token of my appreciation, your first month is FREE. If you're ready to give it a try—or simply want to support my work—this is your chance!
Let's dive in!
SUMMARY
Here are this week's highlights and what to look out for next:
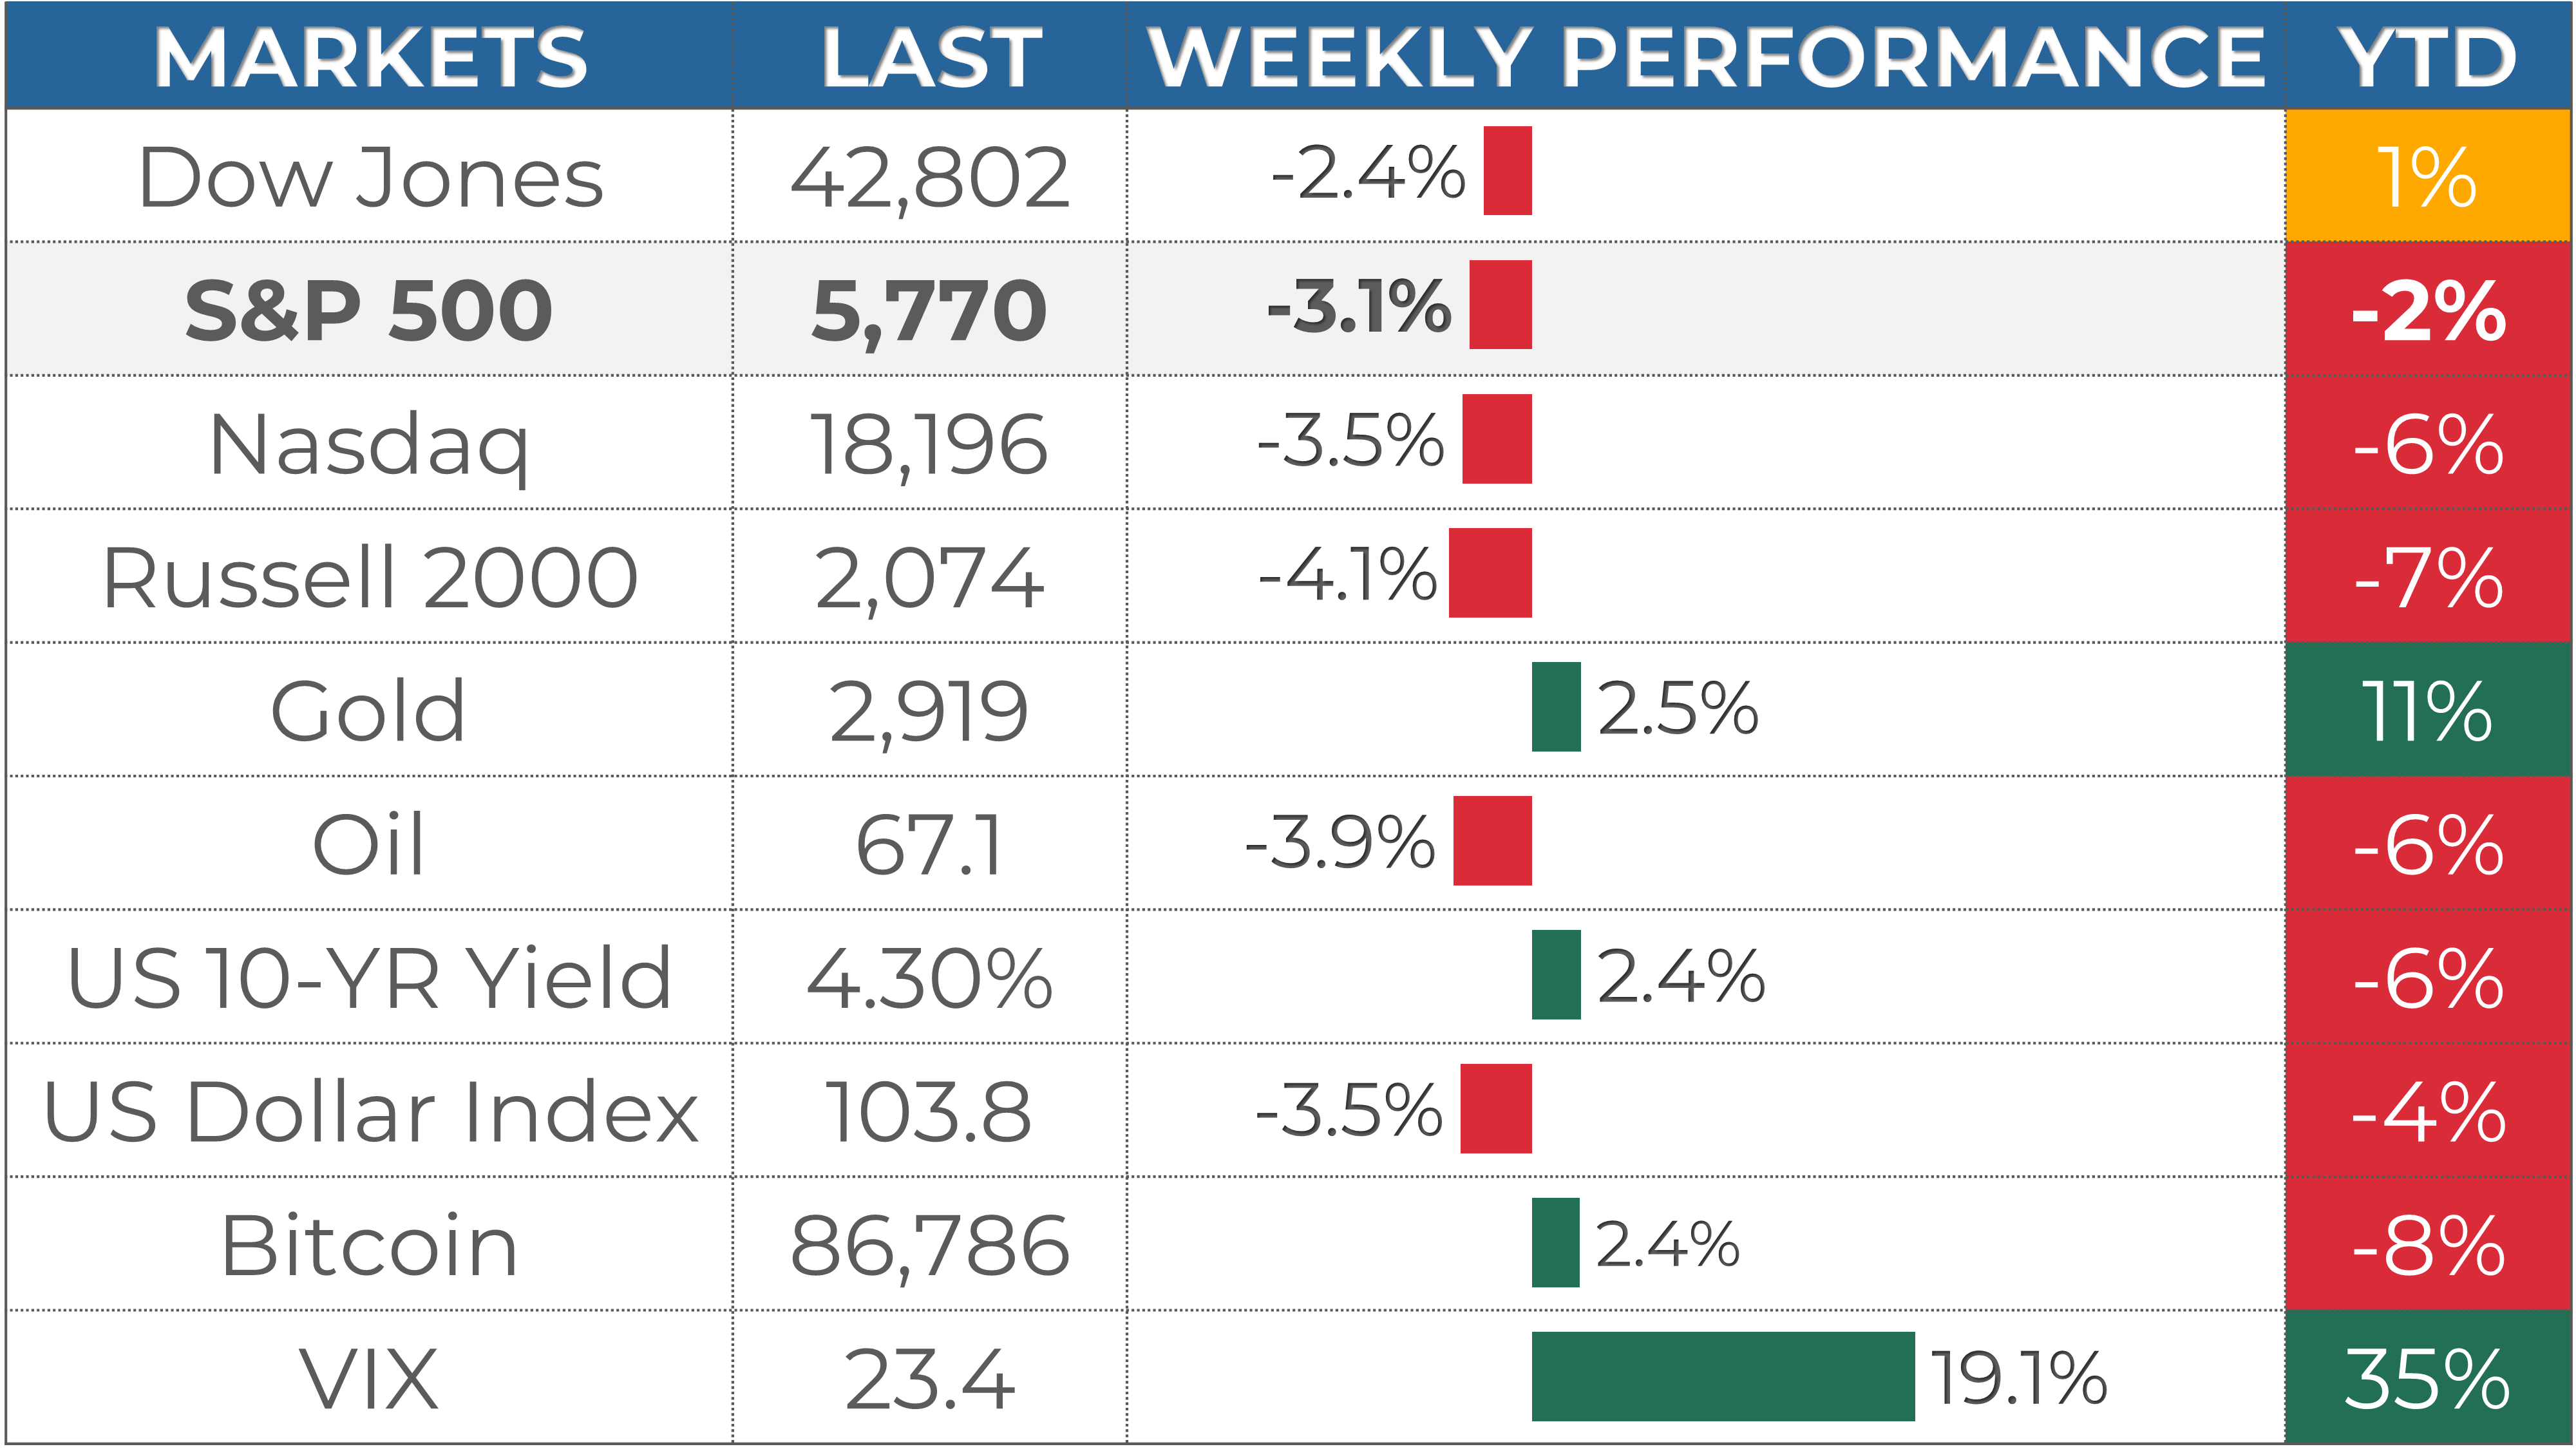
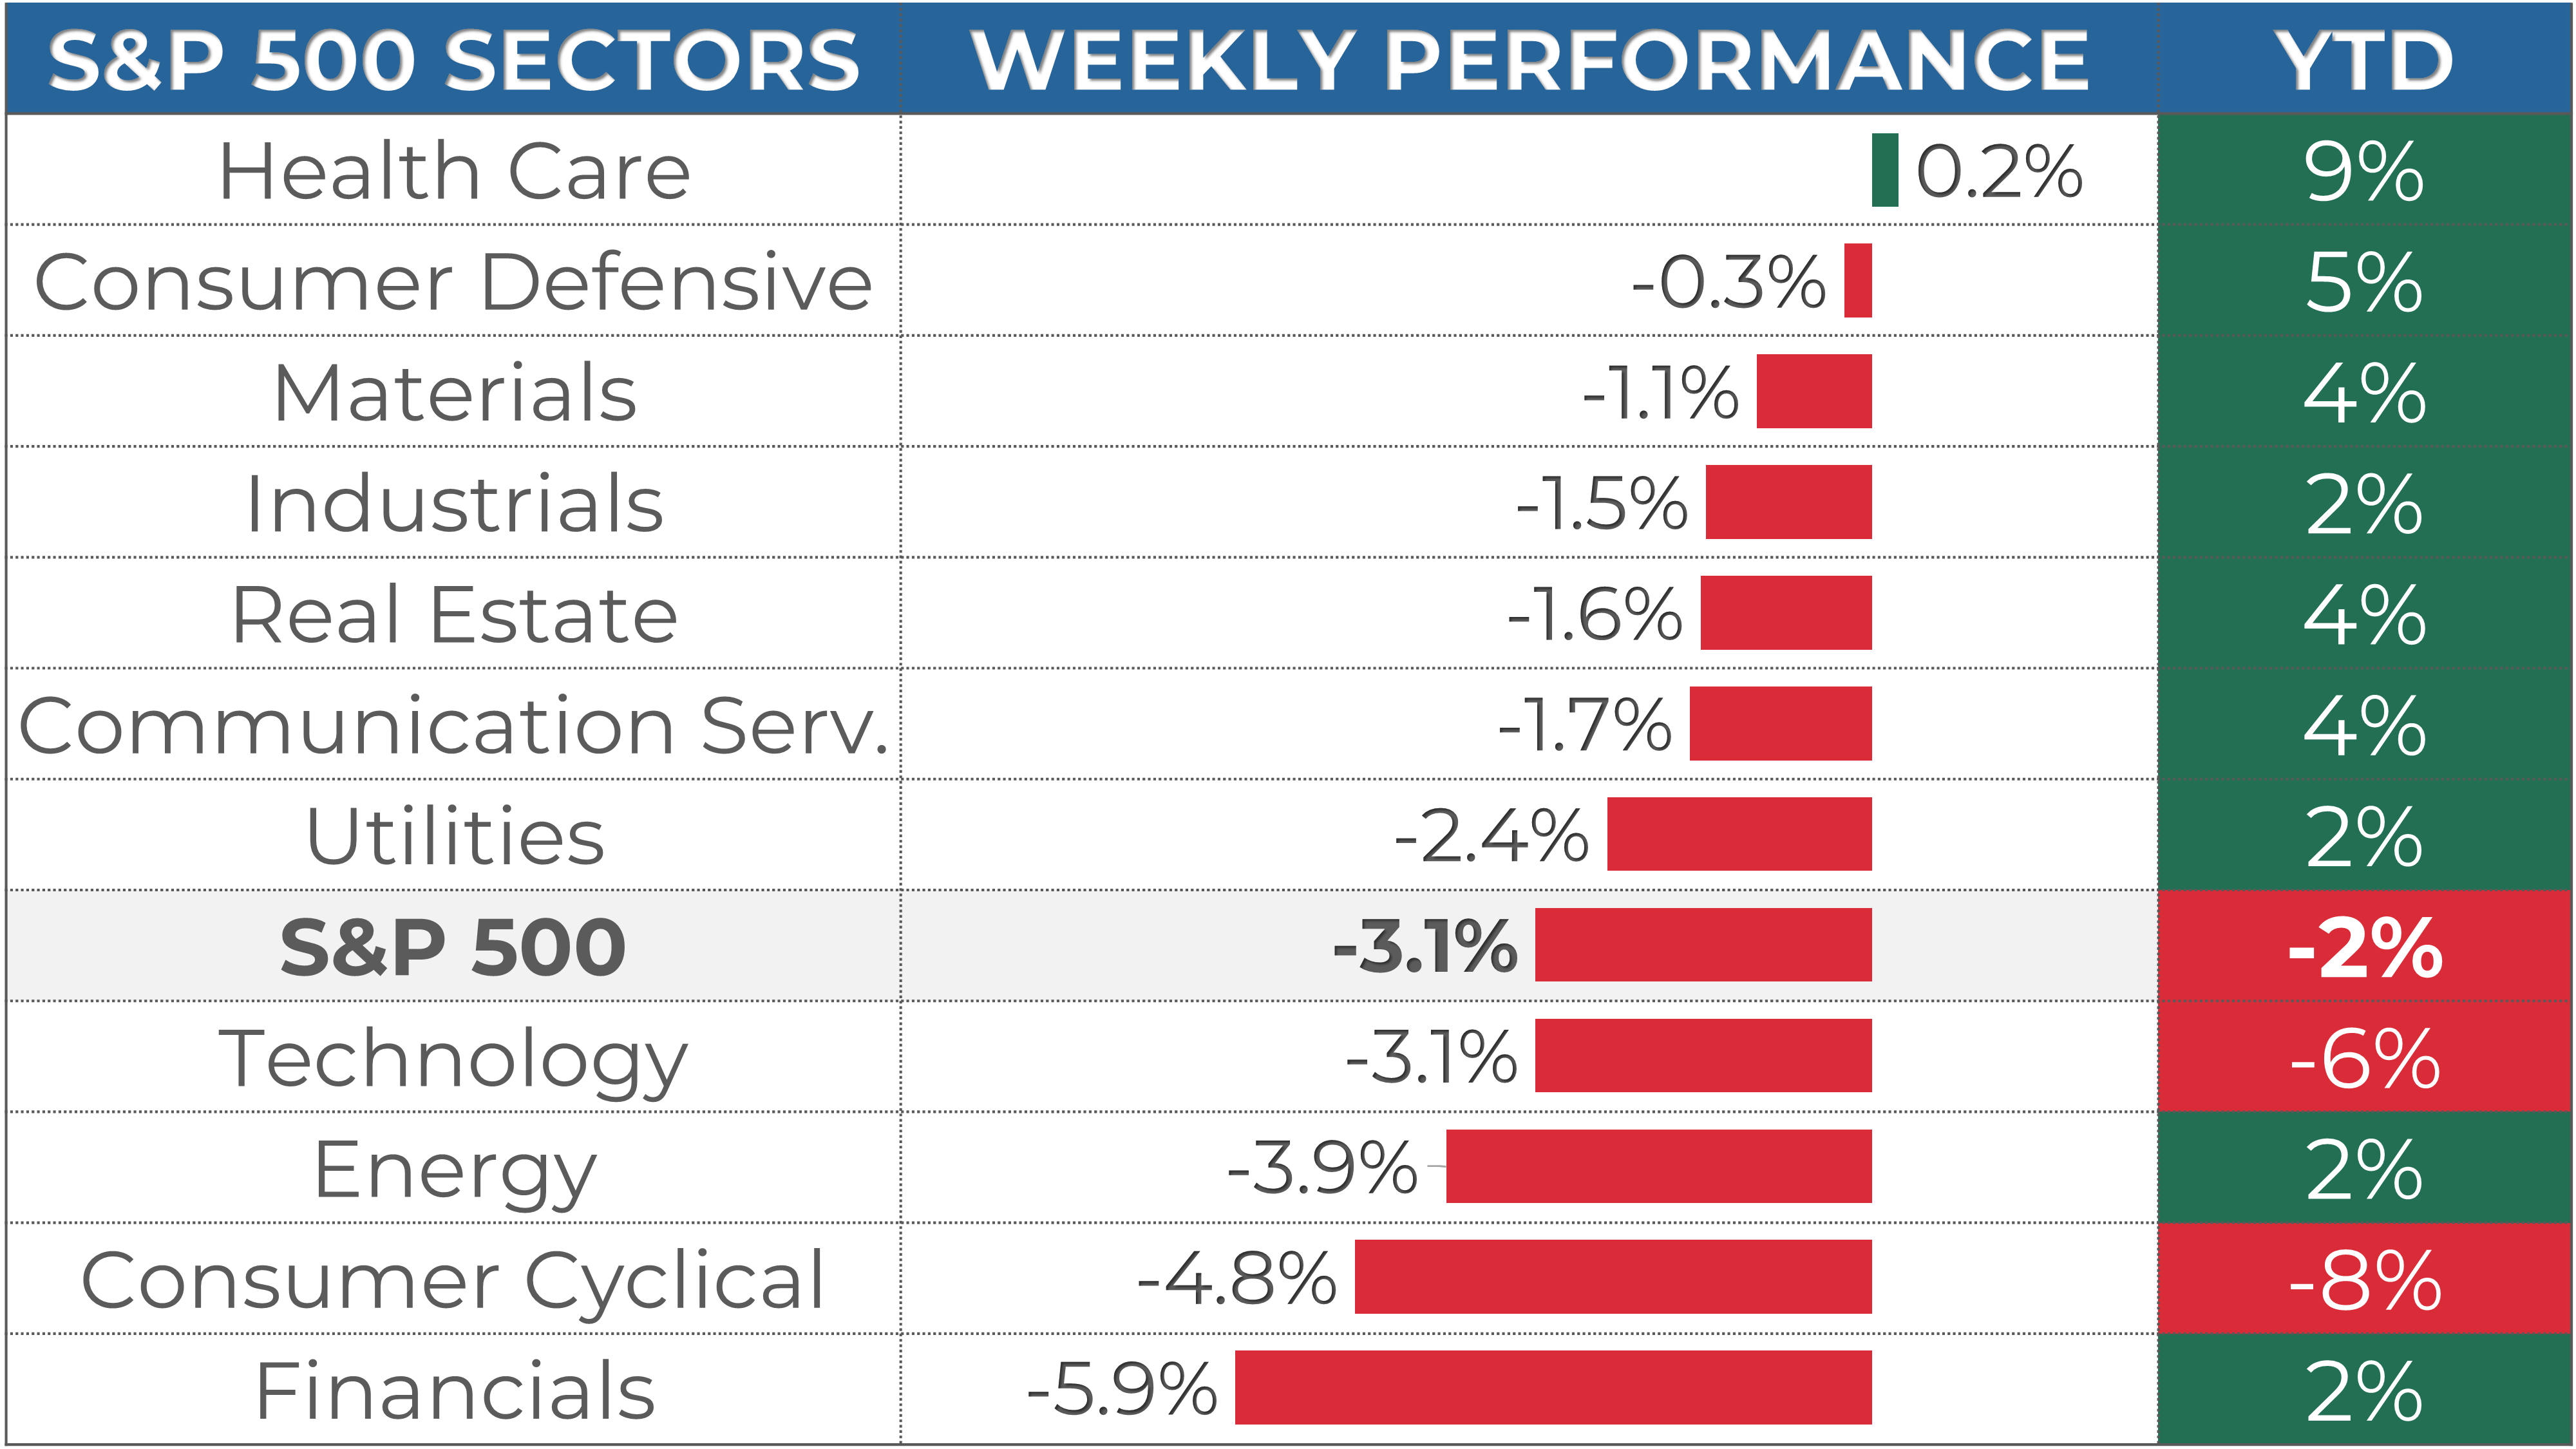
1. The markets were negative this week, with the S&P 500 down -3.1%, the Nasdaq -3.5%, and the Dow Jones -2.4%. Health Care (+0.2%) and Consumer Defensive (-0.3%) were the best-performing sectors.
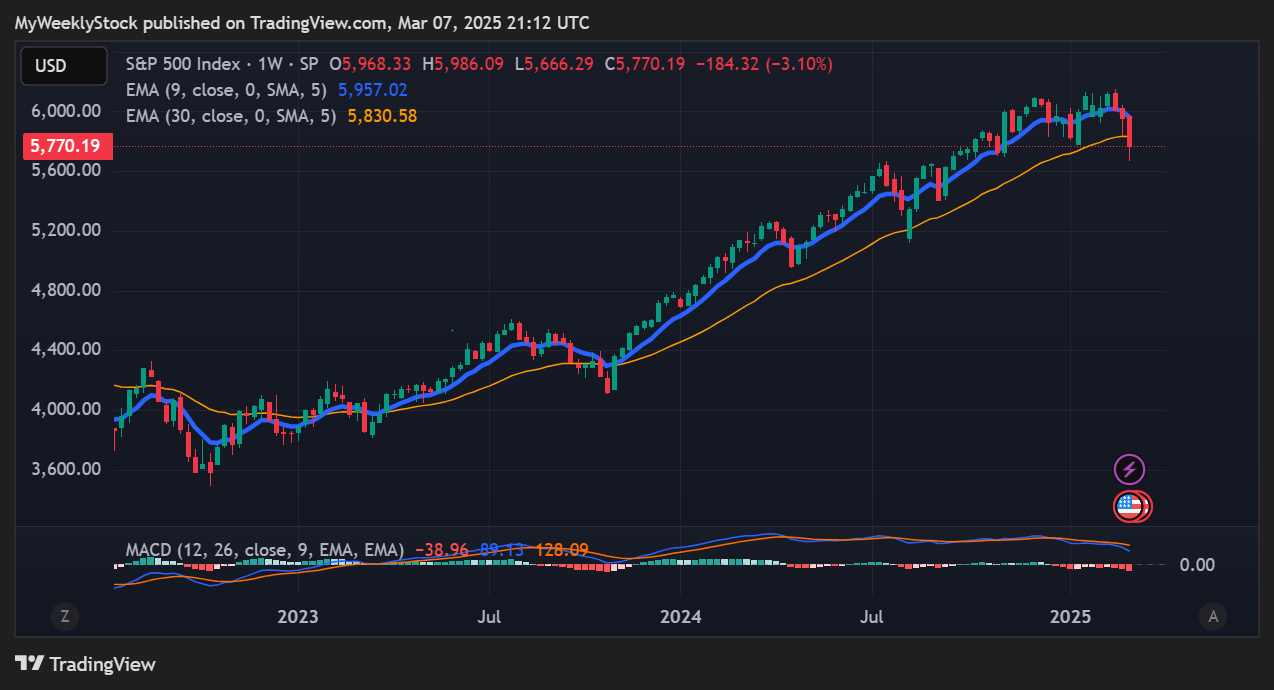
2. The S&P 500's long-term trend is positive, and the short-term momentum is weak. 5,850 is the next resistance, while 5,670 is support.
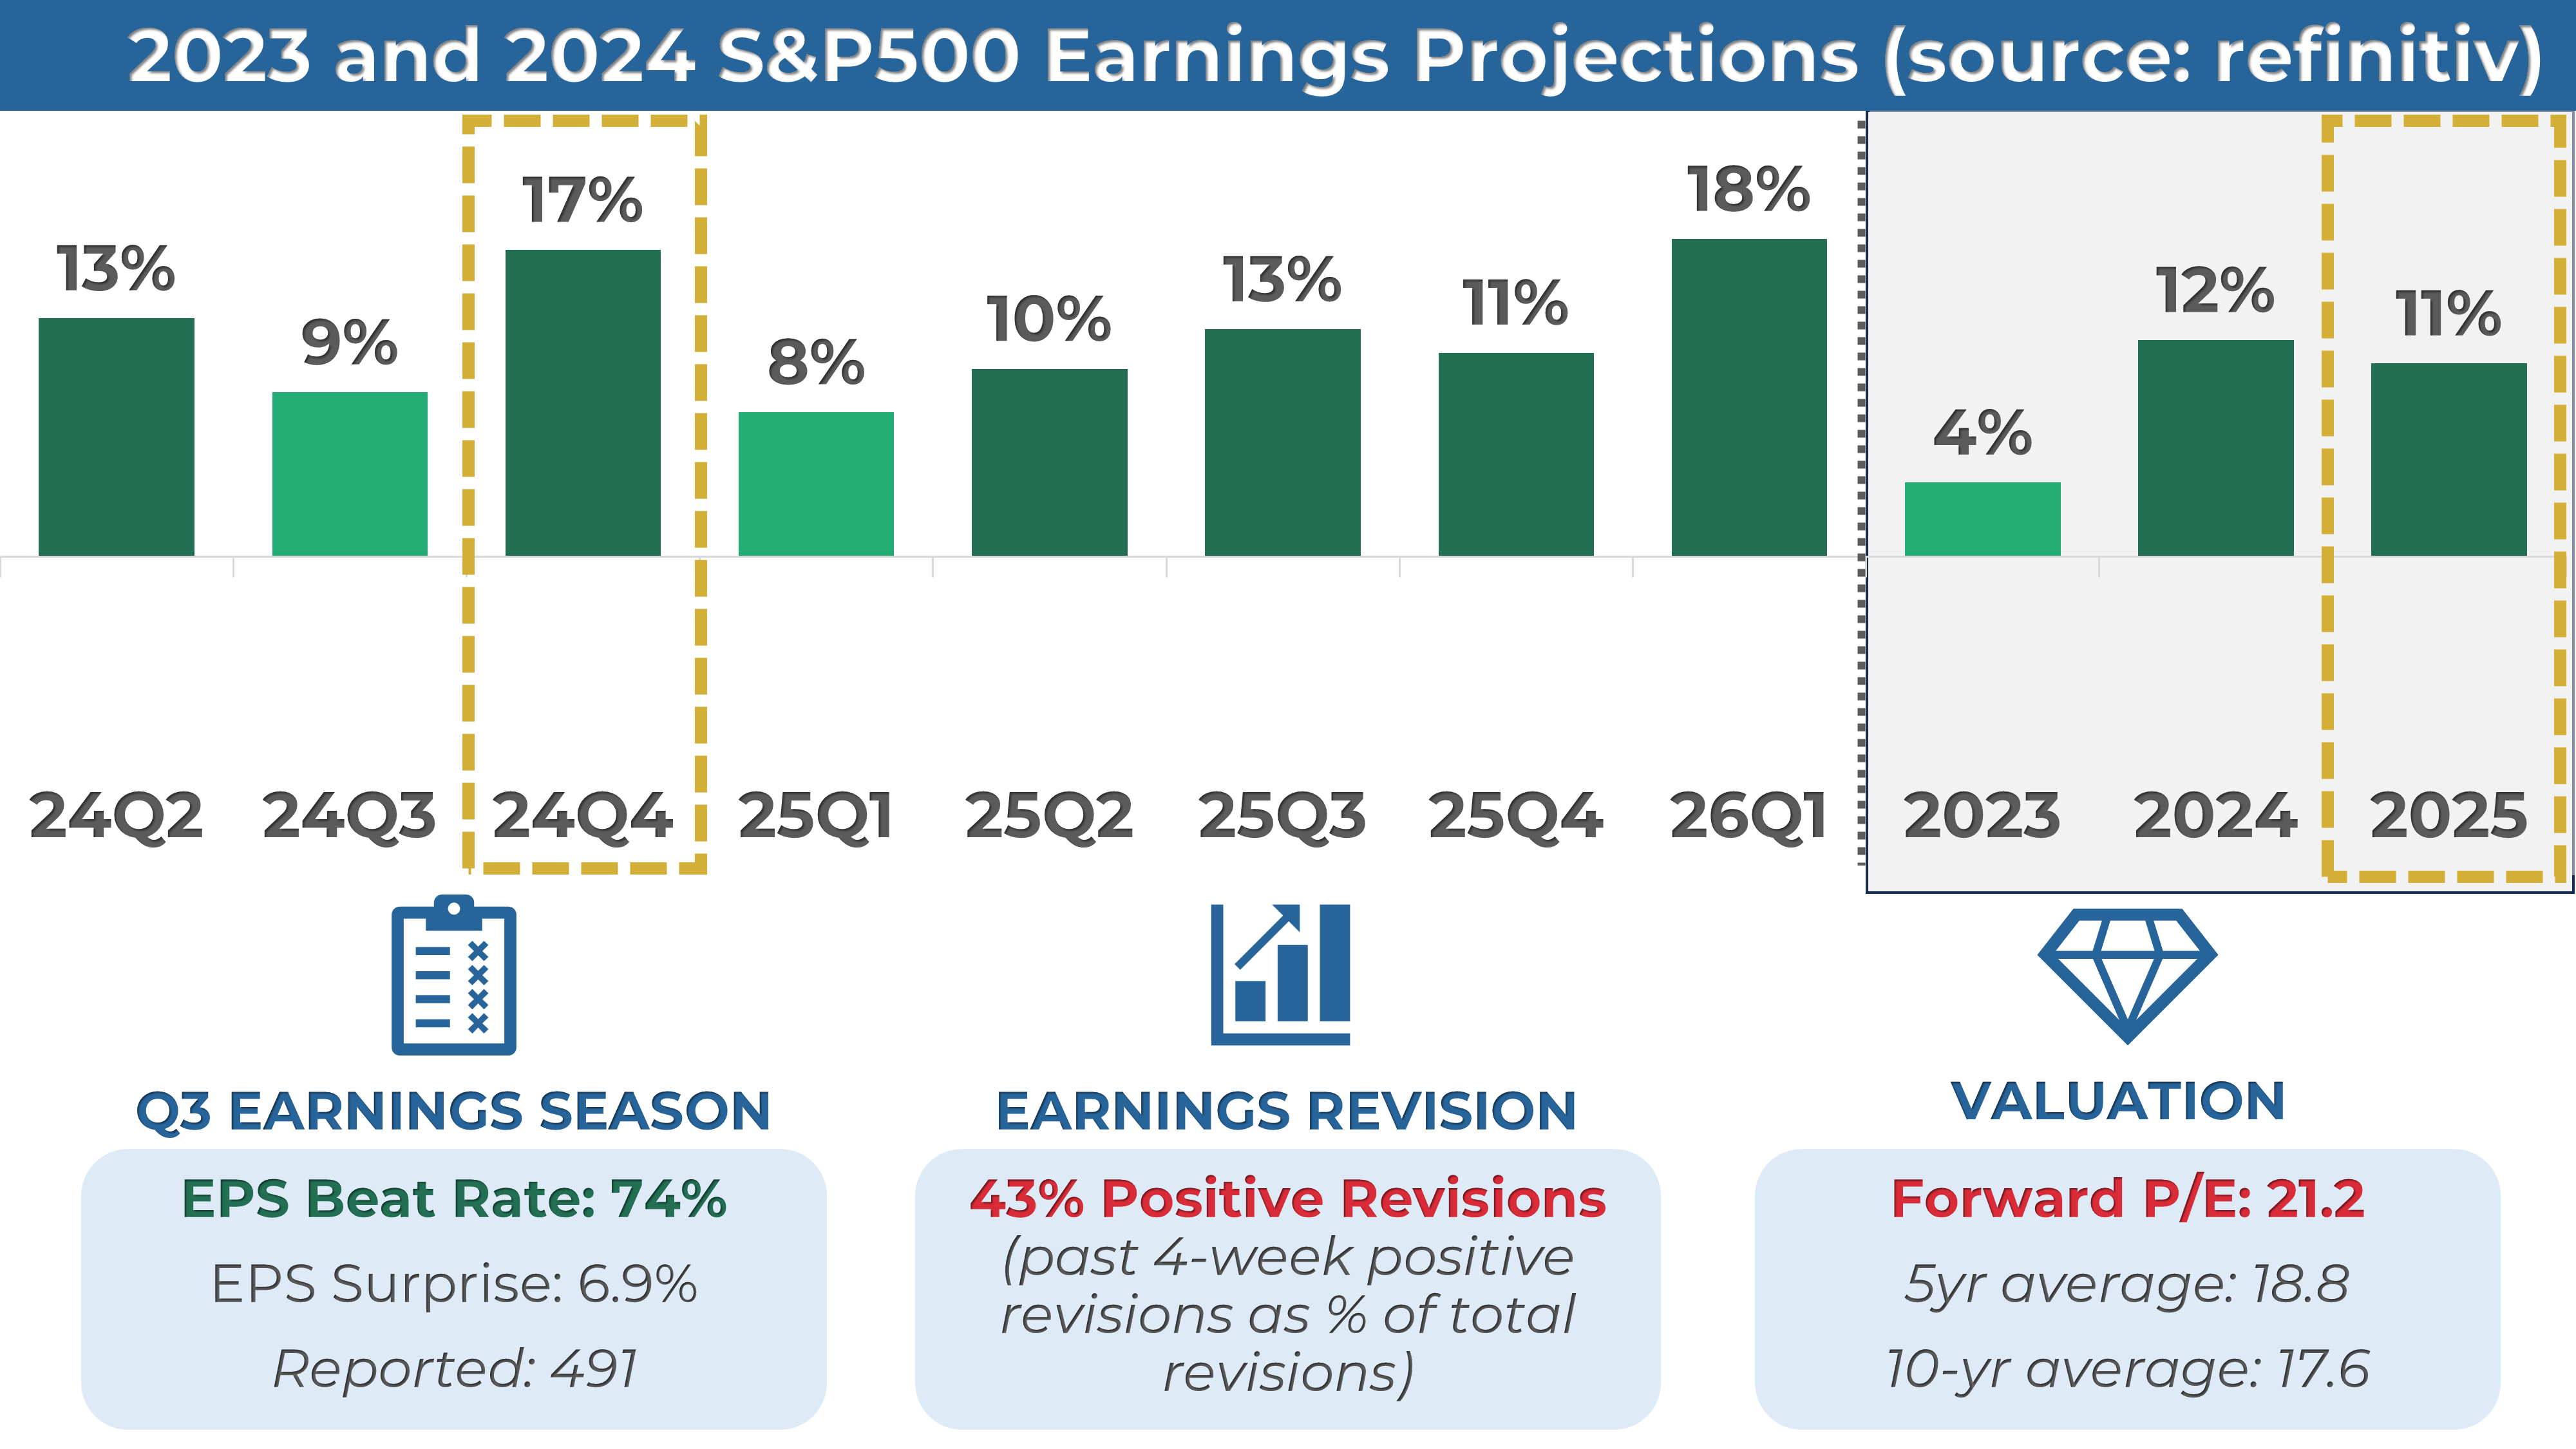
3. The Q4 earnings season is almost over and 491 companies from the S&P 500 index have released their quarterly results, with 74% beating estimates. Earnings are expected to be up 17% in Q4 2024 and 11% in 2025.
4. Market sentiment is at the "Extreme Fear" level (21) as measured by CNN’s Fear & Greed indicator, while VIX is at a high value of 23.
5. Earnings reports from Oracle and Adobe, and the latest CPI and PPI data are scheduled for next week.
My take:
Last week, I questioned whether the bounce we saw on Friday would mark a swing low or just be another short-lived relief rally. Unfortunately for the bulls, there was no follow-through, and the S&P 500 logged its worst week since September, effectively erasing all gains from the U.S. election.
The question isn’t whether we’ll see a bounce—it’s long overdue—but rather how strong it will be and whether it can spark a sustained rally to reclaim lost support levels. Next week’s inflation data could provide some relief, but reassuring the markets may take more than that. Until we see genuine strength, it’s too soon to say the worst of this pullback is behind us.
PERFORMANCE RECAP
1. S&P 500 Sector Performance
This week, 1 out of the 11 S&P 500 sectors posted gains. Health Care led the market with a 0.2% increase, while Financials was the laggard, dropping 5.9%.
Year-to-date, 9 sectors have achieved positive performance. Health Care is the top-performing sector with a 8.5 % gain, while Consumer Cyclical lags behind, with a 8.3 % loss.
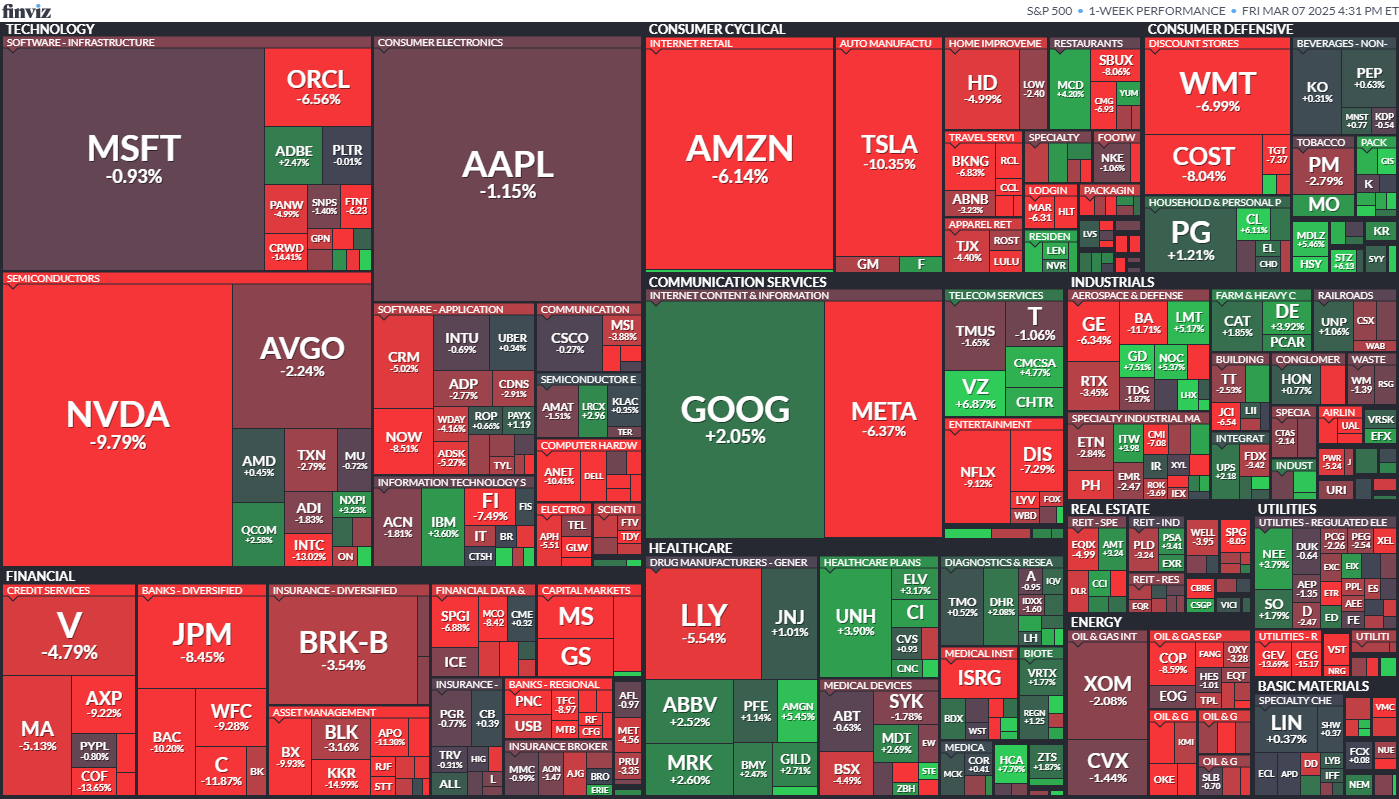
2. S&P 500 Top & Worst Performers
Over the last five trading days, 38% of the stocks in the S&P 500 index rose in value.
Top Performers:
$MRNA (Moderna Inc): 15%
$FMC (FMC Corp): 11.9%
$HII (Huntington Ingalls Industries Inc): 11.6%
$BF-B (Brown-Forman Corp): 11.5%
$DG (Dollar General Corp): 10.3%
Worst Performers:
$VST (Vistra Corp): -14.5%
$WDC (Western Digital Corp): -14.8%
$KKR (KKR & Co. Inc): -15%
$CEG (Constellation Energy Corporation): -15.2%
$NRG (NRG Energy Inc): -16.7%
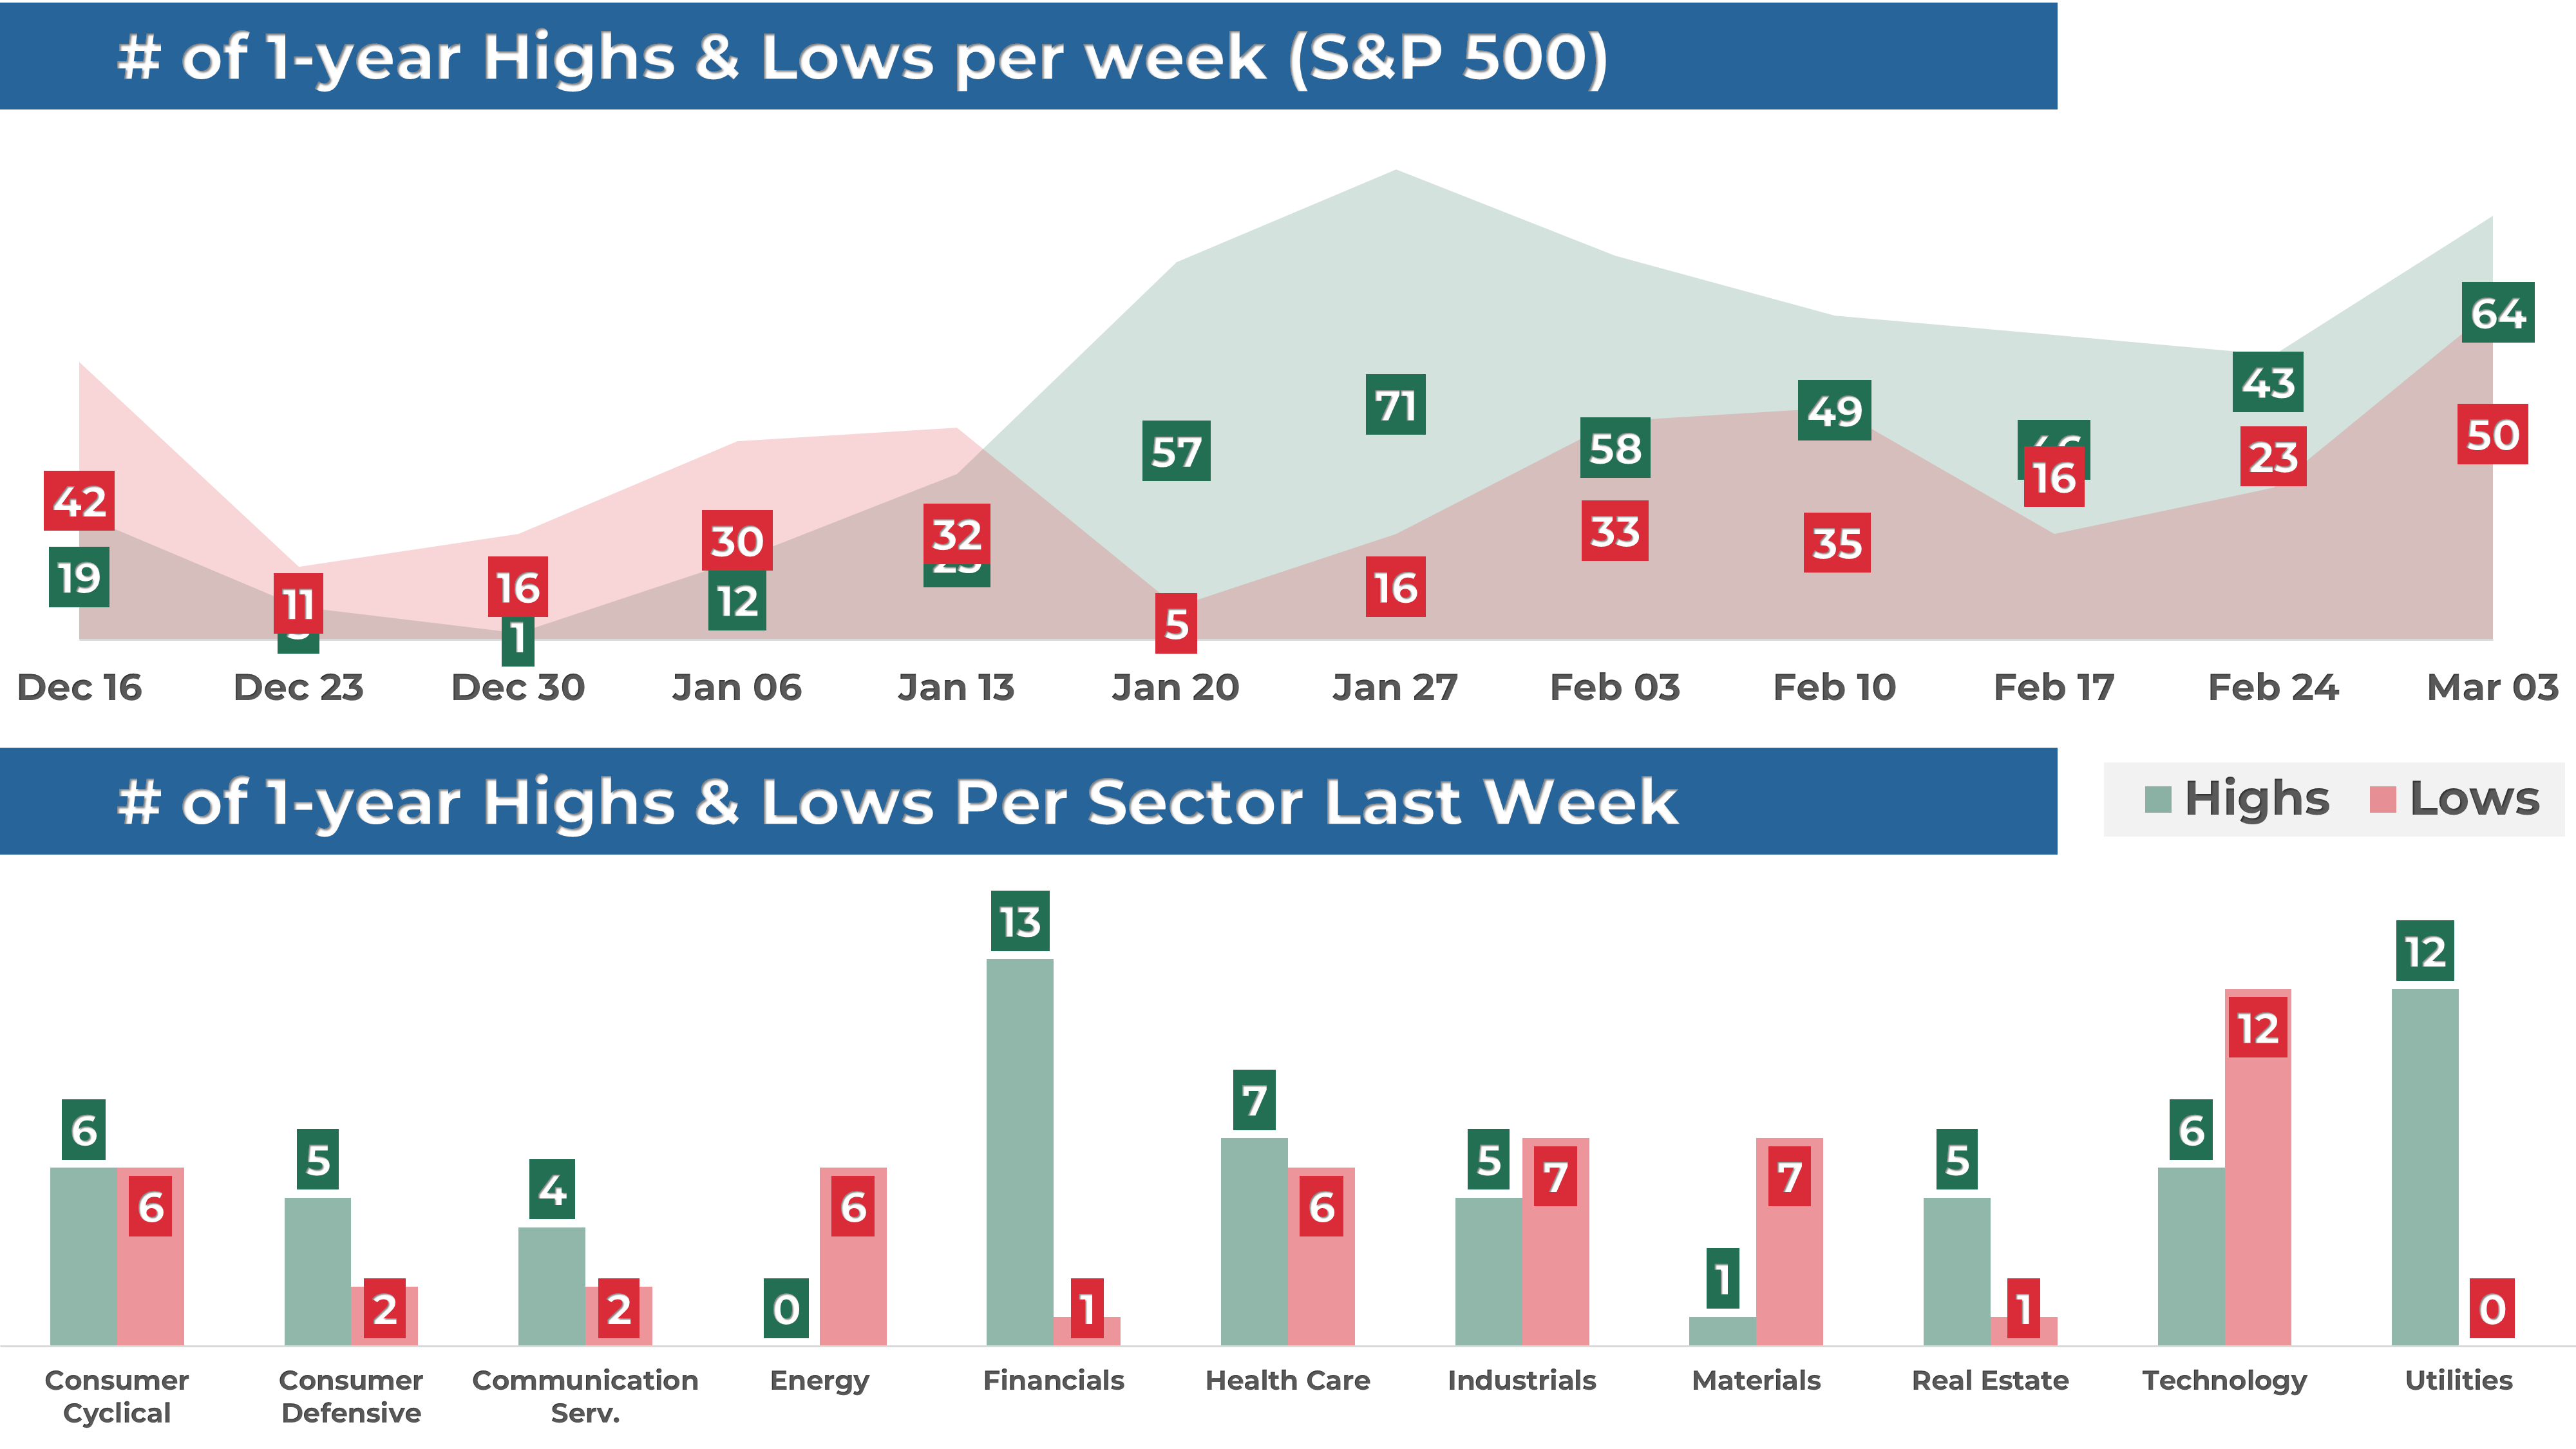
In addition, 64 stocks within the S&P 500 reached a new 16-week high, while 50 stocks set new lows. The majority of this week’s highs came from the Financial sector.
Notable Highs:
$V (Visa Inc)
$MA (Mastercard Incorporated)
$JNJ (Johnson & Johnson)
$ABBV (Abbvie Inc)
$TMUS (T-Mobile US Inc)
Notable Lows:
$MSFT (Microsoft Corporation)
$XOM (Exxon Mobil Corp)
$AMD (Advanced Micro Devices Inc)
$AMAT (Applied Materials Inc)
$COP (Conoco Phillips)
MARKET MOMENTUM
1. Momentum Review
To evaluate the market's current health, I examine 4 key elements: performance, breadth, trends, and key levels. Healthy bull markets typically feature indices setting new highs, broad market participation, and ascending trend lines.
Performance (WEAK 🔴): evaluating recent market performance to gauge the momentum’s strength. Ideally i want to see returns accelerating short-term and index trading less than 5% from its 1-year high
1-month performance: -4.7% 🔴
3-month performance: -4.6% 🔴
vs. 1-year high: -6.1% 🟡
Breadth (WEAK 🔴): assessing market participation to understand the health of the trend. Extreme levels (above 80% or below 20%) may indicate overextended trends.
% of stocks above 200-day moving average: 50% (down from 58% last week) 🟡
% of stocks above 20-day moving average: 42% (down from 45% last week) 🔴
Trends: analyzing trend strength across multiple timeframes using exponential moving averages, scored on a scale of 1 to 5. A score of 3 or above suggests solid trends and supports holding a position.
Weekly chart: SOLID ⭐️⭐️⭐️
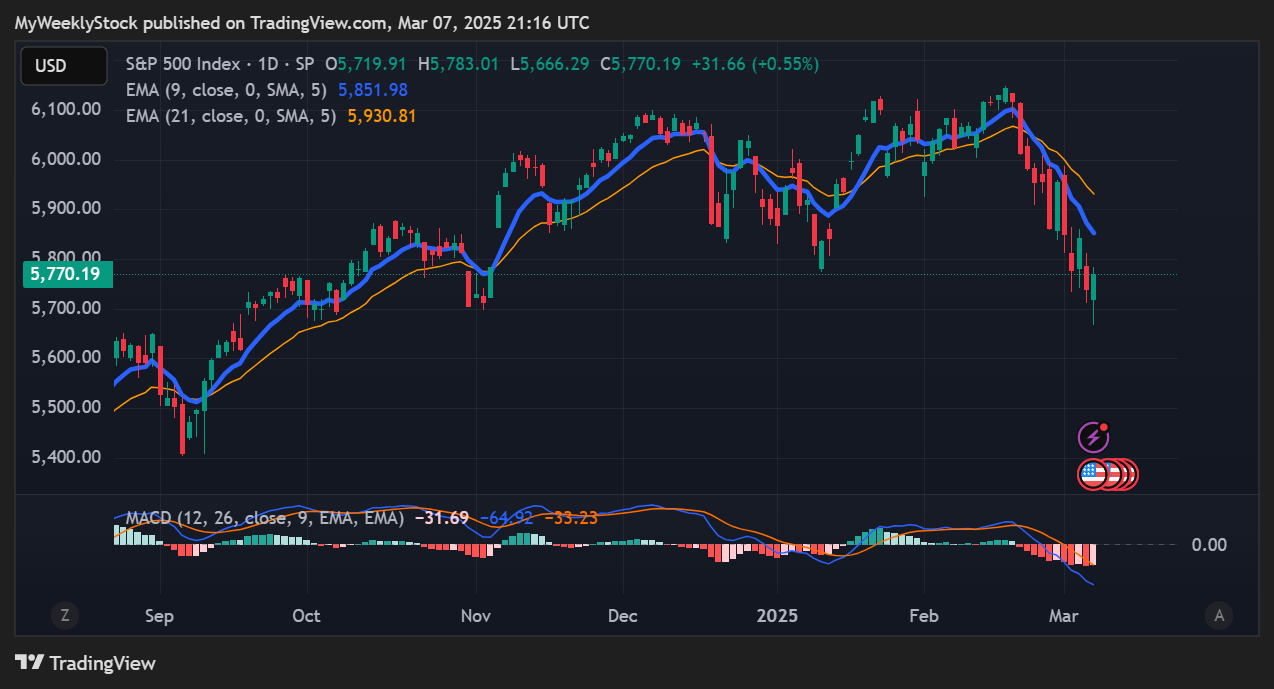
Daily chart: WEAK
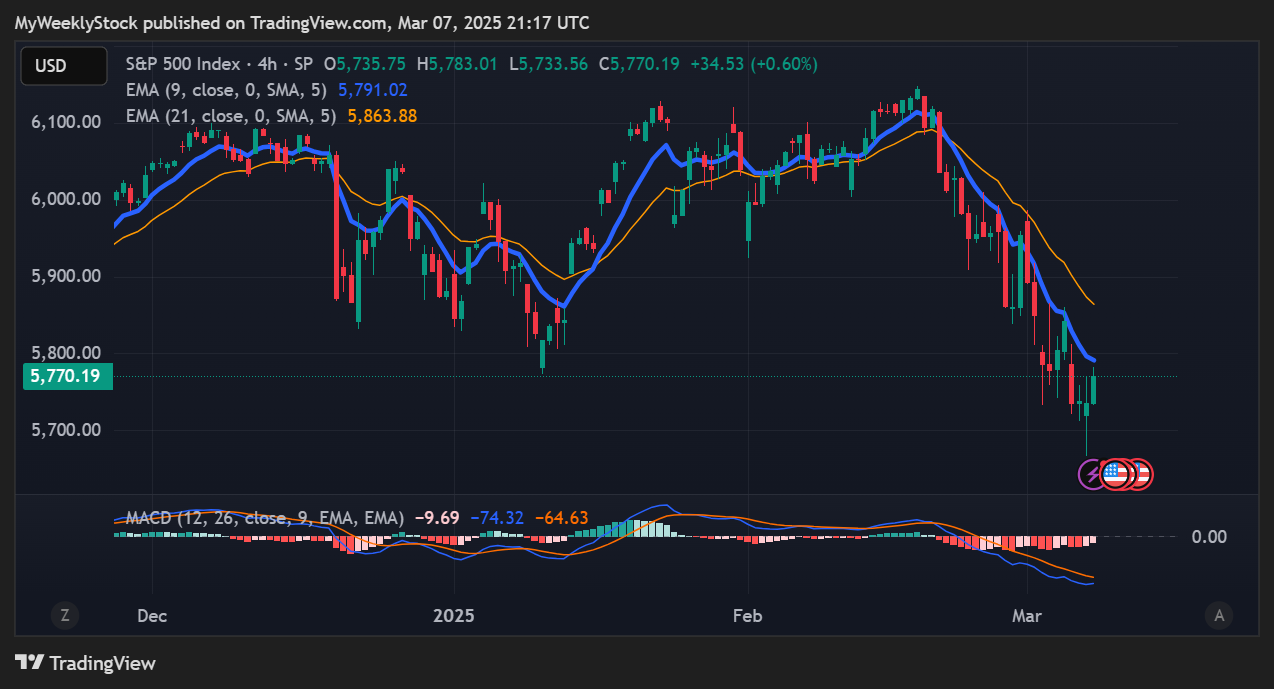
4-hour chart: WEAK
Key levels: identifying critical price zones to confirm the current trend or signal a potential reversal.
Support:
$5,400 (-6.4%)
$5,600 (-2.9%)
$5,670 (-1.7%)
Resistance:
$5,800 (+0.5%)
$5,850 (+1.4%)
$6,000 (+4.0%)
Enjoying the analysis so far? There’s so much more in the paid version, where I cover 70+ stocks and ETFs every month. Subscribe now to learn how I connect strategy to insights and, ultimately, portfolio decisions.
2. Post of the Week
This week's momentum analysis focuses on extended trends in the S&P 500, employing the Relative Strength Index (RSI) to filter stocks. The RSI is a valuable tool for spotting stocks that are potentially "oversold" (RSI below 30). Although I wouldn't rely solely on RSI, it helps identify stocks in extended trends that may be approaching a turning point.
EARNINGS & ECONOMIC REPORTS RECAP
1. Earnings Outlook
Q4 Earnings: S&P 500 earnings are expected to grow by 17%, rising to 21% when excluding the energy sector.
2025 Full-Year Outlook: Earnings are expected to increase by 11%, above the 10-year average growth of 9%.
Analyst Revisions: Over the past month, 43% of all earnings revisions by analysts have been upward adjustments to their outlook.
Valuation: The forward 4-quarter P/E ratio stands at 21.2, above the 5-year and 10-year historical averages.
2. Earnings Season Recap
Out of 491 S&P 500 companies that have reported fourth-quarter earnings, 74% exceeded EPS expectations. It is slightly below with the four-quarter average of 78% but above the historical average of 67%.
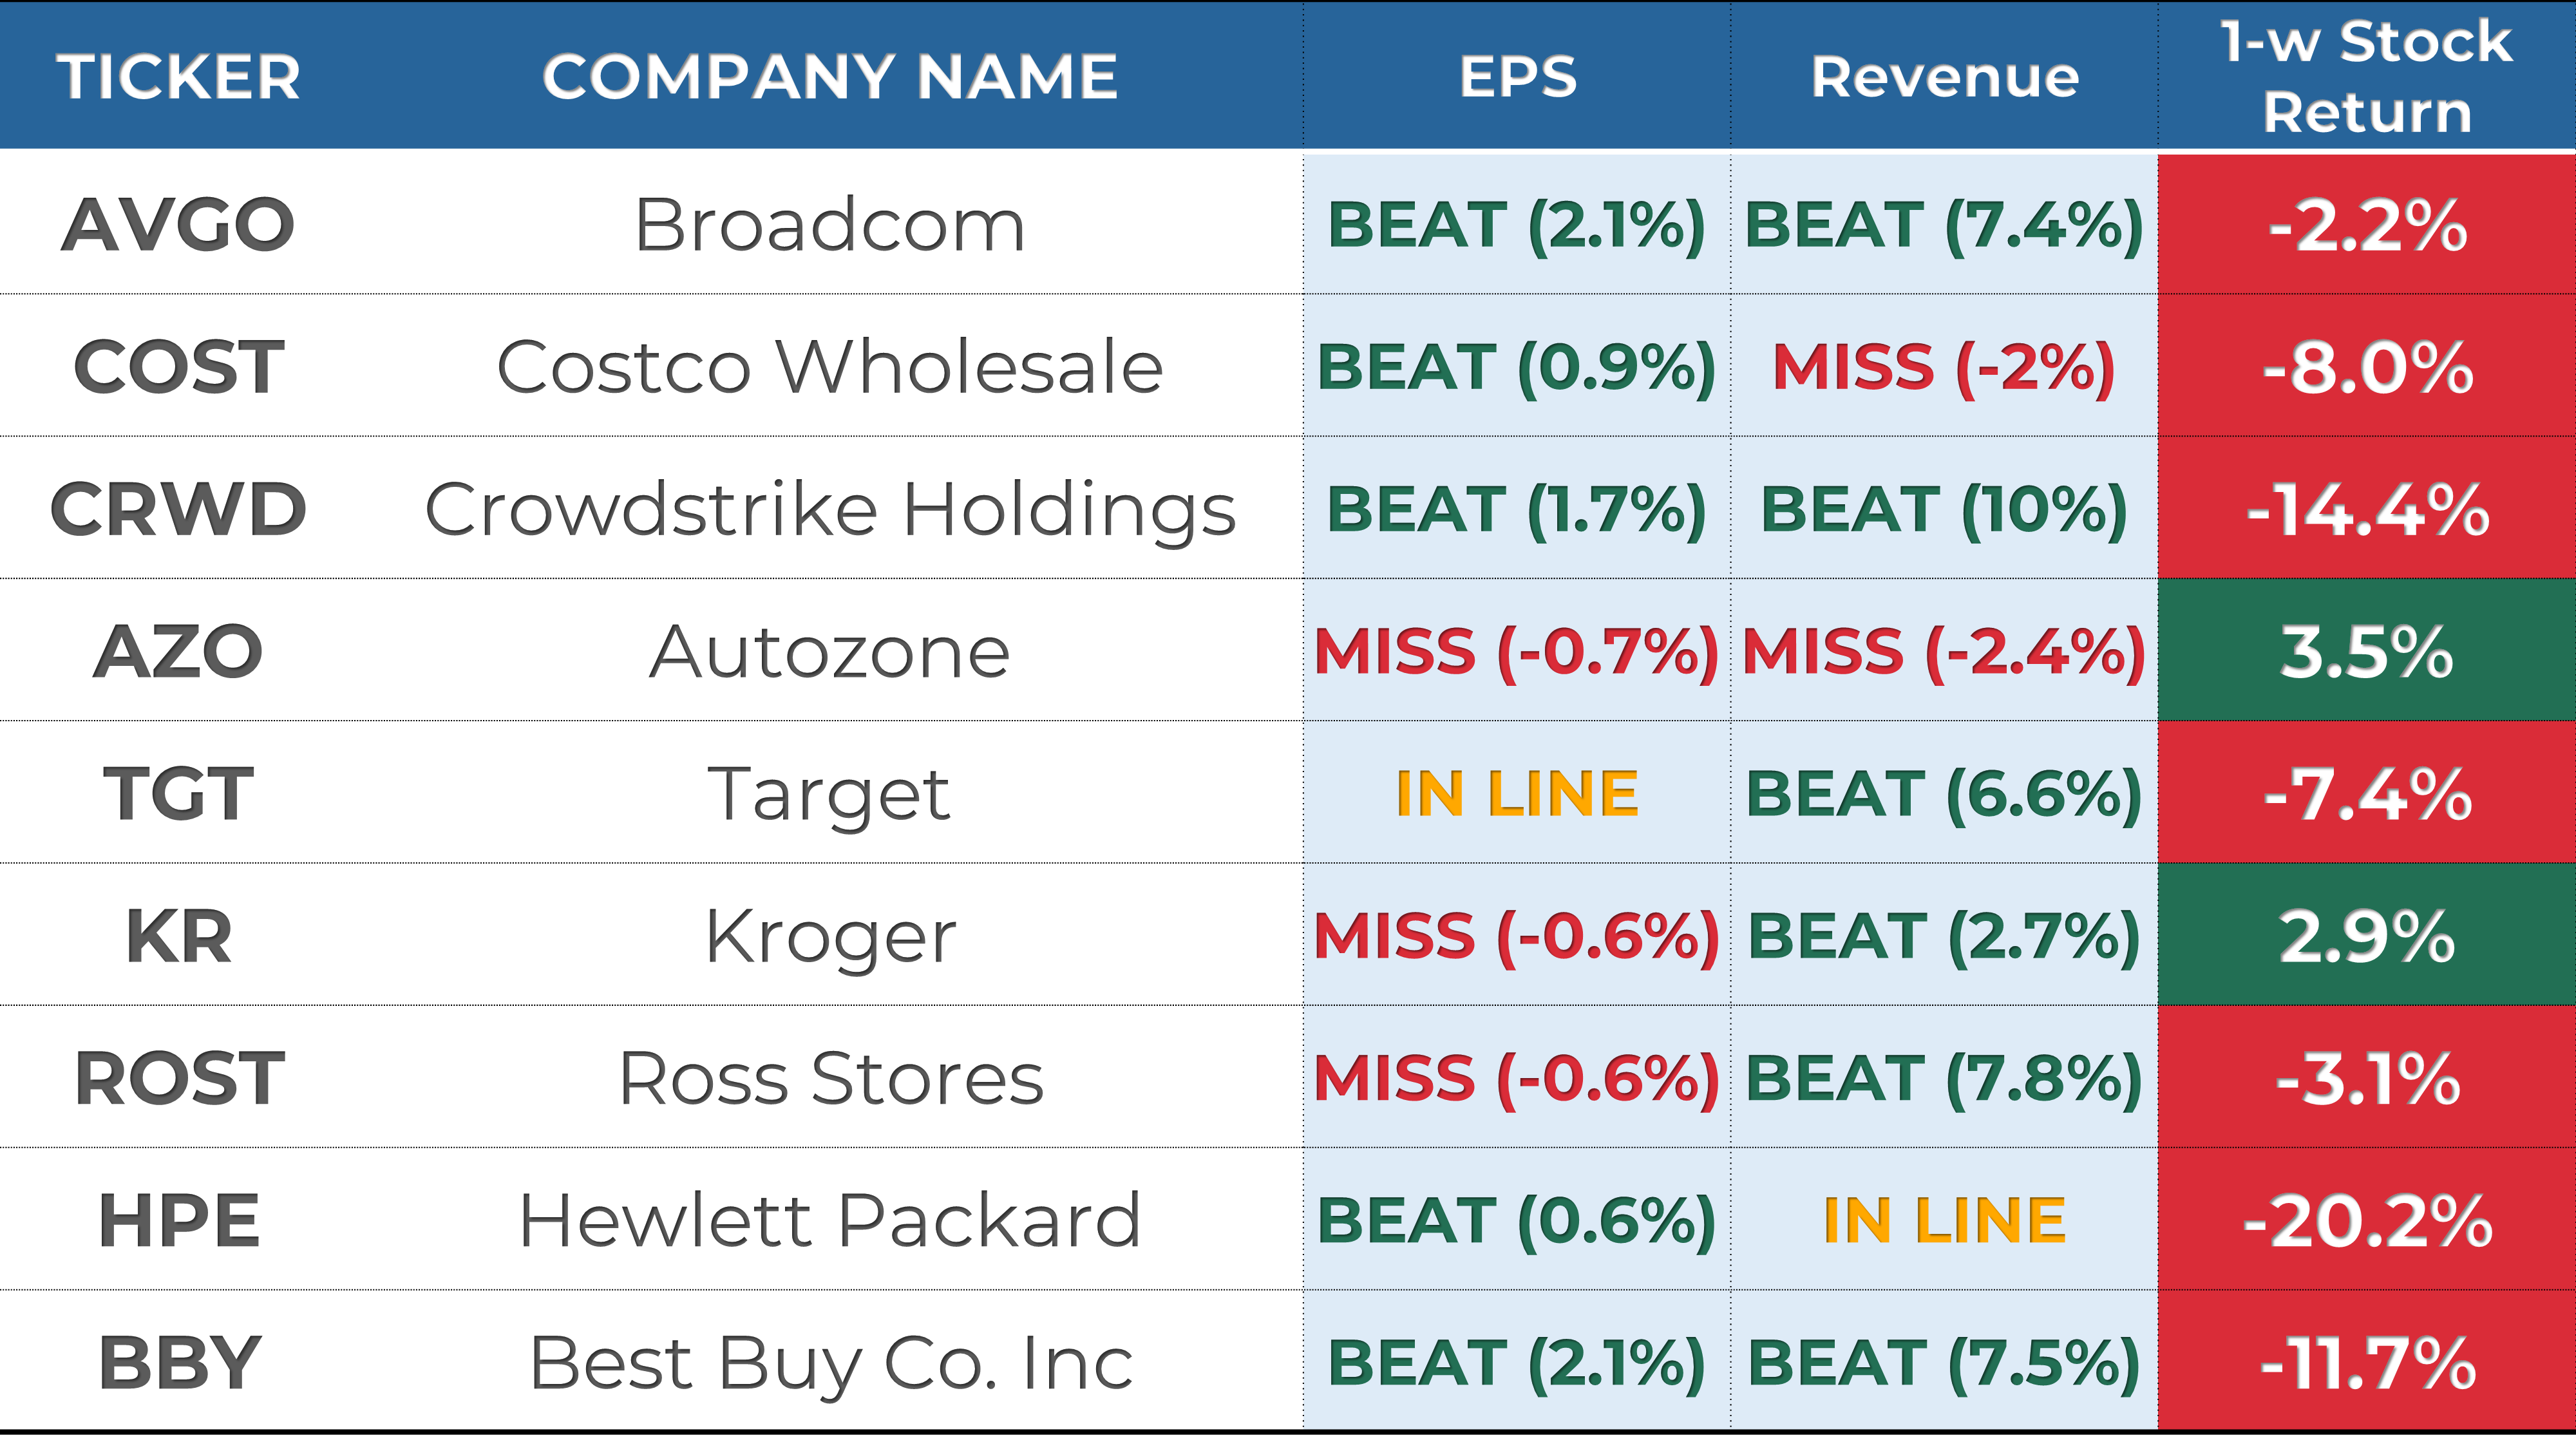
Below are some notable companies that reported earnings last week. I’ve highlighted their EPS and revenue performance vs estimate, as well as their stock return this week.
One highlight of the week was CrowdStrike, which topped Revenues and EPS estimates. However, the stock still lost 14% for the week, for another example of Growth stock beating expectations but still selling off.
3. Economic Reports
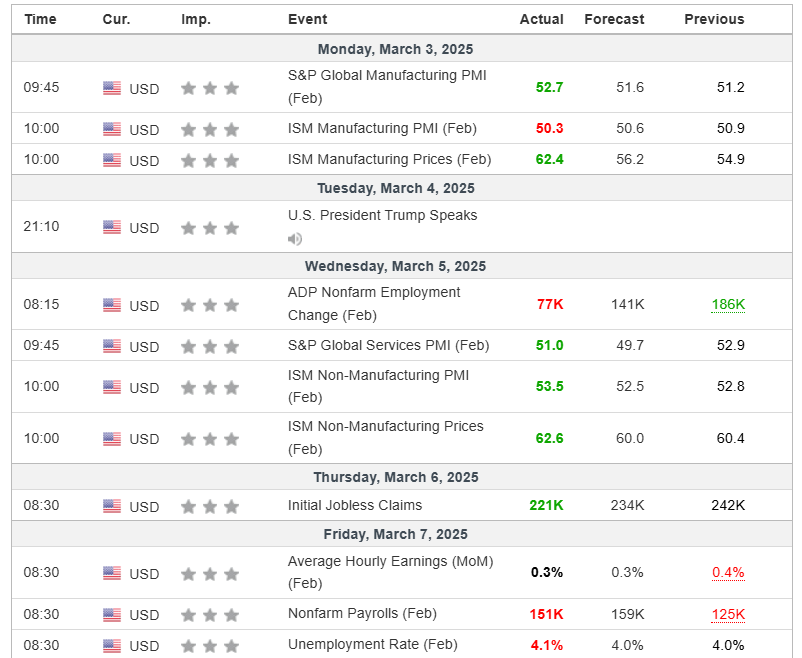
Here are this week’s key economic reports:
Manufacturing & Services Data: Mixed results—ISM Manufacturing PMI disappointed at 50.3 (vs. 50.6 expected), but ISM Services PMI came in stronger at 53.5 (vs. 52.5 expected).
Jobs Report Missed Across the Board:
Nonfarm Payrolls: 151K vs. 159K expected.
Unemployment Rate: 4.1% vs. 4.0% expected.
Average Hourly Earnings: Matched expectations at 0.3% MoM, but slowed from 0.4% prior.
Overall, the labor market is showing signs of cooling.
MARKET SENTIMENT
Measures of investor sentiment can be helpful as they provide insight into the views and opinions of professional or individual investors. While not definitive predictors of market direction, these measures can serve as a valuable complement to other indicators and analysis tools, helping to paint a more comprehensive picture of the market's current state.
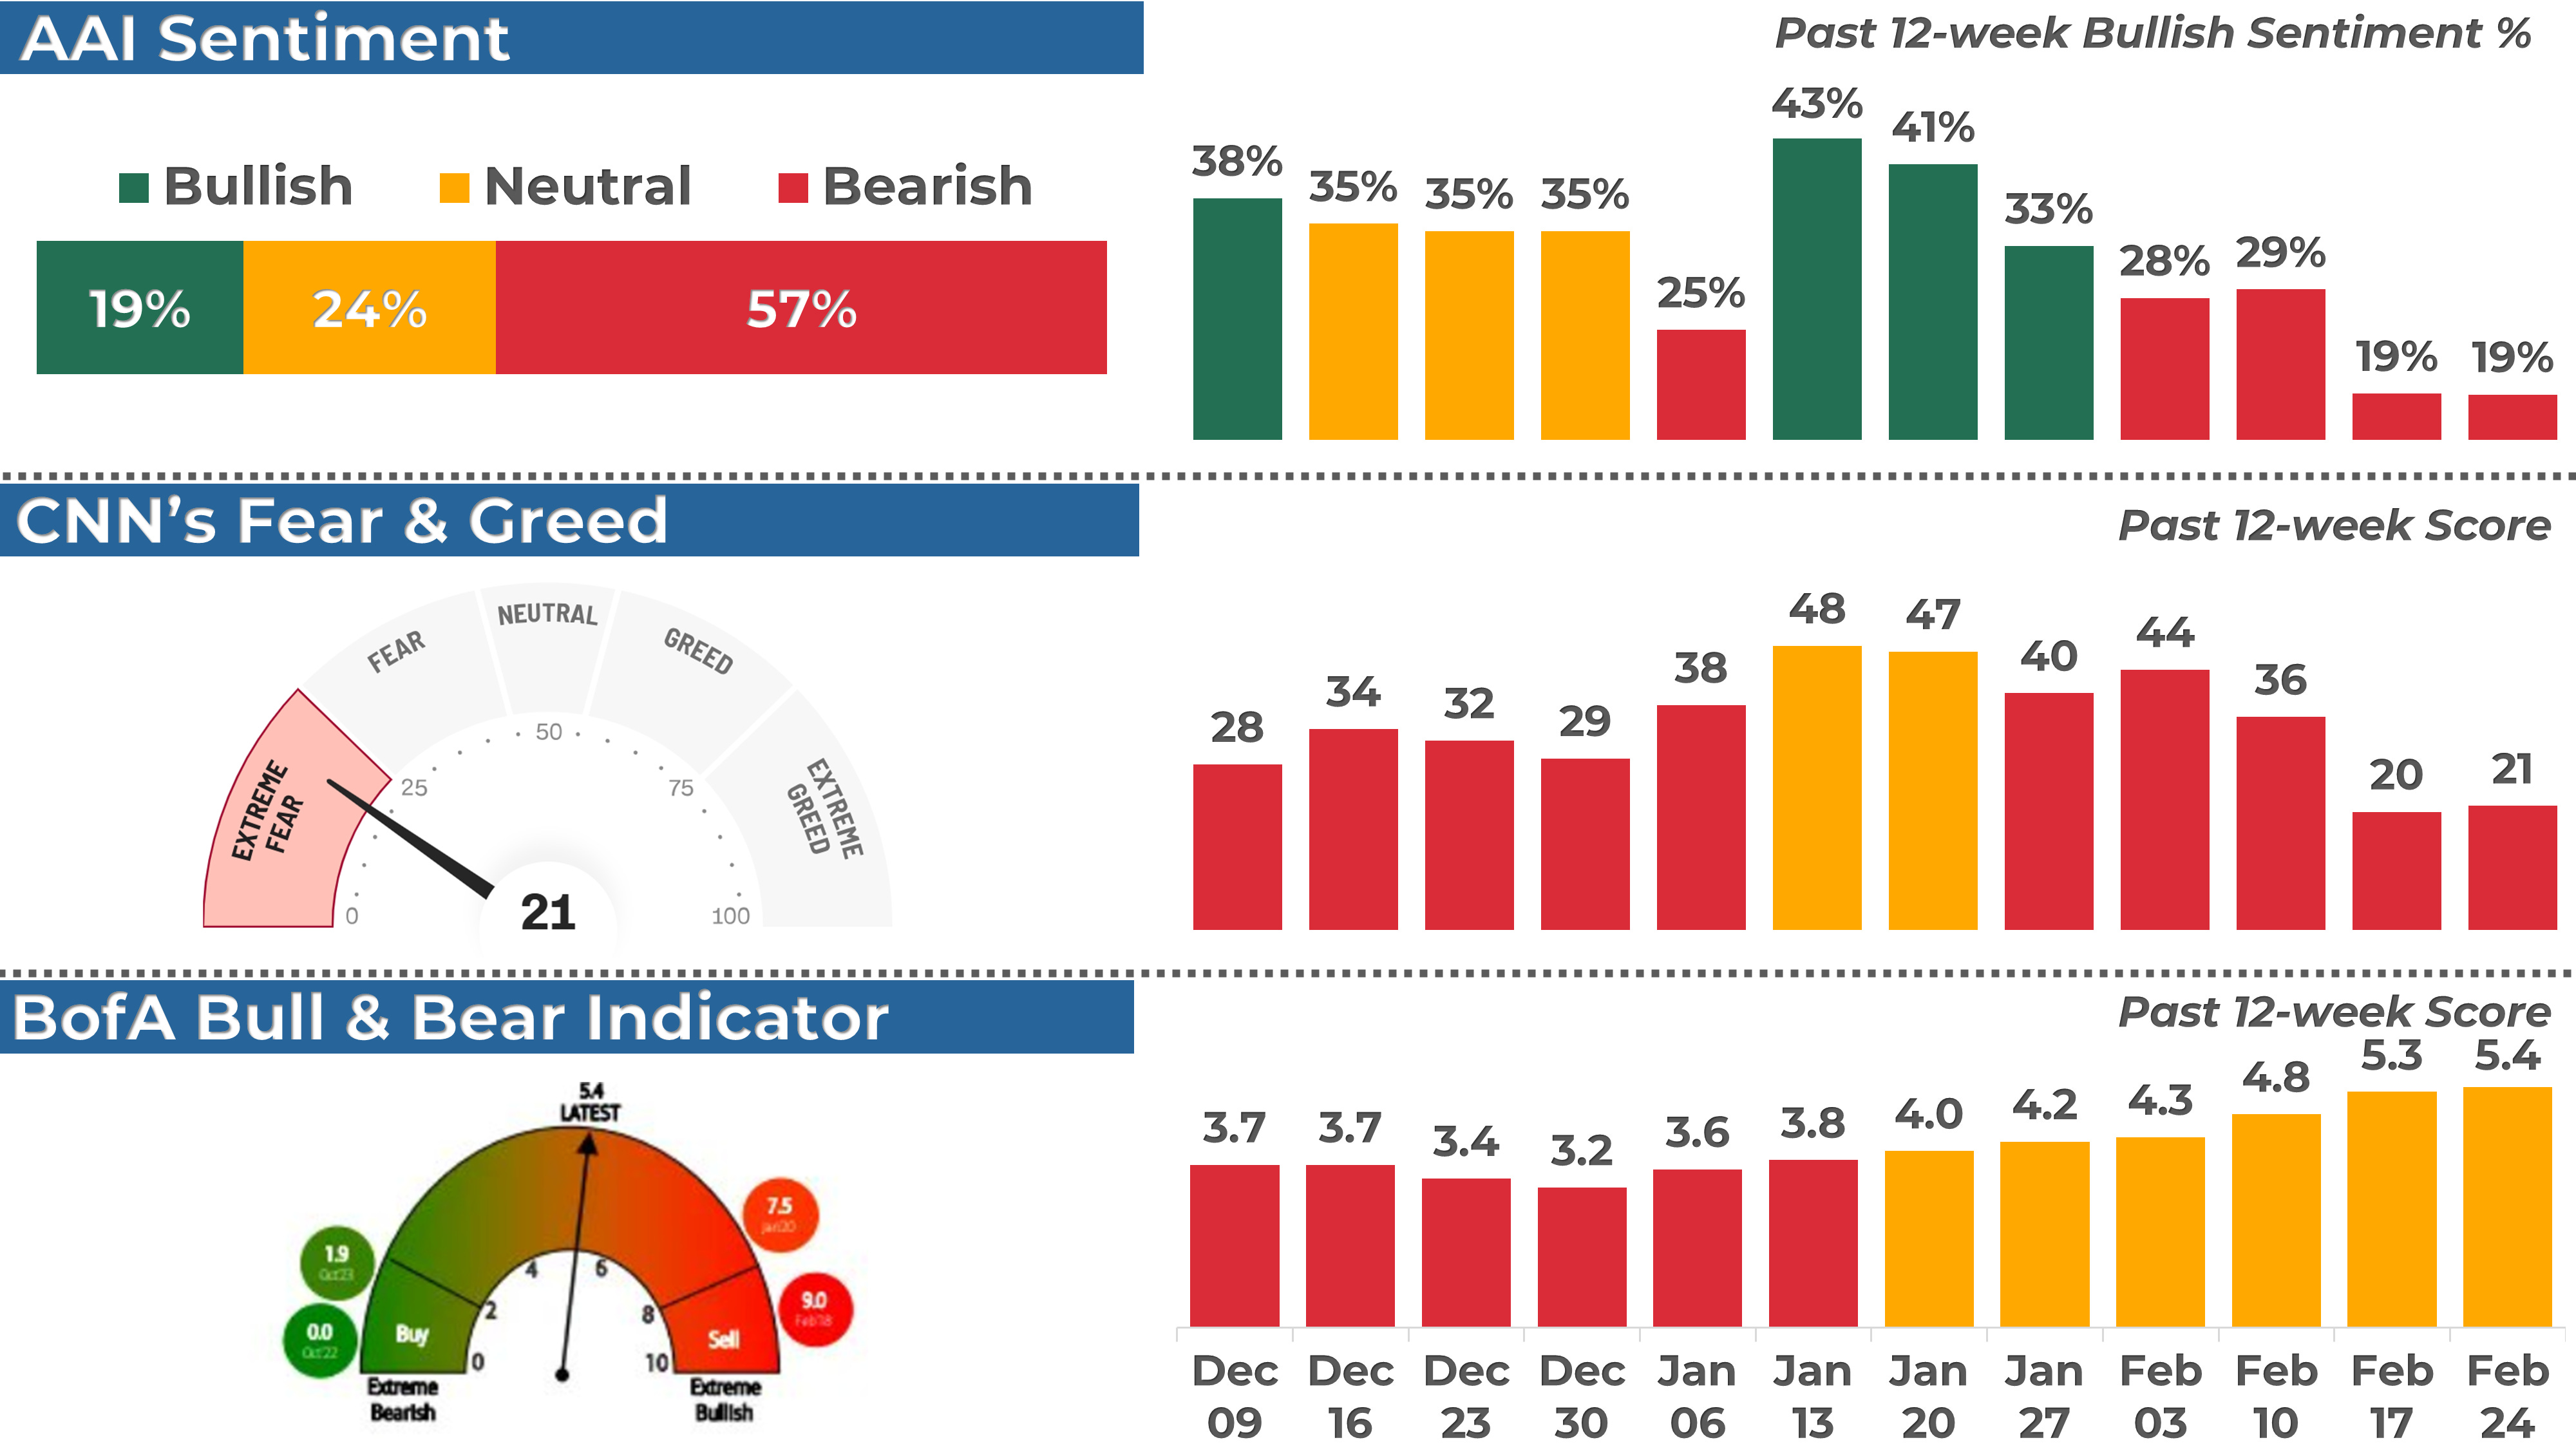
1. AAII Sentiment Survey (Individual Investors)
The American Association of Individual Investors (AAII) conducts a weekly survey to gauge members' expectations for the stock market over the next six months. Results are published every Wednesday.
In the latest survey, 19% of respondents had a bullish outlook, stable from 19% the previous week.
2. BofA Bull & Bear Indicator (Institutional Investors)
The Bank of America Bull-Bear Indicator measures investor sentiment based on fund managers' and institutional investors' views. Scores range from 0 (extremely bearish) to 10 (extremely bullish).
The most recent reading was 5.4, a neutral sentiment.
3. CNN Fear & Greed Index (Technical)
This daily measure analyzes seven indicators to assess how emotions drive market decisions. Scores range from Extreme Fear to Extreme Greed.
The index closed at 21 (Extreme Fear), up from 20 last Friday.
THE WEEK AHEAD
1. Economic Calendar
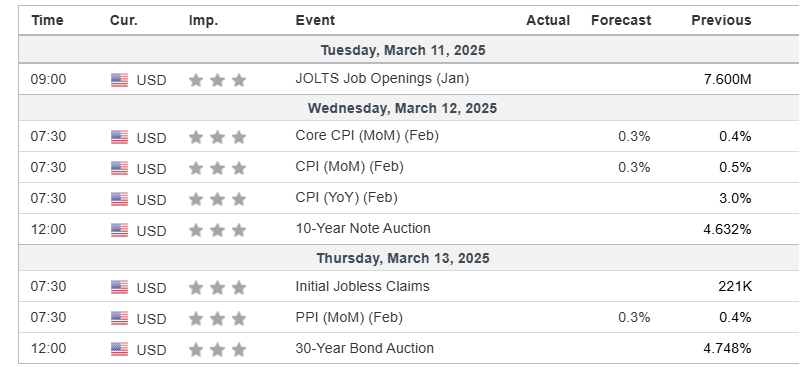
CPI & PPI will be the major focus this week, setting the tone for Fed policy expectations and market direction.
Consumer Prices (CPI) on Wednesday: Expected at 0.3% MoM (3.0% YoY). A hotter-than-expected print could impact Fed rate expectations. Core CPI (excludes food & energy) is forecasted at 0.3% MoM, slightly lower than 0.4% prior.
Producer Prices (PPI) on Thursday: Expected at 0.3% MoM vs. 0.4% prior. This will be key to assessing inflationary pressures at the wholesale level.
2. Earnings Calendar
Earnings season continues next week, and 5 companies from the S&P 500, including Oracle and Adobe, are expected to release their quarterly results.
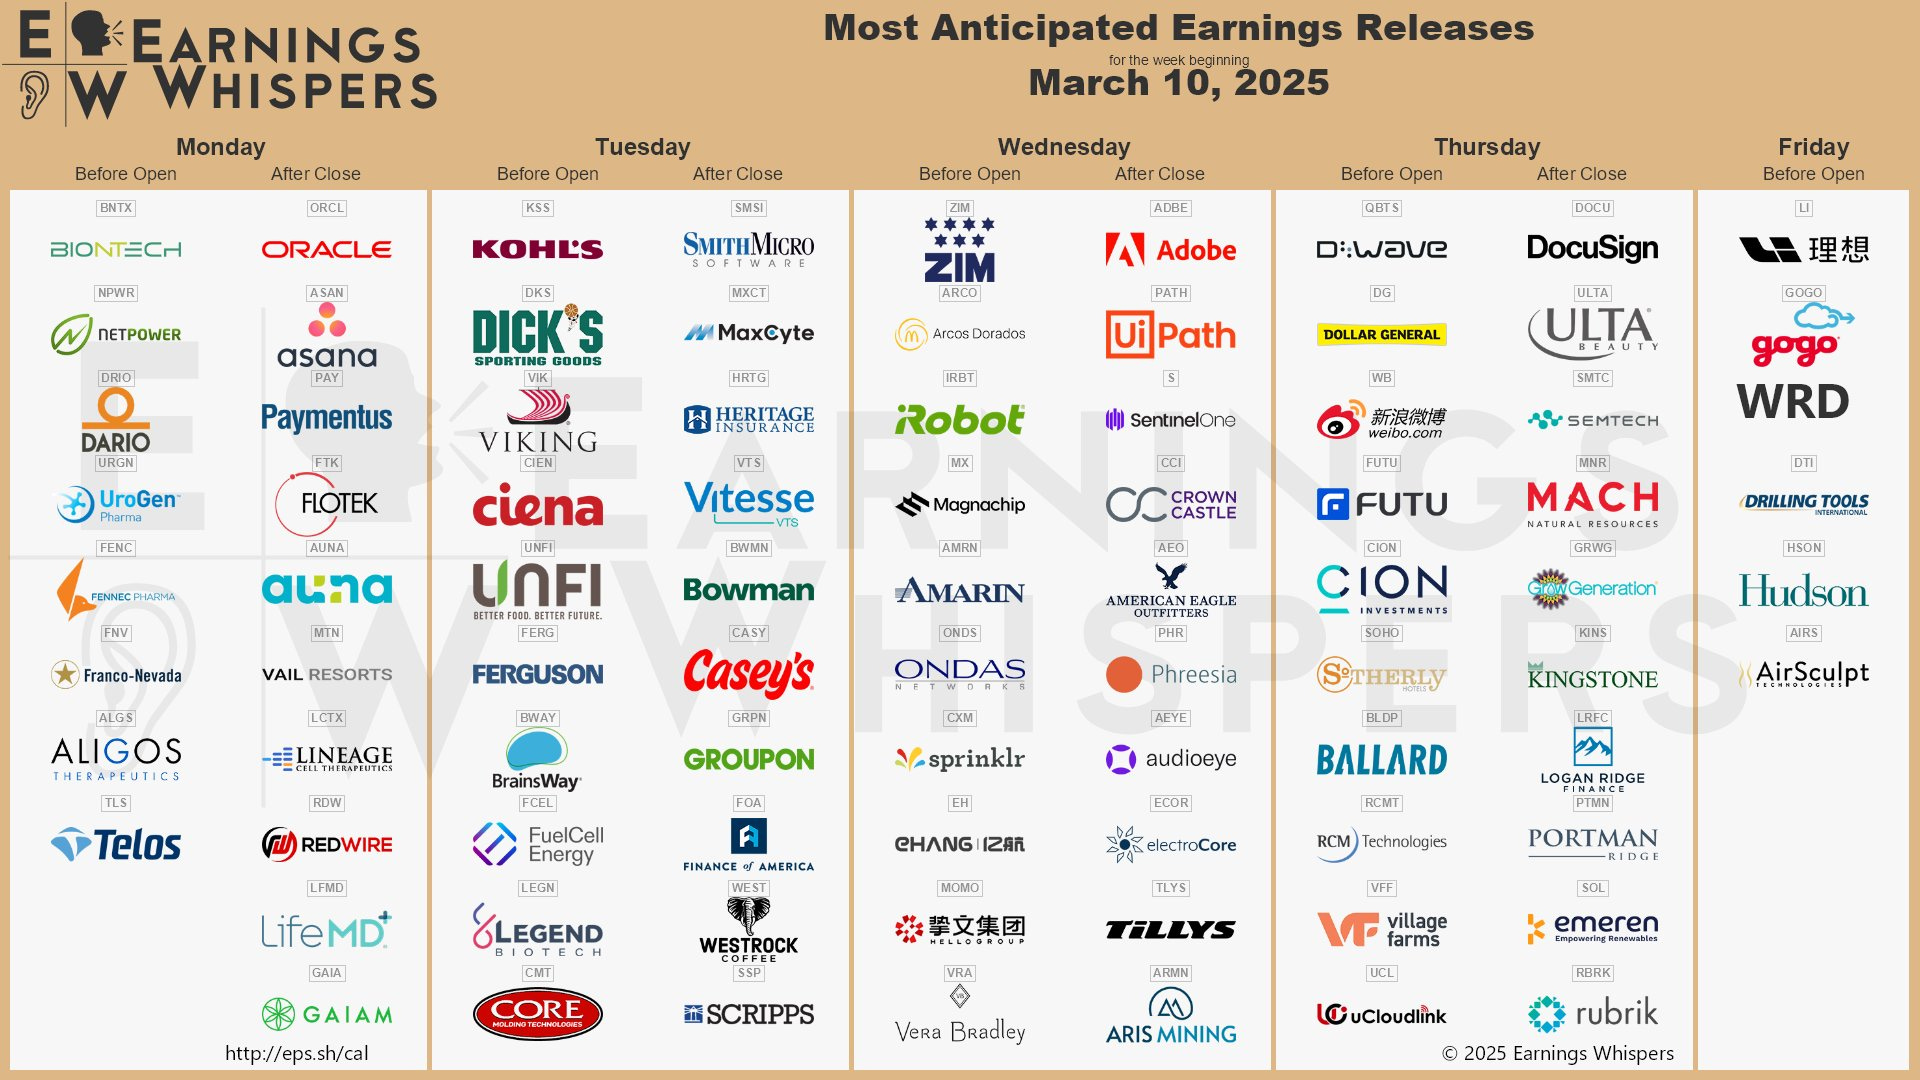
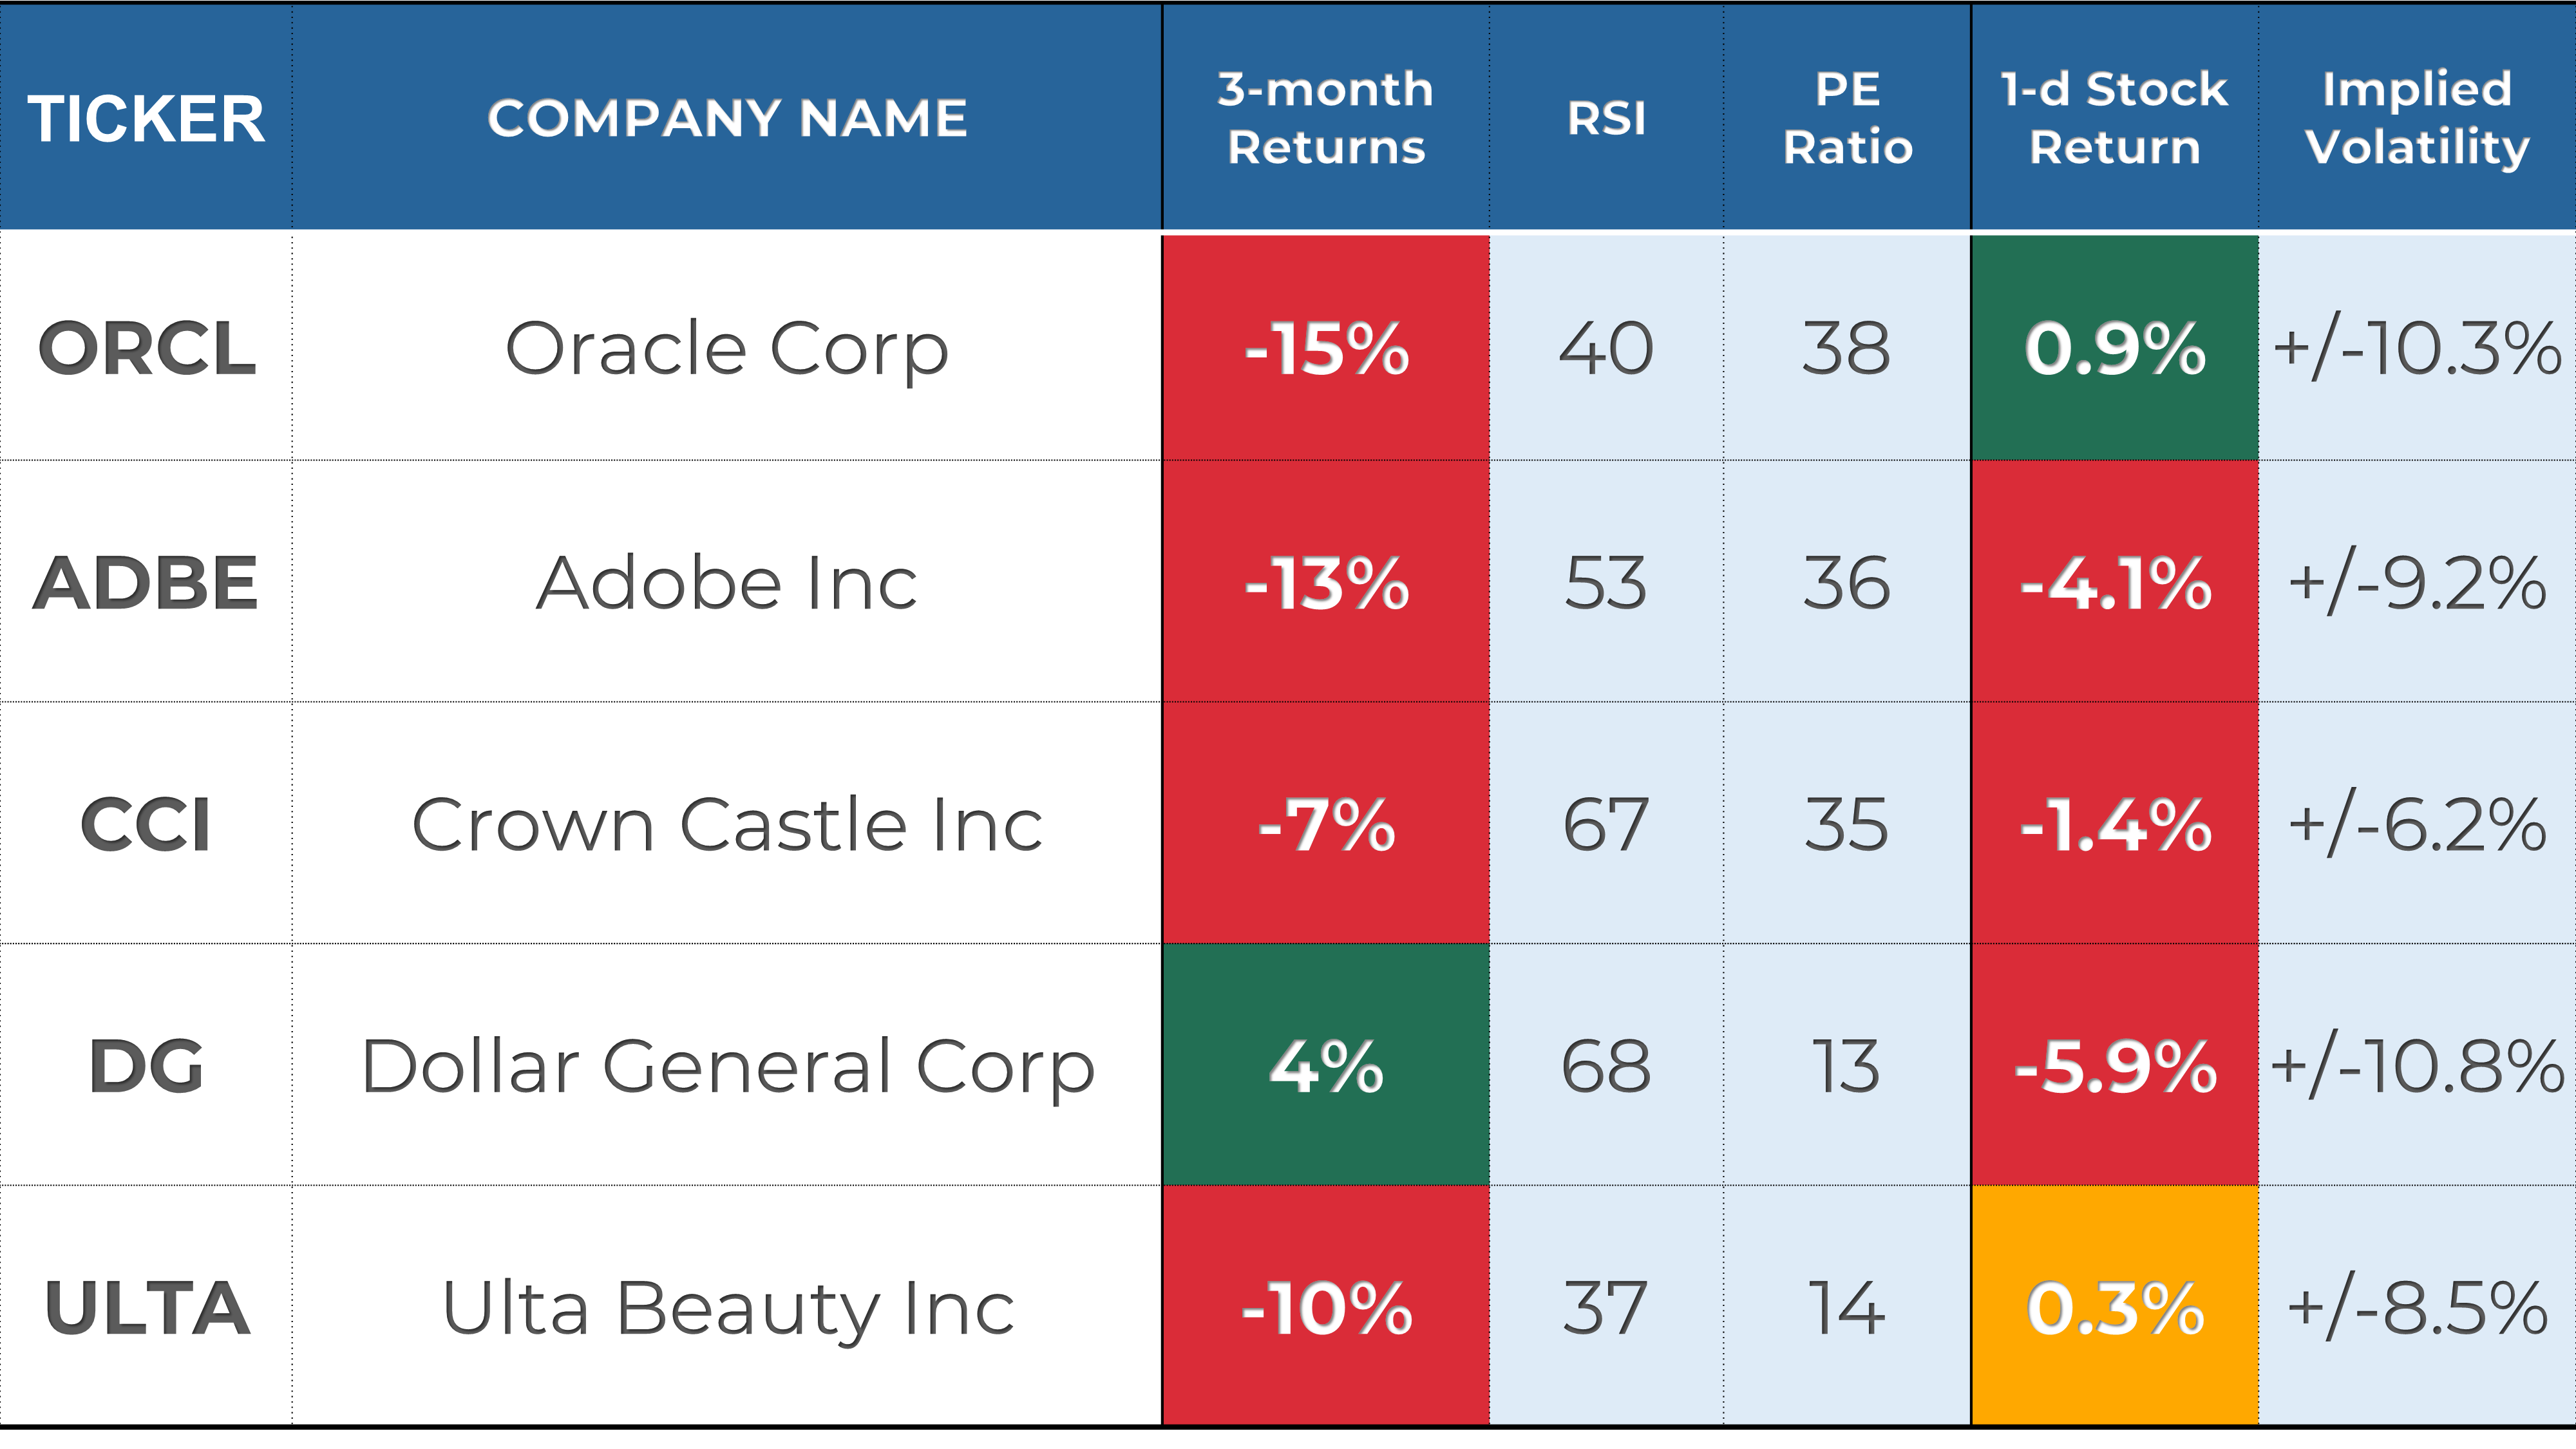
Below are notable stocks reporting earnings next week, along with several key indicators I like to monitor:
Stock Indicators:
3-Month Performance: Assessing recent stock trends.
RSI (Relative Strength Index): A reading above 70 suggests overbought conditions, while below 30 indicates oversold.
P/E Ratio: A value below 25 often points to a "cheap" valuation or low growth expectations.
Stock Price Reactions to Earnings:
1-Day Stock Return on Earnings: How the stock performs on its earnings release day.
Implied Volatility: The options market's forecast for the expected 1-day stock move after earnings.
3. Stock Analysis of the Week
Every week, I share my analysis of 1 stock that has reported earnings in recent weeks, focusing on implications for long-term investors. This week, I prepared an analysis of Target ($TGT).
👨💻 My View: PASS
The stock has been struggling for almost a year, with selling pressure intensifying in recent months. The past two earnings reports triggered massive sell-offs, further accelerating the decline.
The moving average analysis confirms the bearish trend, with the stock trading firmly below the 9- and 30-week EMAs. That said, the low $100s could serve as a key support zone.
However, until a clear reversal signal emerges, the path of least resistance remains lower.
Check out the post for more details about $TGT performance, trend and key levels.
CONCLUSION
Thank you for reading my Weekly Market Recap, which, I hope, got you ready for the week ahead.
If you want to take your investing journey to the next level, consider upgrading to a paid subscription. Subscribe now and learn more about my holistic, end-to-end momentum approach to investing.
Your first month is free, so this is the perfect opportunity to explore the full value of My Weekly Stock at no risk!
Thanks again, and I look forward to sharing my market recap with you next week.
Happy investing!
My Weekly Stock
DISCLAIMER
The information provided in this newsletter is for informational purposes only and should not be taken as financial advice. Any investments or decisions made based on the information provided in this newsletter are the reader's sole responsibility. We recommend that readers conduct their own research and consult a qualified financial professional before making investment decisions. The author does not assume any responsibility for any losses or damages arising from using the information provided in this newsletter.