


Weekly Market Recap (Mar 31-Apr 4): Trump’s Tariffs Send Markets Tumbling – Is the S&P 500 Poised to Enter a Bear Market?
Everything you need to know about last week's markets performance and what to expect next.
Dear readers,
Welcome back to My Weekly Stock, where in-depth market analysis meets proven momentum-based trading strategies. My mission? To help you win in the markets with unbiased, data-driven insights you can act on.
Friday means it's time to review the week in the markets. Each week, I dedicate hours to curating this market recap, preparing insightful analysis with clear visuals and a structured layout—making it easy for you to find exactly what you need, week after week. And because it's easy to get swayed by personal bias, I like to let the data do most of the talking.
If you want the full experience, consider upgrading your subscription. Paid members get access to all my portfolios, real-time trade alerts, in-depth analysis, and a clear momentum-based framework you can follow and learn from.
Start today. Your first month is completely FREE—no commitment, no pressure. Just a chance to explore the full value of My Weekly Stock.
Let's dive in!
SUMMARY
Here are this week's highlights and what to look out for next:
1. The markets were negative this week, with the S&P 500 down -9.1%, the Nasdaq -10%, and the Dow Jones -7.9%. Consumer Defensive (-2.3%) and Utilities (-4.4%) were the best-performing sectors.
2. The S&P 500's long-term trend is negative, and the short-term momentum is weak. 5,280 is the next resistance, while 4,950 is support.
3. The Q4 earnings season is over and all the companies from the S&P 500 index have released their quarterly results, with 74% beating estimates. Earnings are expected to be up 17% in Q4 2024 and 11% in 2025.
4. Market sentiment is at the "Extreme Fear" level (4/100) as measured by CNN’s Fear & Greed indicator, while VIX is at an extremely high value of 45.
5. Earnings reports from banks, the FOMC meeting minutes and the latest inflation data are scheduled for next week.
My take:
I've been increasingly cautious as the weekly charts of major indices have been flashing warning signals for weeks. Yet, I still (wrongly) hoped for a late save from the bulls. Instead, we just experienced the worst weekly loss since the COVID crash.
Many indicators are now deeply bearish—two-thirds of the S&P 500 components are down more than 20% from their recent highs, officially in bear market territory. The Nasdaq has already entered a bear market, and the S&P 500 is likely heading there too. The real question is how long and painful this bearish cycle will be. With earnings season starting, all eyes will be on commentary about tariffs and early signs of their impact.
We can expect to see sharp bounces, maybe starting next week, especially as many indicators are already oversold. But I urge you to be patient and not chase these daily (wild) moves. From my perspective, only reclaiming the 30-week EMA—a critical long-term trend line—will make me feel more confident that the worst is behind us.

PERFORMANCE RECAP
1. S&P 500 Sector Performance
This week, 0 out of the 11 S&P 500 sectors posted gains. Consumer Defensive led the market with a -2.3% decrease, while Energy was the laggard, dropping 14.5%.
Year-to-date, 0 sectors have achieved positive performance. Consumer Defensive is the top-performing sector with a -0.1 % loss, while Technology lags behind, with a 21.5 % loss.

2. S&P 500 Top & Worst Performers
Over the last five trading days, 5% of the stocks in the S&P 500 index rose in value.
Top Performers:
$LW (Lamb Weston Holdings Inc): 9.2%
$DG (Dollar General Corp): 7.6%
$MOH (Molina Healthcare Inc): 7.4%
$ROST (Ross Stores, Inc): 3.9%
$TJX (TJX Companies, Inc): 3.3%
Worst Performers:
$FCX (Freeport-McMoRan Inc): -24.1%
$GEHC (GE HealthCare Technologies Inc): -24.4%
$WDC (Western Digital Corp): -24.8%
$MCHP (Microchip Technology, Inc): -25.6%
$MU (Micron Technology Inc): -26.8%

In addition, 43 stocks within the S&P 500 reached a new 52-week high, while 96 stocks set new lows. The majority of this week’s lows came from the Technology sector.
Notable Highs:
$KO (Coca-Cola Co)
$PM (Philip Morris International Inc)
$T (AT&T, Inc)
$MMC (Marsh & McLennan Cos., Inc)
$CB (Chubb Limited)
Notable Lows:
$MSFT (Microsoft Corporation)
$TMO (Thermo Fisher Scientific Inc)
$ADBE (Adobe Inc)
$QCOM (Qualcomm, Inc)
$AMD (Advanced Micro Devices Inc)

MARKET MOMENTUM
1. Momentum Review
To evaluate the market's current health, I examine 4 key elements: performance, breadth, trends, and key levels. Healthy bull markets typically feature indices setting new highs, broad market participation, and ascending trend lines.
Performance (WEAK 🔴): evaluating recent market performance to gauge the momentum’s strength. Ideally i want to see returns accelerating short-term and index trading less than 5% from its 1-year high
1-month performance: -11.8% 🔴
3-month performance: -13.6% 🔴
vs. 1-year high: -17.6%🔴
Breadth (WEAK 🔴): assessing market participation to understand the health of the trend. Extreme levels (above 80% or below 20%) may indicate overextended trends.
% of stocks above 200-day moving average: 21% (down from 40% last week) 🔴
% of stocks above 20-day moving average: 6% (down from 37% last week) 🔴
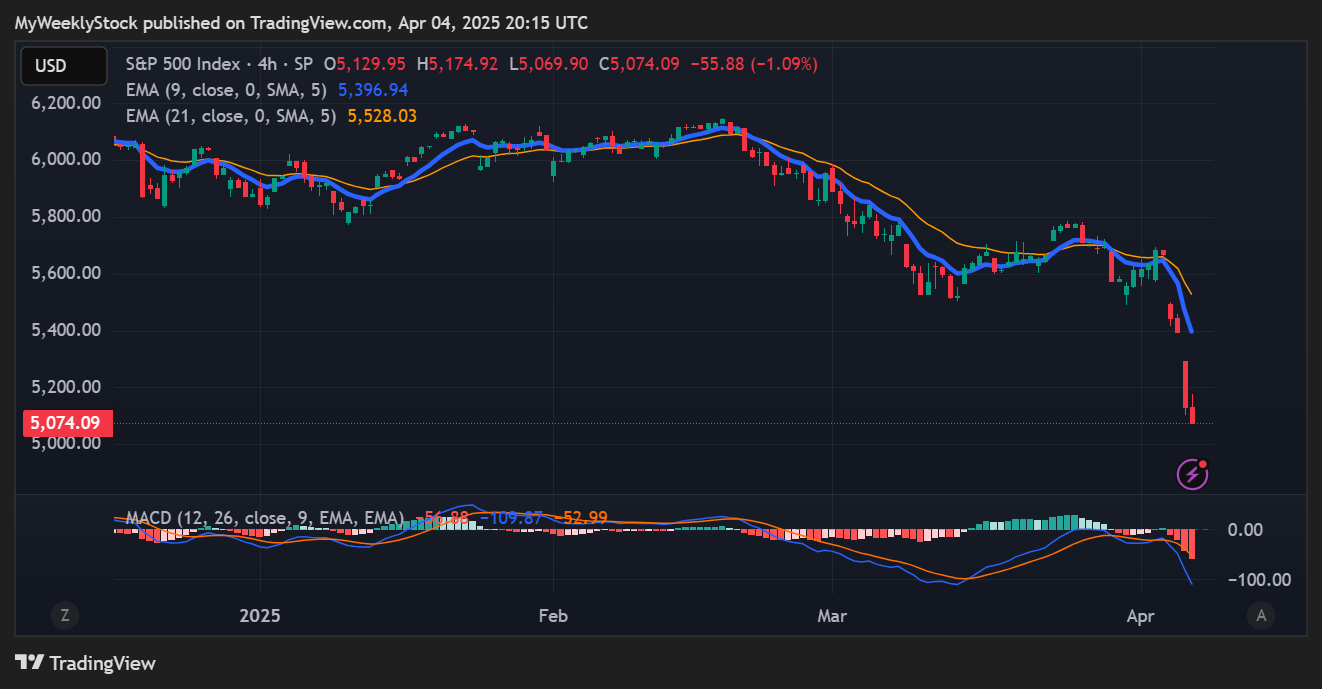
Trends: analyzing trend strength across multiple timeframes using exponential moving averages, scored on a scale of 1 to 5. A score of 3 or above suggests solid trends and supports holding a position.
Weekly chart: WEAK ⭐️ (worst vs last week)

Daily chart: WEAK (worst vs last week)
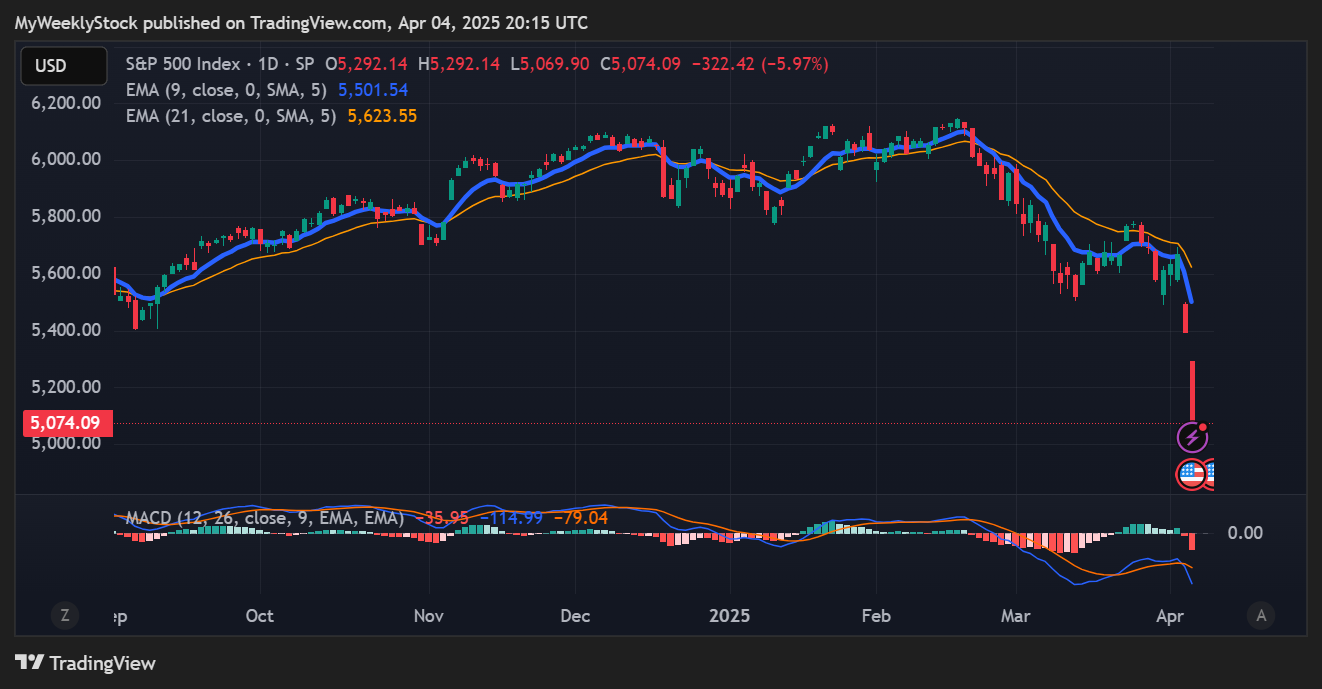
4-hour chart: WEAK (worst vs last week)
Key levels: identifying critical price zones to confirm the current trend or signal a potential reversal.
Support:
$4,690 (-7.6%)
$4,800 (-5.4%)
$4,950 (-2.4%)
Resistance:
$5,280 (+4.1%)
$5,390 (+6.2%)
$5,500 (+8.4%)
Enjoying the analysis so far? There’s so much more in the paid version, where I cover 70+ stocks and ETFs every month. Subscribe now to learn how I connect strategy to insights and, ultimately, portfolio decisions.
2. Post of the Week
This week's momentum analysis is about seasonality, as we just started the month of April. Since 1964, the S&P500 has been up 73% of the time in April, averaging a 1.6% return.
EARNINGS & ECONOMIC REPORTS RECAP
1. Earnings Outlook
Q4 Earnings: S&P 500 earnings are expected to grow by 17%, rising to 21% when excluding the energy sector.
2025 Full-Year Outlook: Earnings are expected to increase by 11%, above the 10-year average growth of 9%.
Analyst Revisions: Over the past month, 38% of all earnings revisions by analysts have been upward adjustments to their outlook.
Valuation: The forward 4-quarter P/E ratio stands at 21.2, above the 5-year and 10-year historical averages.

2. Earnings Season Recap
Out of 500 S&P 500 companies that have reported fourth-quarter earnings, 74% exceeded EPS expectations. It is slightly below with the four-quarter average of 78% but above the historical average of 67%.
3. Economic Reports
Here are this week’s key economic reports:
S&P Global Manufacturing PMI (March): Actual of 50.2 (better than forecast of 49.8, but lower than previous 52.7)
ISM Manufacturing PMI (March): Actual of 49.0 (below forecast of 49.5 and previous 50.3). Below 50, indicating contraction in the manufacturing sector.
S&P Global Services PMI (March): Actual of 54.4 (above forecast of 54.3 and previous 51.0)
ISM Non-Manufacturing PMI (March):Actual of 50.8 (below forecast of 53.0 and previous 53.5), a clear slowdown compared to the previous month.
Nonfarm Payrolls (March): Actual of 228K (much better than forecast of 137K and previous 117K)
Strong nonfarm payrolls and services PMI contrast with weak manufacturing PMI, indicating a mixed economic recovery with persistent inflation pressures

MARKET SENTIMENT
Measures of investor sentiment can be helpful as they provide insight into the views and opinions of professional or individual investors. While not definitive predictors of market direction, these measures can serve as a valuable complement to other indicators and analysis tools, helping to paint a more comprehensive picture of the market's current state.
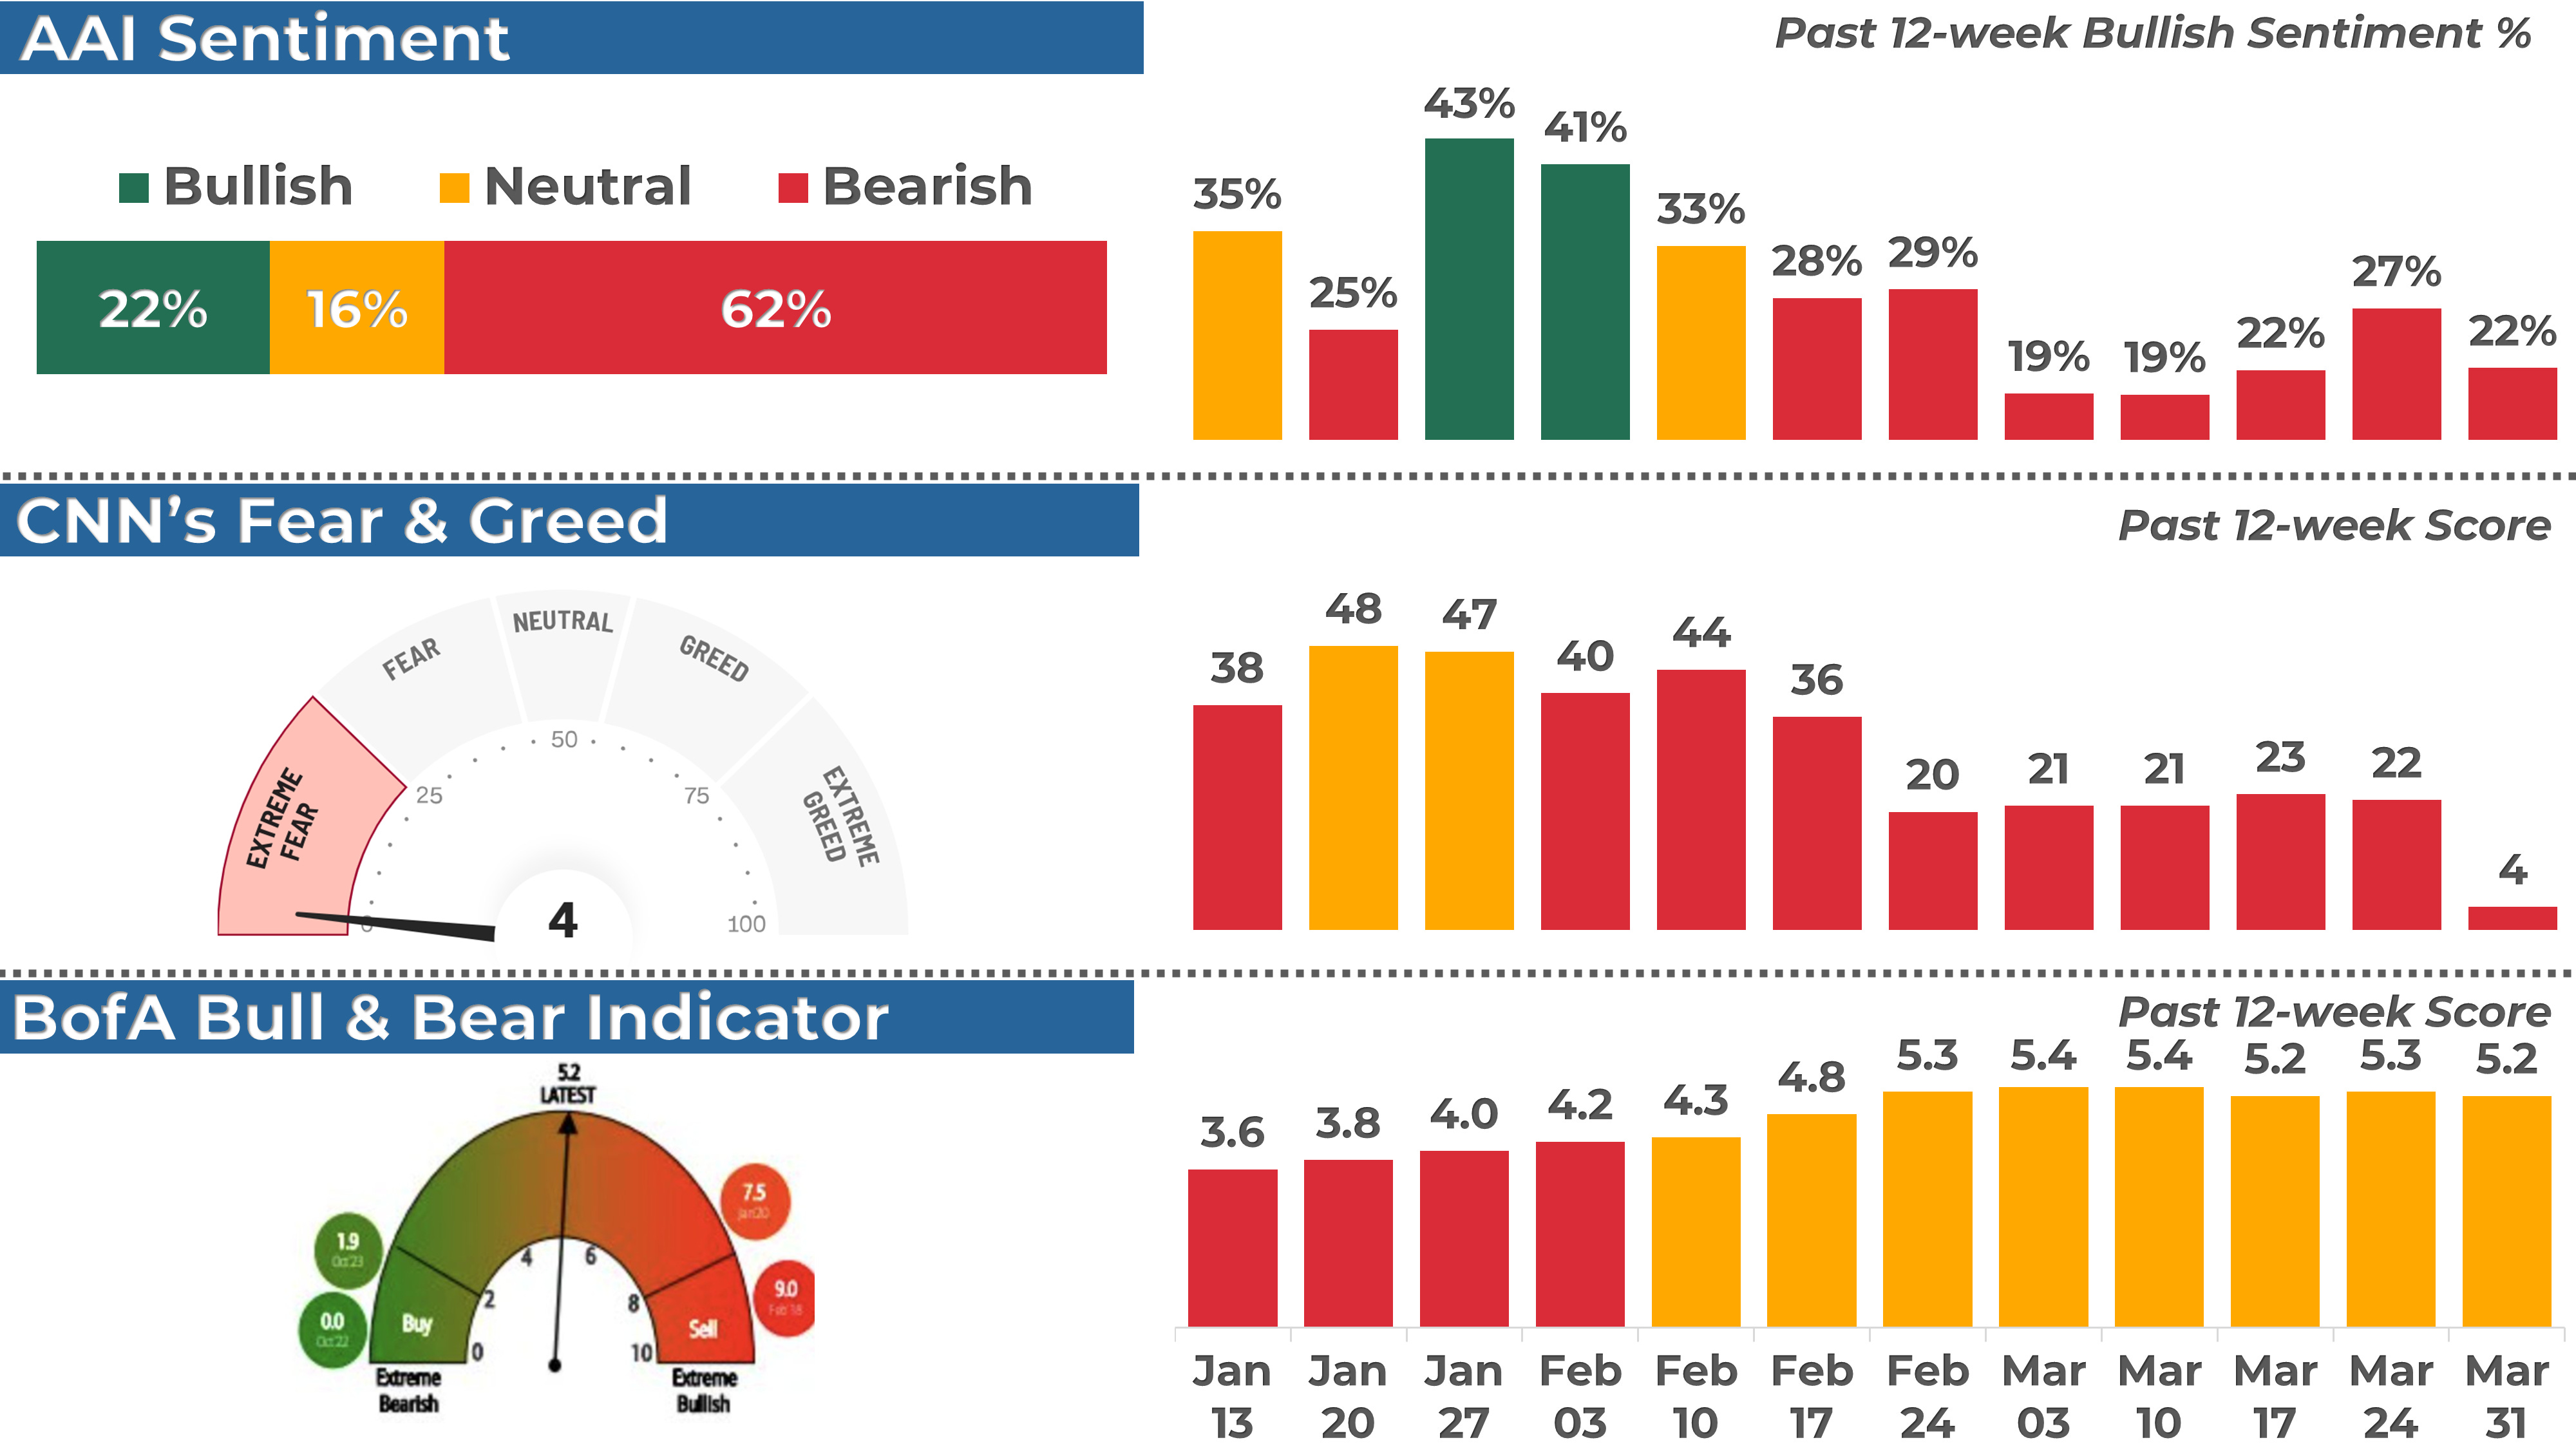
1. AAII Sentiment Survey (Individual Investors)
The American Association of Individual Investors (AAII) conducts a weekly survey to gauge members' expectations for the stock market over the next six months. Results are published every Wednesday.
In the latest survey, 22% of respondents had a bullish outlook, down from 27% the previous week.
2. BofA Bull & Bear Indicator (Institutional Investors)
The Bank of America Bull-Bear Indicator measures investor sentiment based on fund managers' and institutional investors' views. Scores range from 0 (extremely bearish) to 10 (extremely bullish).
The most recent reading was 5.2, a neutral sentiment.
3. CNN Fear & Greed Index (Technical)
This daily measure analyzes seven indicators to assess how emotions drive market decisions. Scores range from Extreme Fear to Extreme Greed.
The index closed at 4 (Extreme Fear), down from 22 last Friday.
THE WEEK AHEAD
1. Economic Calendar
Here are the key reports for the upcoming week:
FOMC Meeting Minutes (Wed): This will provide insights into the Federal Reserve's monetary policy outlook.
CPI for March (Thu): last month reading was at 2.8% year-over-year and any significant deviation from the trend could impact market sentiment.
PPI for March (Fri): another important inflation reading, from producer standpoint.

2. Earnings Calendar
Earnings season starts next week, and 10 companies from the S&P 500, including JP Morgan and Wells Fargo, are expected to release their quarterly results.
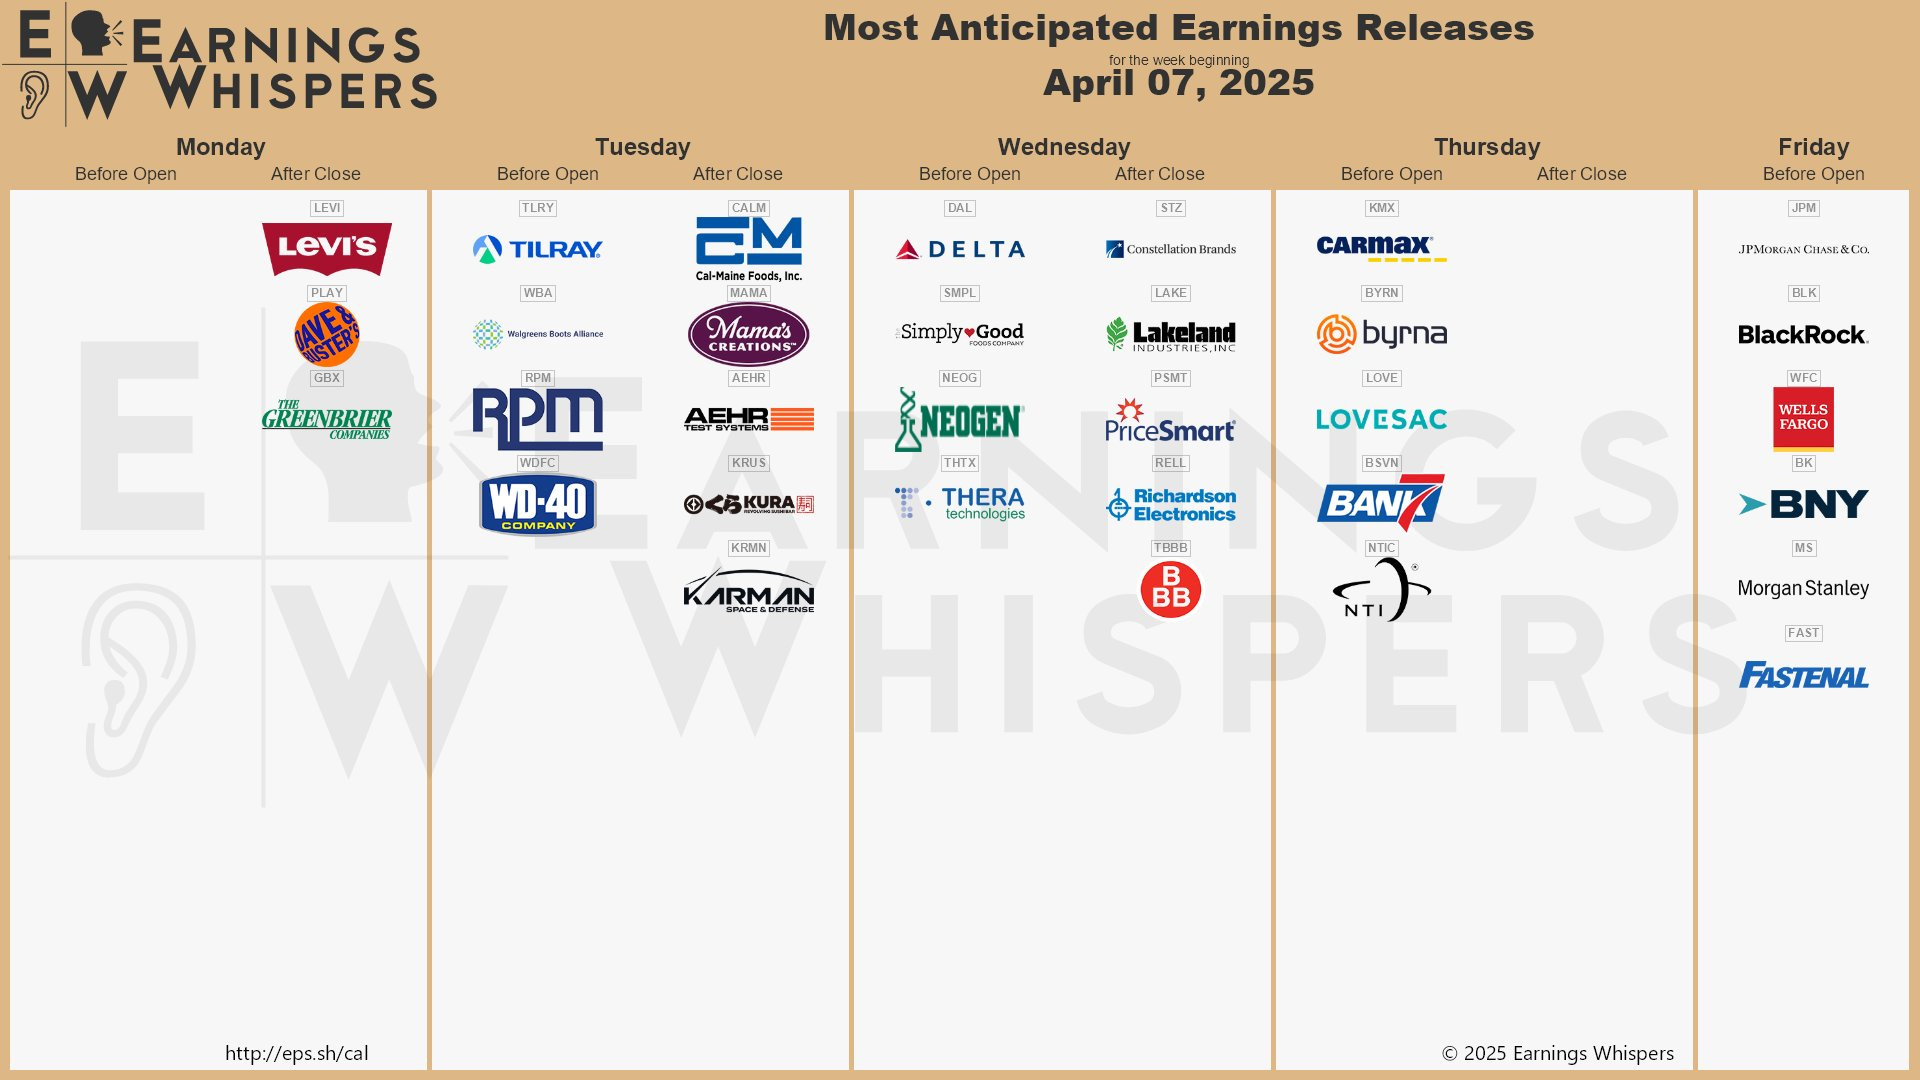
Below are notable stocks reporting earnings next week, along with several key indicators I like to monitor:
Stock Indicators:
3-Month Performance: Assessing recent stock trends.
RSI (Relative Strength Index): A reading above 70 suggests overbought conditions, while below 30 indicates oversold.
P/E Ratio: A value below 25 often points to a "cheap" valuation or low growth expectations.
Stock Price Reactions to Earnings:
1-Day Stock Return on Earnings: How the stock performs on its earnings release day.
Implied Volatility: The options market's forecast for the expected 1-day stock move after earnings.

3. Stock Analysis of the Week
Every week, I share my analysis of 1 stock that has reported earnings in recent weeks, focusing on implications for long-term investors. This week, I prepared an analysis of Lululemon ($LULU).
👨💻 My View: PASS
Frustrating action for Lululemon ($LULU) as we had a steady climb since August that pushed us back above $400 before a relentless sell-off over the past month or so.
We're trading well below the 30-week EMA, my go-to long-term trend line. This signals that the trend has taken a decisively negative turn.
The August low, just below, could act as a decent support zone. But given the damage of the past few weeks, we'll likely need to be patient before we see any signs of a sustainable uptrend.
Check out the post for more details about $LULU performance, trend and key levels.
CONCLUSION
Thank you for reading my Weekly Market Recap, which, I hope, got you ready for the week ahead.
If you want to take your investing journey to the next level, consider upgrading to a paid subscription. Subscribe now and learn more about my holistic, end-to-end momentum approach to investing.
Your first month is free, so this is the perfect opportunity to explore the full value of My Weekly Stock with no commitment!
Thanks again, and I look forward to sharing my market recap with you next week.
Happy investing!
My Weekly Stock
DISCLAIMER
The information provided in this newsletter is for informational purposes only and should not be taken as financial advice. Any investments or decisions made based on the information provided in this newsletter are the reader's sole responsibility. We recommend that readers conduct their own research and consult a qualified financial professional before making investment decisions. The author does not assume any responsibility for any losses or damages arising from using the information provided in this newsletter.