

Weekly Market Recap (Mar. 6 - 10)
Weekly Market Recap (Mar. 6 - 10)
Everything you need to know about last week's markets performance and what to expect next

Dear subscribers,
Welcome to our weekly market recap!
Navigating the markets can be overwhelming, but I'm here to provide you with the latest updates and actionable insights to help you succeed. Whether you're an experienced investor or just starting out, my recap has something for everyone.
I hope you enjoy this week's edition and find it helpful. If you like what you see, please share it with your network on social media and, if you haven't already, subscribe to our email updates.
Thank you for joining us, and let's get started!
SUMMARY
Here are this week's highlights and what to look out for next:
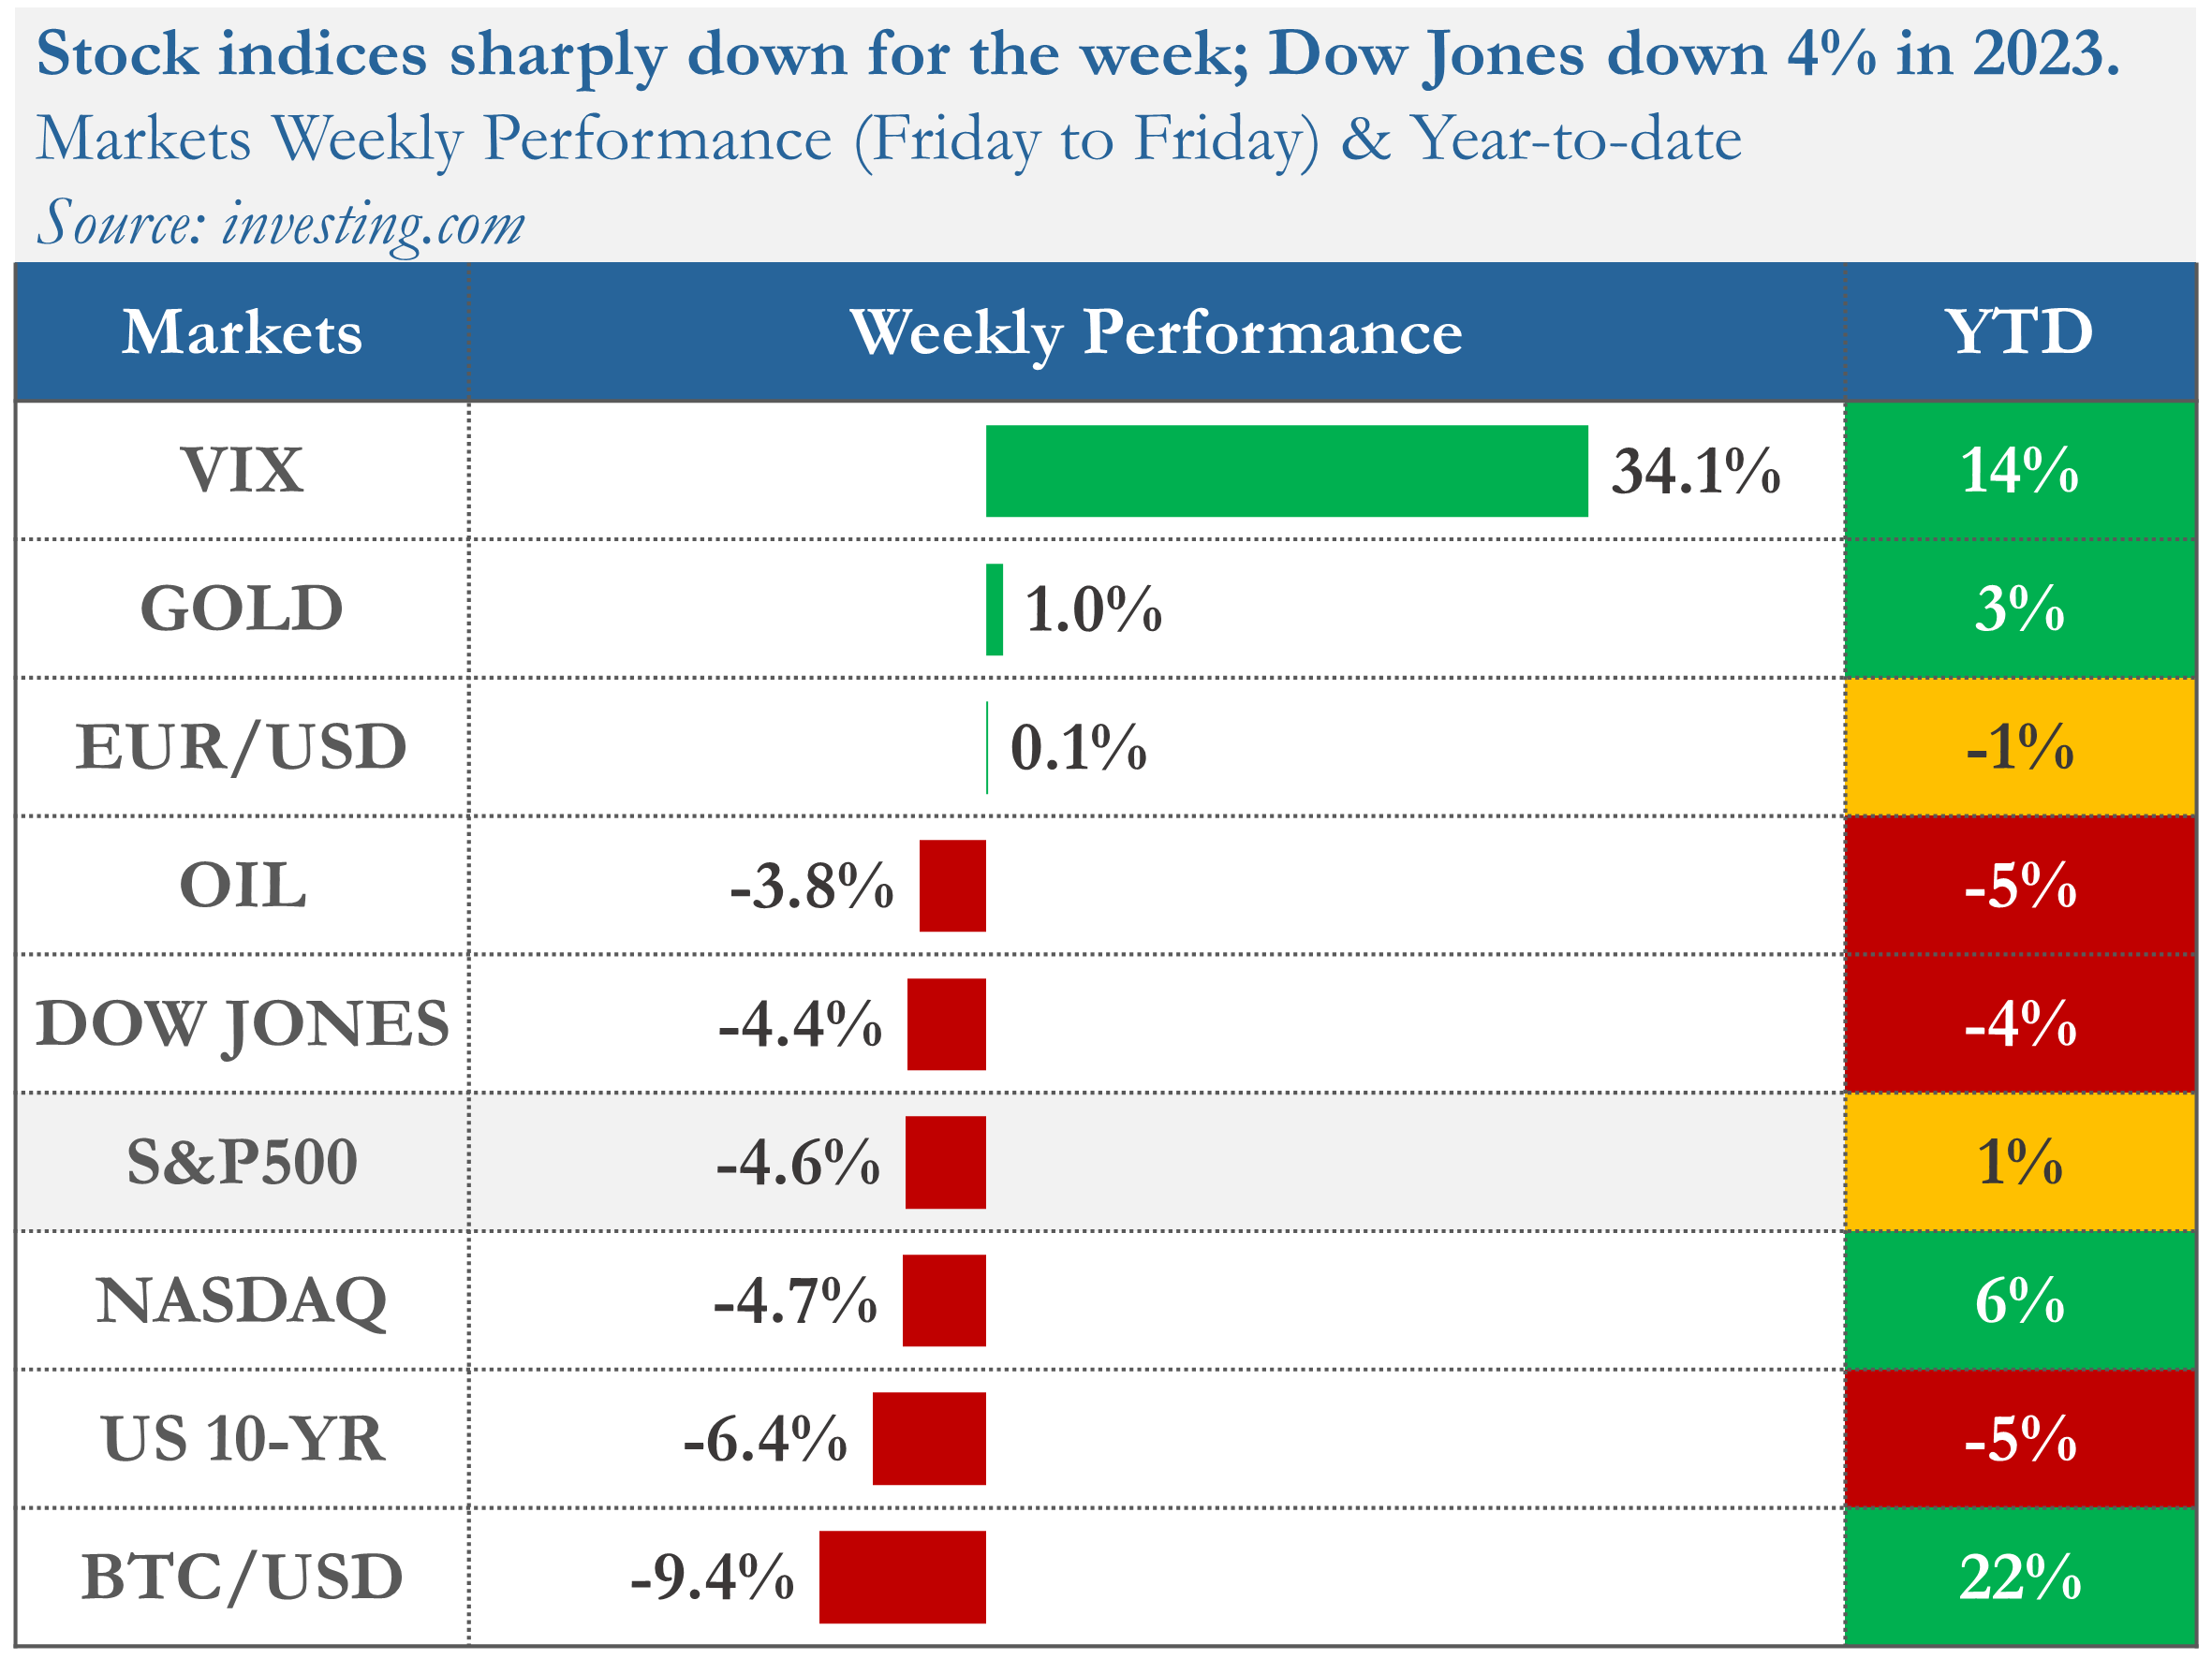
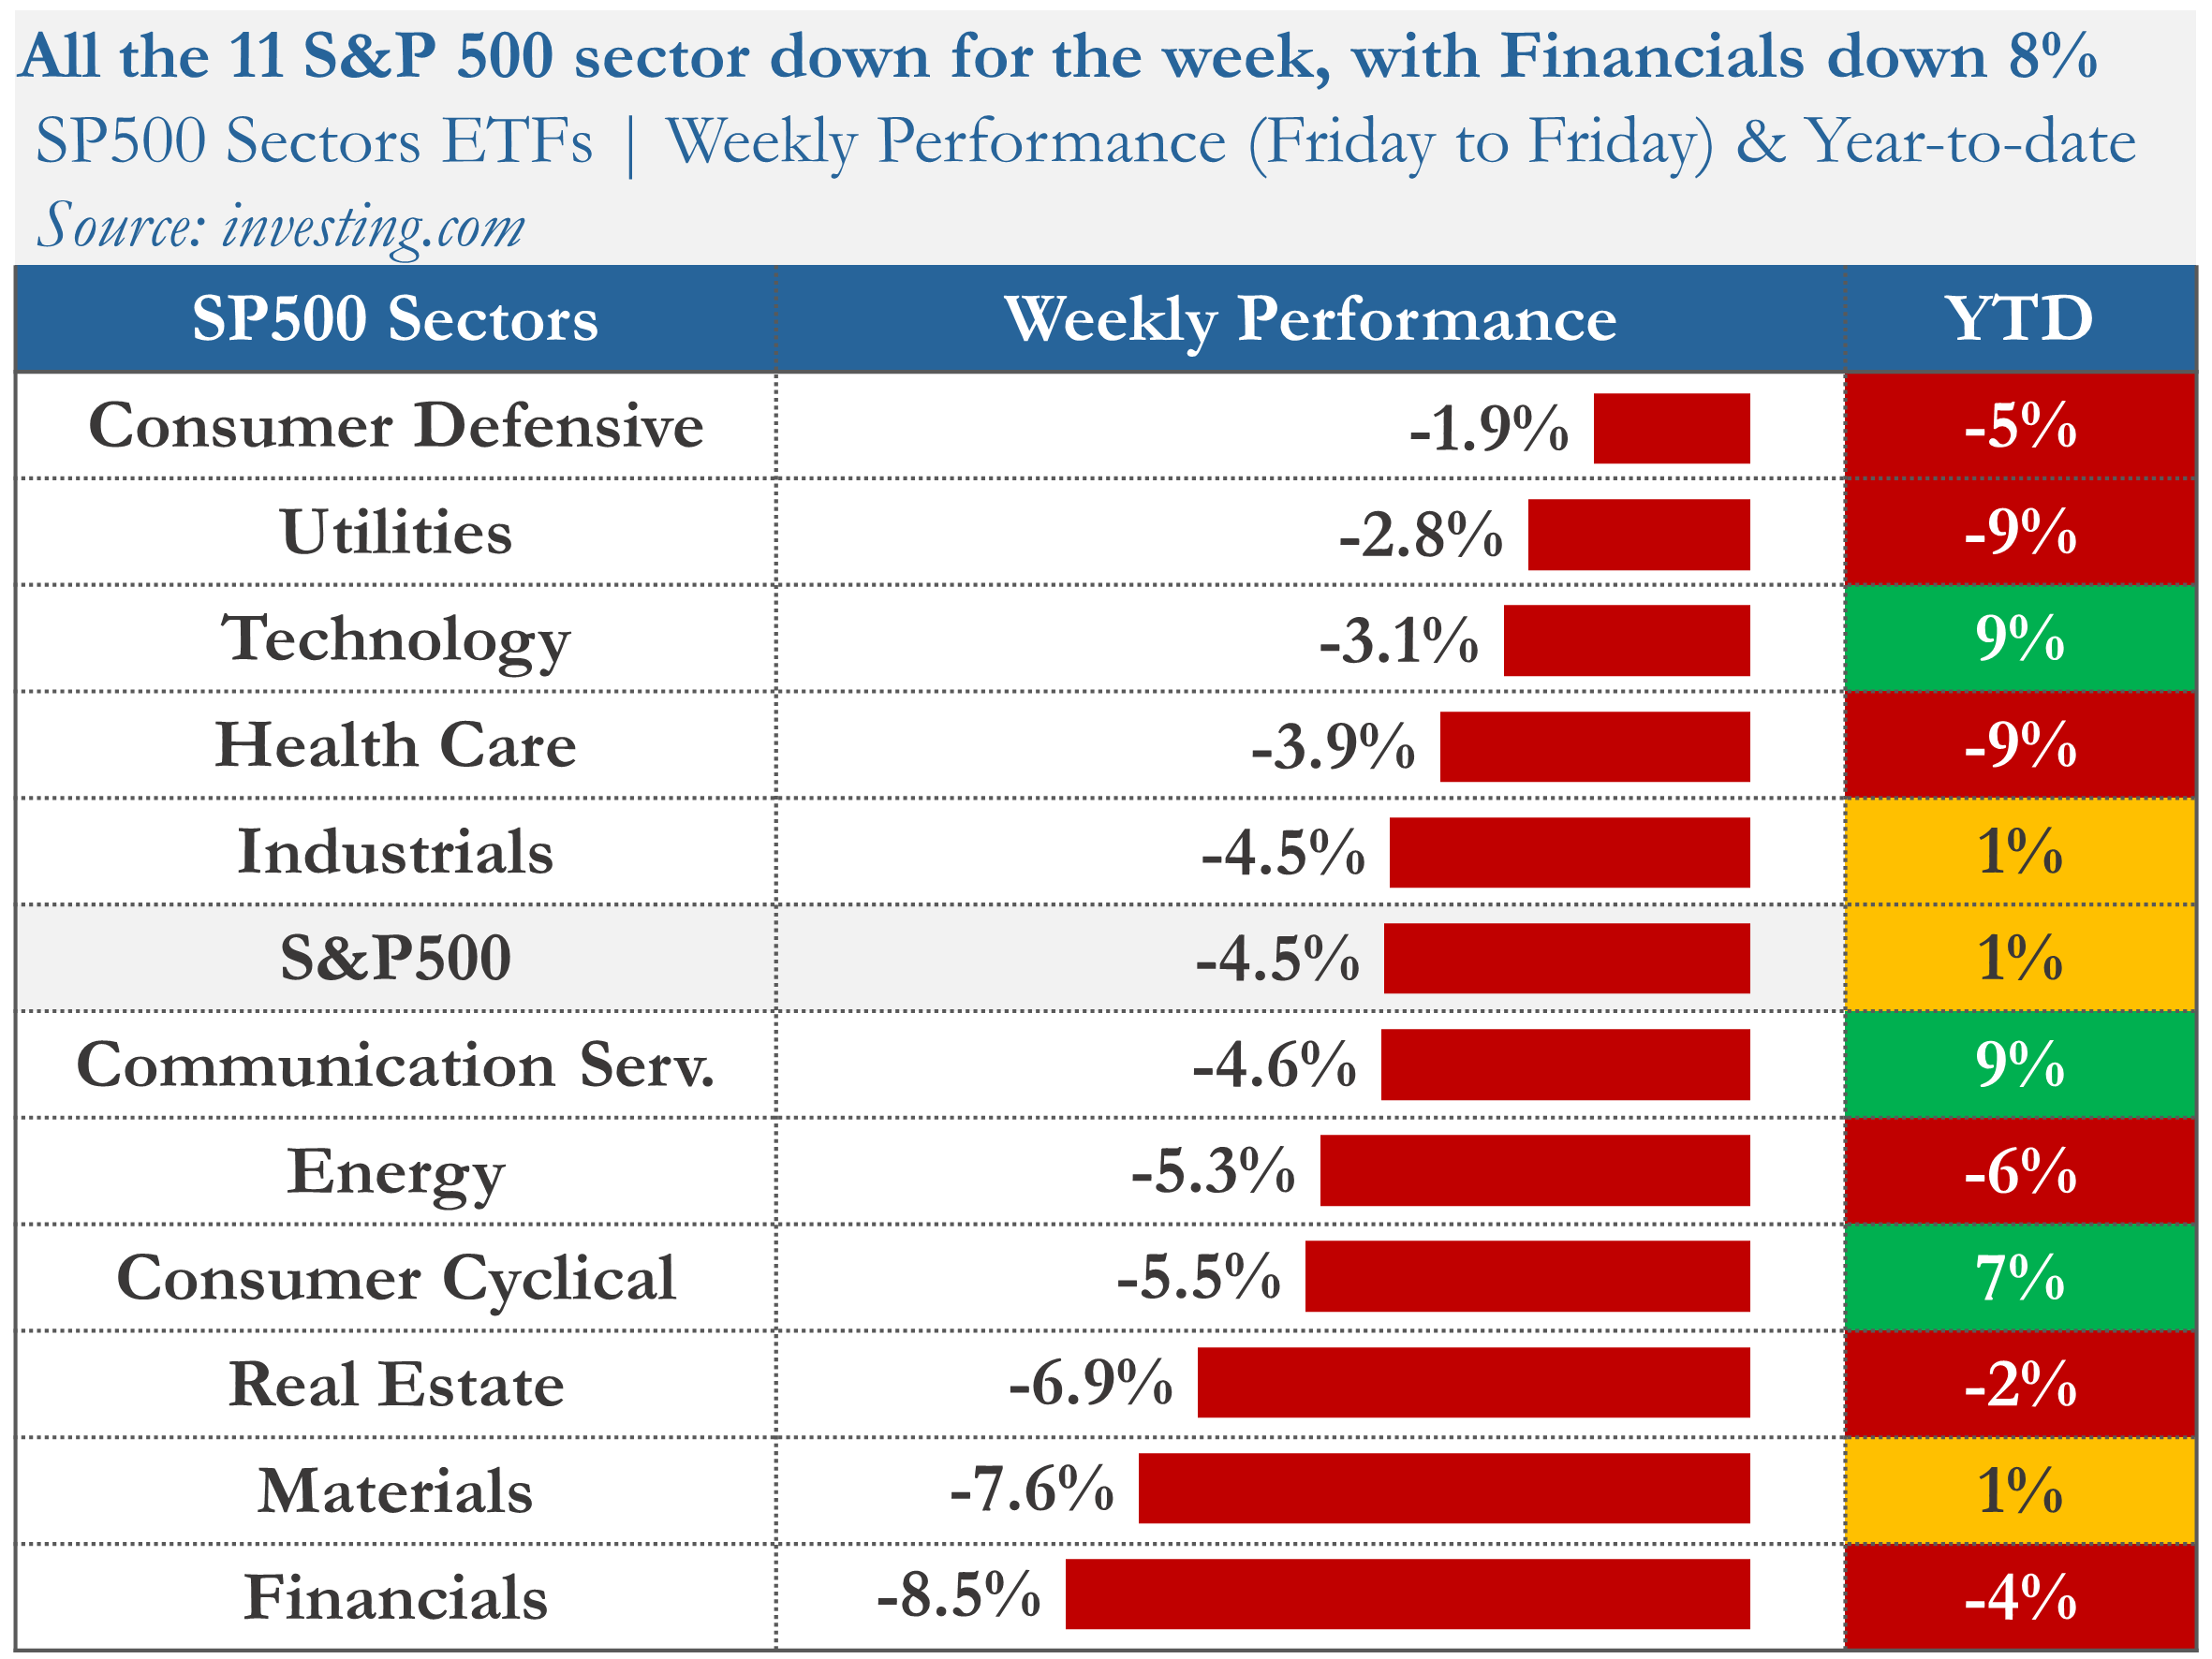
1. The markets were sharply down for the week, with the S&P 500 down 4.6%, the Dow Jones 4.4%, and the Nasdaq 4.7%. Consumer Defensive (-1.9%) and Utilities (-2.8%) were the best-performing sectors.
2. The markets fell following hawkish comments from Fed Chair Powell suggesting that interest rates may need to be increased more than anticipated, to fight inflation. The collapse of SVB Financial Group, the 16th largest bank in the US, also contributed to the market downturn, particularly affecting financial stocks.
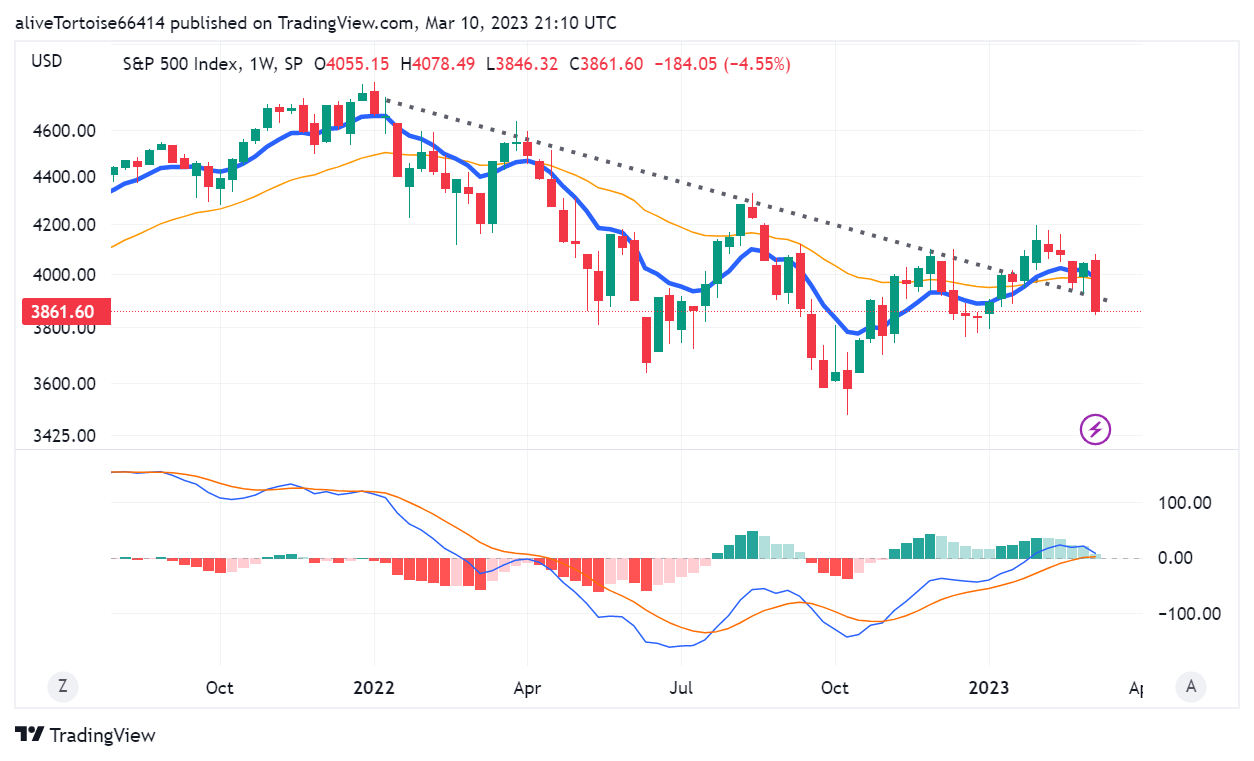
3. The long-term trend for the S&P500 is deteriorating, and we need to recapture ~3’940, which marks the 200-day moving average and the 1-year trend line.
4. The earnings season is almost over, and 496 companies from the S&P 500 index have released their Q4 results, with 68% beating estimates. Earnings are expected to fall 3% in Q4 2022 and rise 2% in 2023.
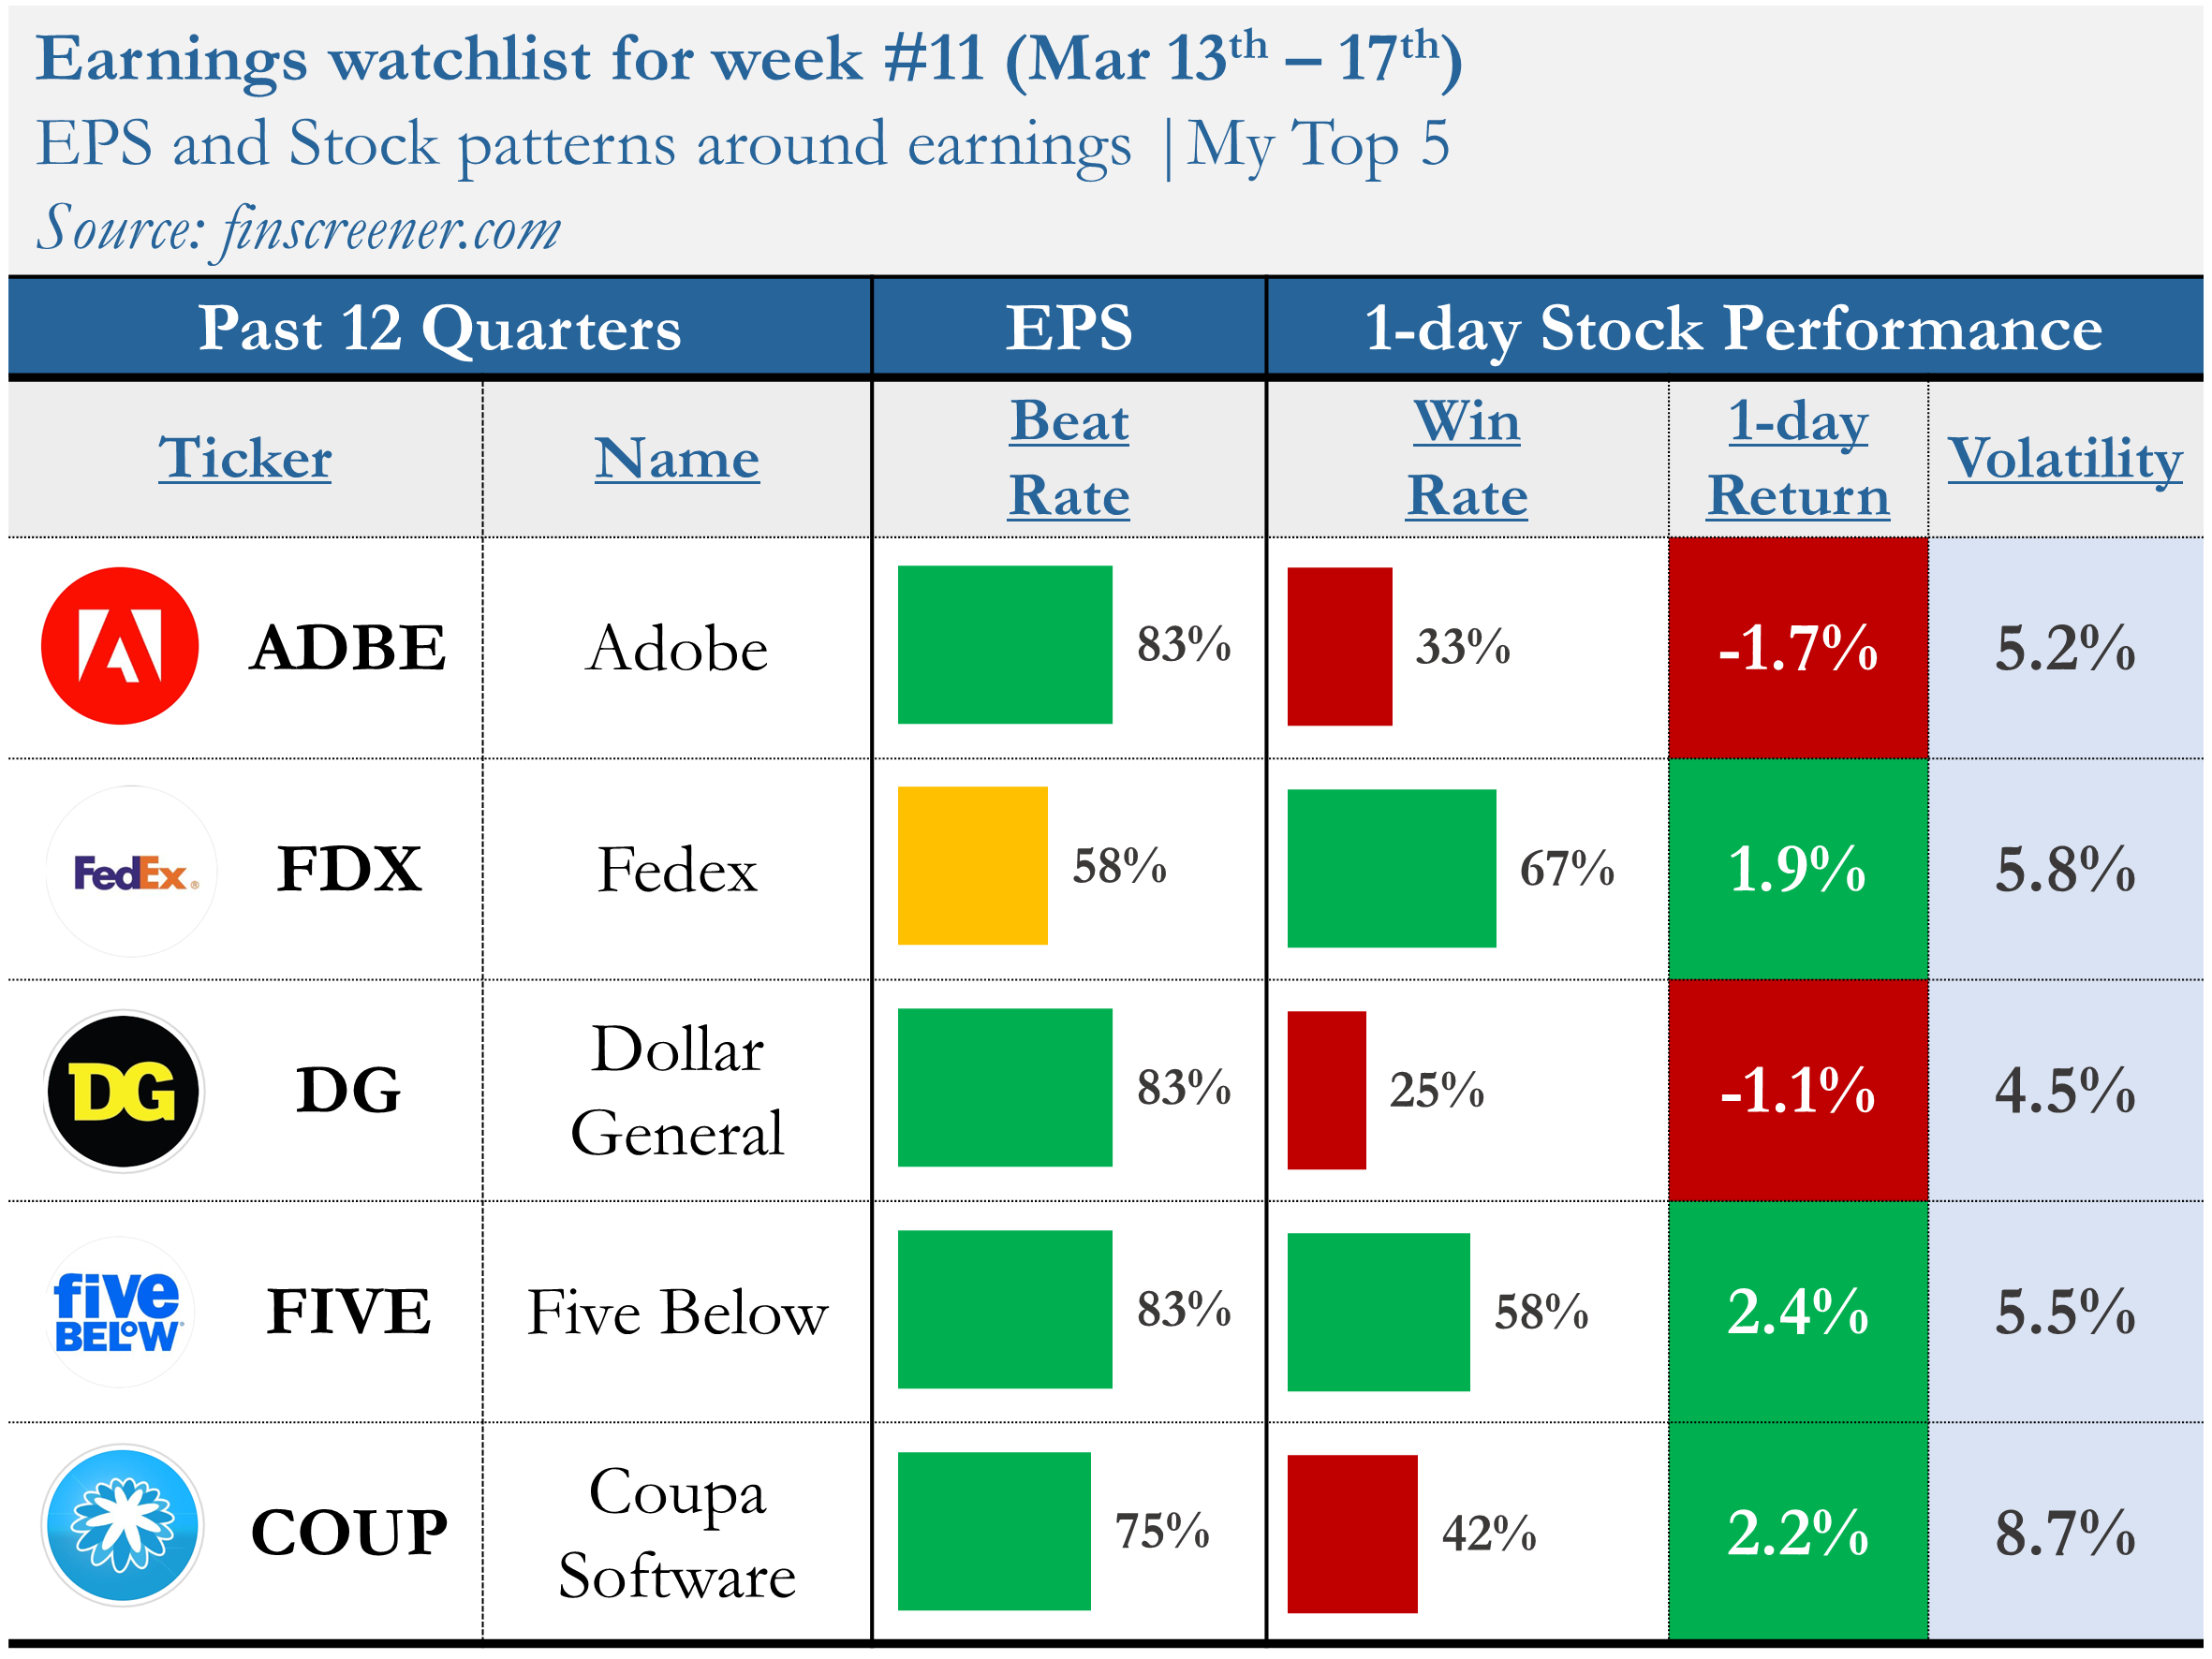
5. Earnings reports from Adobe, Dollar General, and FedEx are scheduled for next week, along with the release of the February CPI and Retail Sales report.
My take:
I expected the market to overreact to Fed officials' comments, and unfortunately, we saw that happen again this week. The testimony in front of Congress from the Fed Chair was not received well by the market, which caused the S&P 500 to lose almost all of its 2023 gains.
This week's price action was concerning because we lost several critical levels, including the 4’000 psychological level, the 1-year trend breakout level, and the 200-day moving average (~3’940). We must recapture these lost levels to recover from this, or we may see a potential retest of the October 2022 lows.
The current market conditions make it challenging to trade short-term, as there is no clear market direction. We are stuck in a choppy trading zone until we go above the August 2022 high (4’290) or below this bear market low (~3’500).
PERFORMANCE RECAP
1. SP500 Sector Performance
Over the week, none of the S&P 500 sectors had achieved gains. Consumer Defensive led the way but fell by 1.9%. By contrast, Financials was the weakest, falling by 8.5%.
Year-to-date, 5 sectors have seen positive results. Communication Services has been the most successful sector, with a 9% gain. On the other hand, Utilities have been trailing behind.
2. S&P 500 Weekly Heat Map
Over the last five trading days, only 2% of the stocks in the S&P 500 index have risen in value.
The best-performing stocks were:
General Electric Company (GE, 5%)
Arista Networks, Inc. (ANET, 4%)
Intel Corporation (INTC, 3%)
Meanwhile, the worst-performing stocks were:
SVB Financial Group (SIVB, -86%)
Signature Bank (SBNY, -38%)
First Republic Bank (FRC, -34%)
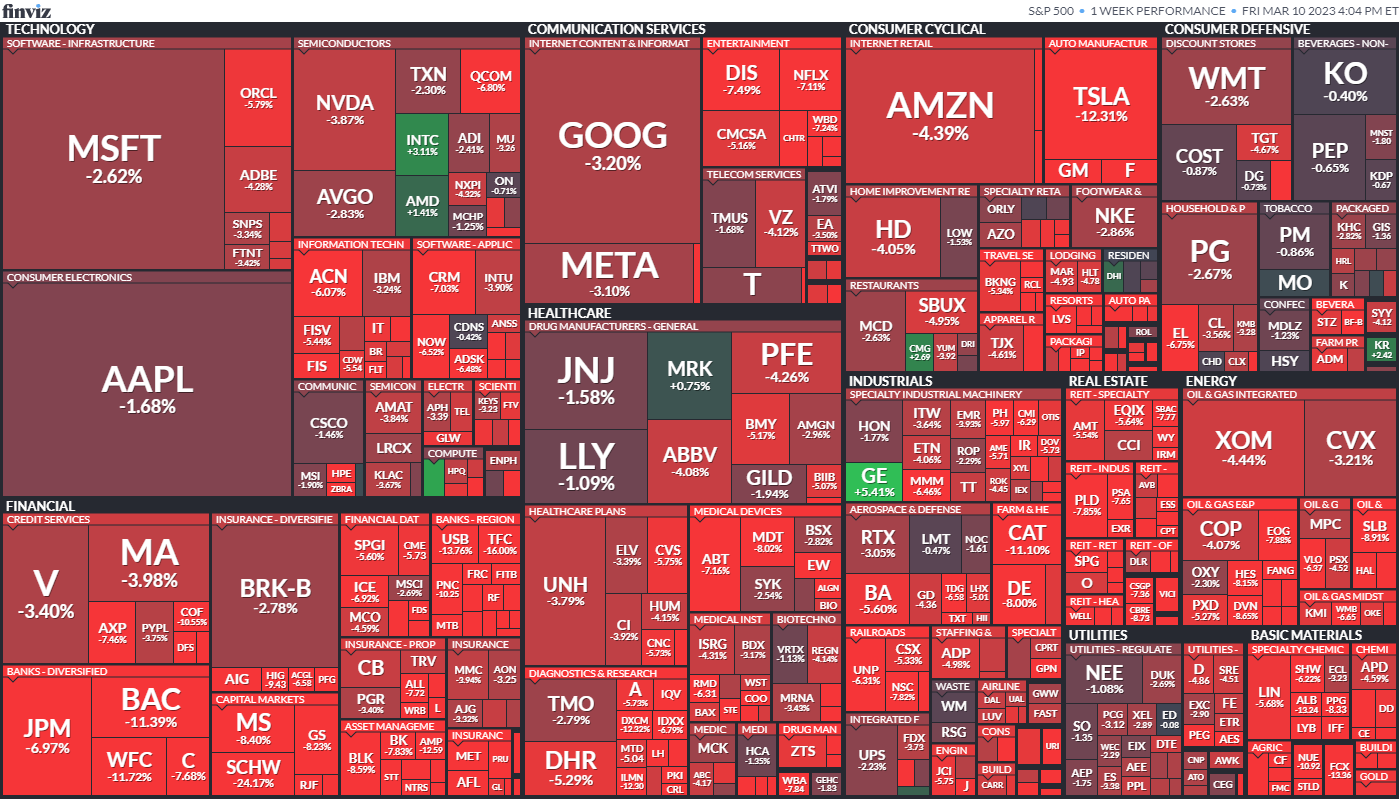
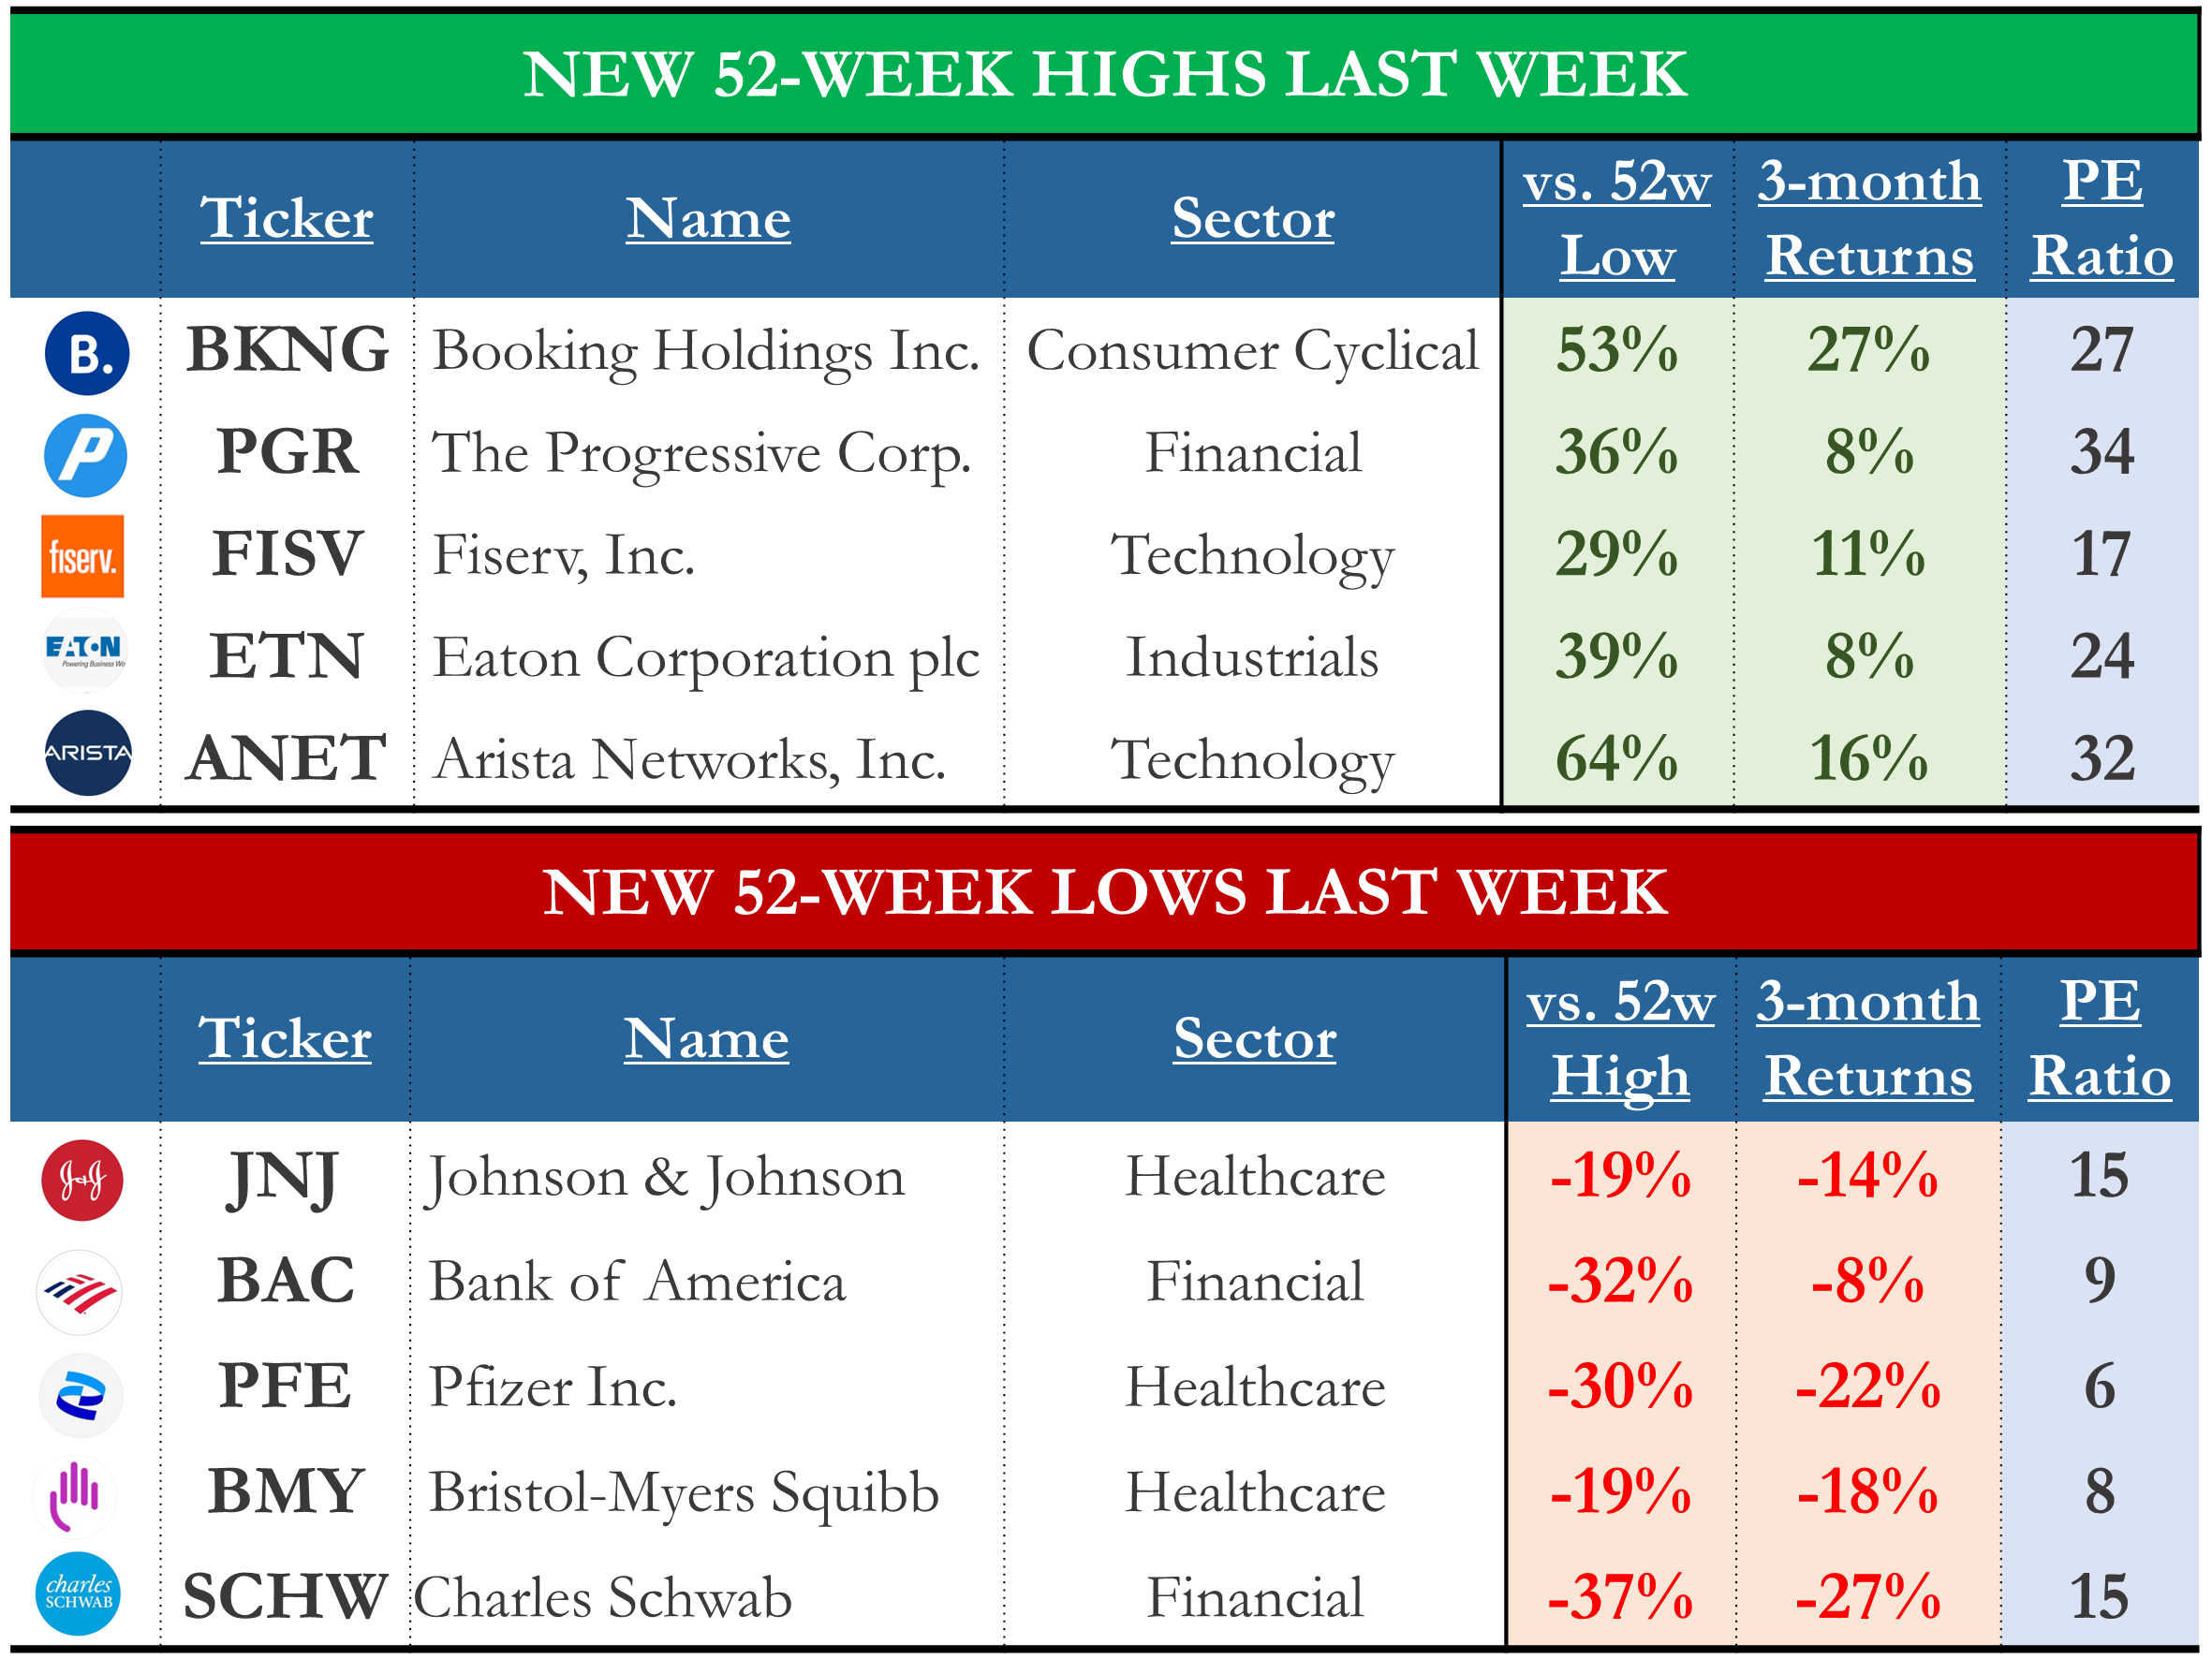
In addition, 43 stocks within the S&P 500 reached a new 52-week low, while 23 set new highs. The momentum continued to slow down this week.
MARKET TRENDS & MOMENTUM
1. S&P 500 Long-Term Trend
The long-term trend for the S&P500 is mixed and deteriorating. I base this evaluation on the weekly chart's 9 and 30 exponential moving averages (EMAs). To determine if the trend is strongly positive, I look for three conditions:
Price is trading above the EMA9 and EMA30: 🔴
EMA9 is above the EMA30: 🟡
Both moving averages are rising: 🟡
I also use MACD as an additional tool to detect trend changes. The MACD might soon cross below its signal line, a negative indication for the index.
2. Short-term outlook and key levels
The S&P 500 successfully tested the 200-day moving average and recaptured the 4,000 level, sparking a rally on Friday. As I mentioned in last week's recap, I was keeping a close eye on the index's reaction to these levels, and despite the volatility, this was a positive development.
Regarding specific levels to watch, 3’940 (200-day moving average) and 4’180 (the high in 2023) are the next significant resistances. The ultimate resistance is 4’300, which would officially start a new bull market. On the other hand, 3’770 and ~3’500 (bear market low) are crucial support ranges to defend.
3. Momentum Analysis of the Week
This week's momentum analysis focuses on the S&P 500 sectors' trends. Using a combination of performance metrics and technical indicators, I've developed a proprietary algorithm to rank these sectors and identify potential outperformers. Based on this approach, I've identified the Industrials sector as having the best relative momentum this week.
For daily updates and content on momentum trading, follow me on Instagram.

EARNINGS RECAP
1. Earnings Season Summary
99% of the S&P 500 have released their Q4 2022 earnings, with 68% posting higher EPS than expectations. However, this is lower than the previous four-quarter average of 73%.
2. Expected EPS & Revenue Growth
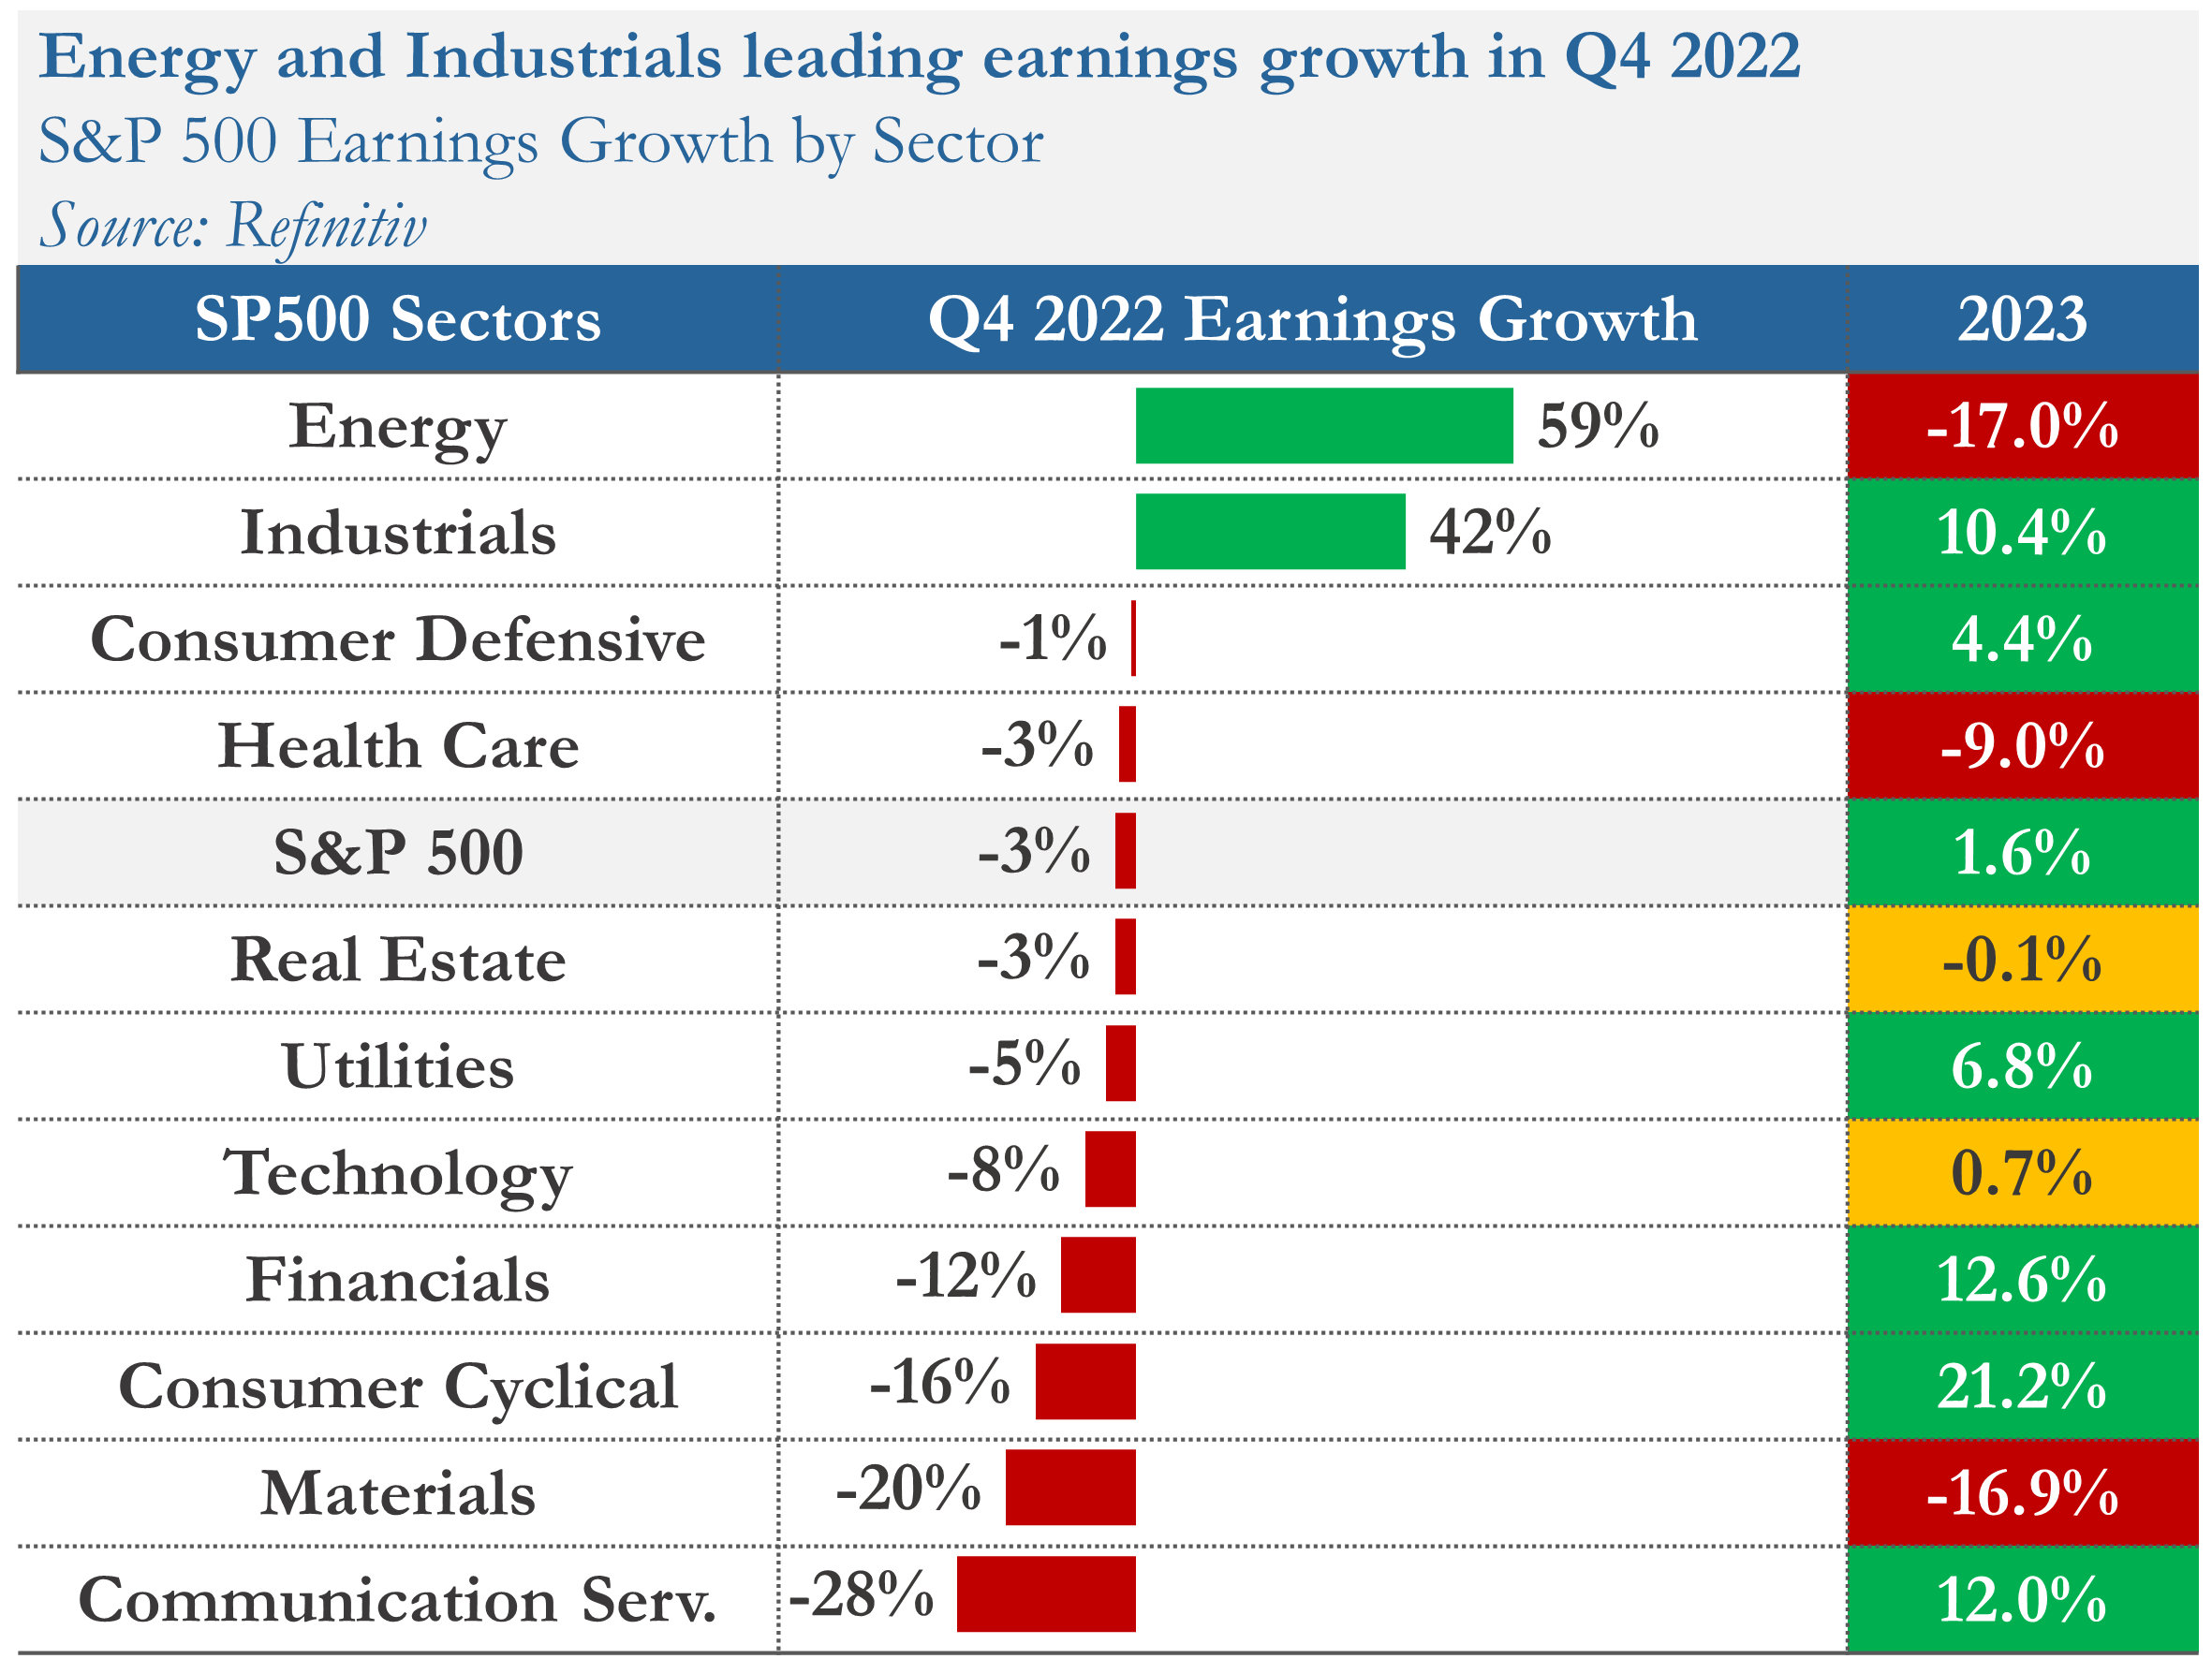
Q4 2022 earnings for the S&P 500 are expected to decline by 3%. Excluding the energy sector, the figure falls to -7%.
The earnings growth rate for 2023 is projected at +2%, lower than the 9% average seen over the last decade. Earnings are expected to increase year-over-year in 7 of the 11 sectors, with the Consumer Cyclical and Financials sectors leading the way. On the other hand, the Energy and Materials sectors are projected to see the worst decline.
MARKET SENTIMENT
Measures of investor sentiment can be helpful as they provide insight into the views and opinions of professional or individual investors. However, it's important to note that these measures are not perfect predictors of market movements. They should be combined with other indicators and analysis tools for a complete market picture.
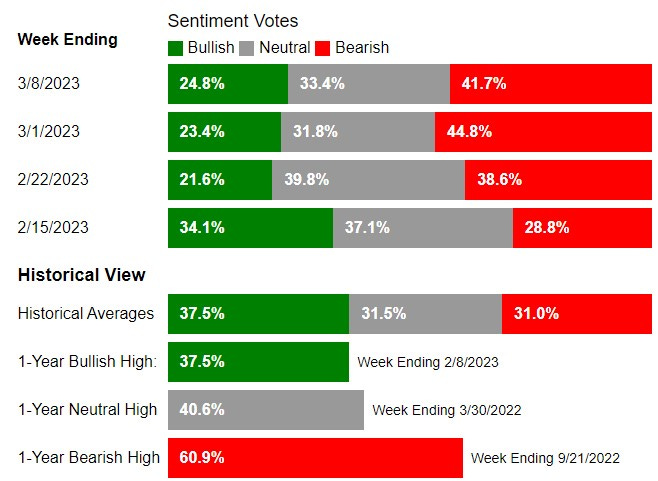
1. Individual Investors (AAII)
The American Association of Individual Investors (AAII) conducts a weekly survey among its members to gauge their expectations for the stock market over the next six months. The results of the survey are published every Wednesday.
According to the most recent AAII survey, 25% of the respondents had a bullish outlook on the stock market, a 2-point increase from the previous week. The investors' bullish sentiment remains unusually low as per historical levels.
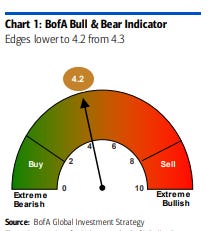
2. Institutional Investors (BofA Bull & Bear Indicator)
The Bank of America Bull-Bear Indicator is a proprietary measure of investor sentiment developed by Bank of America. It is based on a survey of fund managers and institutional investors, and it tracks the percentage of respondents who are bullish, bearish, or neutral on the stock market. Results are published in the form of a score ranging from 0 (extremely bearish) to 10 (extremely bullish)
The indicator fell from 4.3 to 4.2 and remains mixed but improving from the 2022 lows.
THE WEEK AHEAD
1. Economic Calendar
The upcoming week will be dominated by inflation concerns as the February Consumer Price Index (CPI) is expected to show a 6.0% increase in year-over-year inflation. Additionally, the retail sales report is due next week and will provide insight into the strength of consumer spending.
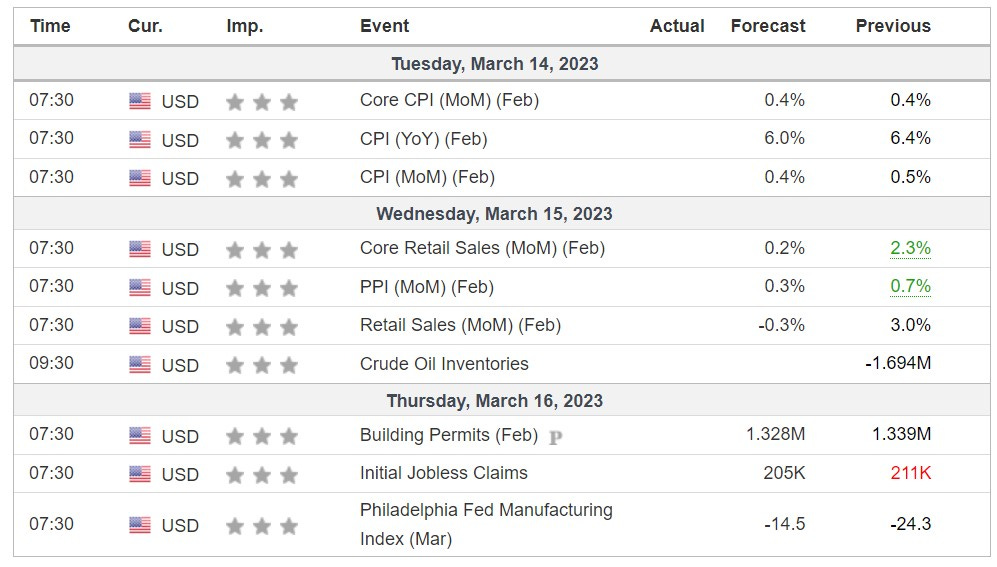
2. Earnings Calendar
4 companies from the S&P 500, including Adobe, Dollar General, and FedEx, are set to report their quarterly earnings next week.
3. Next Week’s Earnings Watchlist
Thank you for reading my weekly market recap! I hope you found it helpful in understanding the stock markets better. If you did, please share this post with your friends and followers.
If you have any questions or feedback, please don't hesitate to reach out by email or in the comment section. Your support helps me to continue creating high-quality content and is greatly appreciated!
Have a great week!
My Weekly Stock
DISCLAIMER
The information provided in this newsletter is for informational purposes only and should not be taken as financial advice. Any investments or decisions made based on the information provided in this newsletter are the reader's sole responsibility. We recommend that readers conduct their own research and consult a qualified financial professional before making investment decisions. The author does not assume any responsibility for any losses or damages arising from using the information provided in this newsletter.