


Weekly Market Recap (May 5-9): S&P 500 Tests Key Levels – Breakout or Another Trap?
Everything you need to know about last week's markets performance and what to expect next.
Dear readers,
Welcome back to My Weekly Stock, where in-depth market analysis meets proven momentum-based trading strategies. My mission? To help you win in the markets with unbiased, data-driven insights you can act on.
Friday means it's time to review the week in the markets. Each week, I dedicate hours to curating this market recap, preparing insightful analysis with clear visuals and a structured layout—making it easy for you to find exactly what you need, week after week. And because it's easy to get swayed by personal bias, I like to let the data do most of the talking.
If you want the full experience, consider upgrading your subscription. Paid members get access to all my portfolios, real-time trade alerts, in-depth analysis, and a clear momentum-based framework you can follow and learn from.
Start today. Your first month is completely FREE. If you’re ready to give it a try—or just want to support my work—this is your chance!
Let's dive in!
SUMMARY
Here are this week's highlights and what to look out for next:
1. The markets were slightly negative this week, with the S&P 500 down -0.5%, the Nasdaq -0.3%, and the Dow Jones -0.2%. Industrials (+1.1%) and Utilities (+0.6%) were the best-performing sectors.
2. The S&P 500's long-term trend is mixed, but the short-term momentum is mostly positive. 5,700 is the next resistance, while 5,575 is support.
3. The Q1 earnings season is under way and 450 companies from the S&P 500 index have released their quarterly results, with 76% beating estimates. Earnings are expected to be up 14% in Q1 and 9% in 2025.
4. Market sentiment is at the "Greed" level (62/100) as measured by CNN’s Fear & Greed indicator, while VIX is at a very high value of 22.
5. Earnings reports from Walmart and Cisco, the latest CPI and Retail sale data are scheduled for next week.
My take:
For several weeks, I've highlighted the 5,700 area as the first real challenge for the bulls—a confluence of major resistance and key trend lines like the 200-day moving average and the 30-week EMA. While it's common to see sharp bounces in bear markets, it's typically around these trend lines that we find out whether the worst is truly behind us or if a retest of the lows is still ahead.
So far, we haven't broken through this resistance cleanly, but we haven't seen a deep pullback either. That's enough to give the bulls some credit as we head into critical weeks ahead with key economic data, trade headlines, and the tail end of earnings season on deck. Whatever your approach—buying dips or waiting for stronger confirmation like me—make sure you have a plan and stay disciplined. I wouldn't be surprised to see more volatility.

PERFORMANCE RECAP
1. S&P 500 Sector Performance
This week, 6 out of the 11 S&P 500 sectors posted gains. Industrials led the market with a 1.1% increase, while Health Care was the laggard, dropping 4.2%.
Year-to-date, 7 sectors have achieved positive performance. Utilities is the top-performing sector with a 6 % gain, while Consumer Cyclical lags behind, with a 9.8 % loss.

2. S&P 500 Top & Worst Performers
Over the last five trading days, 54% of the stocks in the S&P 500 index rose in value.
Top Performers:
$PODD (Insulet Corporation): 20.9%
$CRL (Charles River Laboratories International Inc): 17.2%
$ROK (Rockwell Automation Inc): 16.2%
$MCHP (Microchip Technology, Inc): 15.5%
$DIS (Walt Disney Co): 14.5%
Worst Performers:
$DASH (DoorDash Inc): -10.5%
$LLY (Lilly(Eli) & Co): -10.8%
$MTCH (Match Group Inc): -11.4%
$MRNA (Moderna Inc): -12.2%
$REGN (Regeneron Pharmaceuticals, Inc): -12.9%

In addition, 31 stocks within the S&P 500 reached a new 52-week high, while 14 stocks set new lows. The majority of this week’s highs came from the Financials sector.
Notable Highs:
$NFLX (Netflix Inc)
$PM (Philip Morris International Inc)
$GE (GE Aerospace)
$SCHW (Charles Schwab Corp)
$CME (CME Group Inc)
Notable Lows:
$UNH (Unitedhealth Group Inc)
$PEP (PepsiCo Inc)
$TMO (Thermo Fisher Scientific Inc)
$REGN (Regeneron Pharmaceuticals, Inc)
$BDX (Becton Dickinson & Co)

MARKET MOMENTUM
1. Momentum Review
To evaluate the market's current health, I examine 4 key elements: performance, breadth, trends, and key levels. Healthy bull markets typically feature indices setting new highs, broad market participation, and ascending trend lines.
Performance (MIXED 🟡): evaluating recent market performance to gauge the momentum’s strength. Ideally i want to see returns accelerating short-term and index trading less than 5% from its 1-year high
1-month performance: +2.9% 🟢
3-month performance: -6.1% 🔴
vs. 1-year high: -8.0%🟡
Breadth (MIXED 🟡): assessing market participation to understand the health of the trend. Extreme levels (above 80% or below 20%) may indicate overextended trends.
% of stocks above 200-day moving average: 43% (up from 41% last week) 🟡
% of stocks above 20-day moving average: 76% (down from 88% last week) 🟢
Trends: analyzing trend strength across multiple timeframes using exponential moving averages, scored on a scale of 1 to 5. A score of 3 or above suggests solid trends and supports holding a position.
Weekly chart: MIXED ⭐️⭐️ (stable vs last week)

Daily chart: STRONG ⭐️⭐️⭐️⭐️ (improving vs last week)

4-hour chart: STRONG ⭐️⭐️⭐️⭐️ (stable vs last week)

Key levels: identifying critical price zones to confirm the current trend or signal a potential reversal.
Support:
$5,220 (-7.8%)
$5,450 (-3.7%)
$5,575 (-1.5%)
Resistance:
$5,700 (+0.7%)
$5,775 (+2.0%)
$6,000 (+6.0%)
2. Post of the Week
This week's momentum analysis is about the Mega Caps. Using a combination of performance metrics and technical indicators, I've developed a proprietary algorithm to rank 10 mega-cap stocks. Based on this approach, I've identified Berkshire Hathaway (BRK.B) and Walmart (WMT) as having the best relative momentum currently, while Microsoft (MSFT) and Meta (META) show good potential.
EARNINGS & ECONOMIC REPORTS RECAP
1. Earnings Outlook
Q1 Earnings: S&P 500 earnings are expected to grow by 14%, rising to 16% when excluding the energy sector.
2025 Full-Year Outlook: Earnings are expected to increase by 9%, in line with the 10-year average growth of 9%.
Analyst Revisions: Over the past month, 49% of all earnings revisions by analysts have been upward adjustments to their outlook.
Valuation: The forward 4-quarter P/E ratio stands at 20.9, above the 5-year and 10-year historical averages.

2. Earnings Season Recap
Out of 450 S&P 500 companies that have reported first-quarter earnings, 76% exceeded EPS expectations. It is in line with the four-quarter average of 77% and above the historical average of 67%.
Below are some notable companies that reported earnings last week. I’ve highlighted their EPS and revenue performance vs estimate, as well as their stock return this week.
One highlight of the week was Disney, the clear winner with double beat on Revenue and EPS. The stock gained 14% for the week.

3. Economic Reports
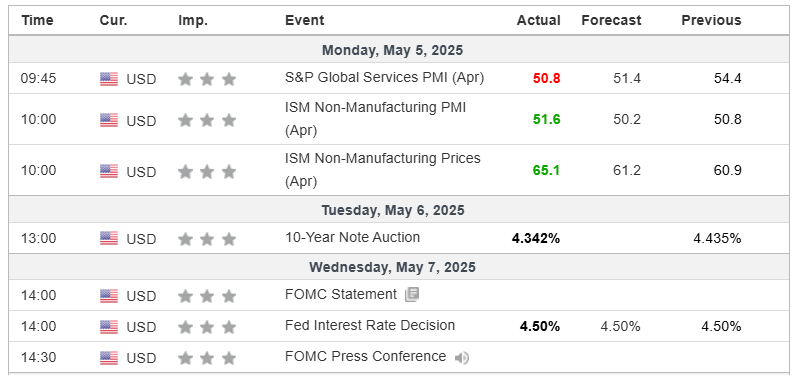
The week's main economic report/topic was the FOMC, where the US central bank left its rates unchanged at 4.50% as widely expected by the markets. But once more, the risk of stagflation was flagged, pointing to persistent inflation pressures amid signs of slowing growth.
Other reports included:
S&P Global Services PMI (Mon): Came in at 50.8, below both expectations (51.4) and the prior reading (54.4).
ISM Non-Manufacturing PMI (Mon): Surprised to the upside at 51.6, beating expectations (50.2) and slightly above last month's 50.8.
ISM Non-Manufacturing Prices (Mon): Jumped to 65.1, well above expectations (61.2) and the previous reading (60.9).
MARKET SENTIMENT
Measures of investor sentiment can be helpful as they provide insight into the views and opinions of professional or individual investors. While not definitive predictors of market direction, these measures can serve as a valuable complement to other indicators and analysis tools, helping to paint a more comprehensive picture of the market's current state.

1. AAII Sentiment Survey (Individual Investors)
The American Association of Individual Investors (AAII) conducts a weekly survey to gauge members' expectations for the stock market over the next six months. Results are published every Wednesday.
In the latest survey, 29% of respondents had a bullish outlook, up from 21% the previous week.
2. BofA Bull & Bear Indicator (Institutional Investors)
The Bank of America Bull-Bear Indicator measures investor sentiment based on fund managers' and institutional investors' views. Scores range from 0 (extremely bearish) to 10 (extremely bullish).
The most recent reading was 3.6, a slightly bearish sentiment.
3. CNN Fear & Greed Index (Technical)
This daily measure analyzes seven indicators to assess how emotions drive market decisions. Scores range from Extreme Fear to Extreme Greed.
The index closed at 62 (Greed), up from 43 last Friday.
THE WEEK AHEAD
1. Economic Calendar
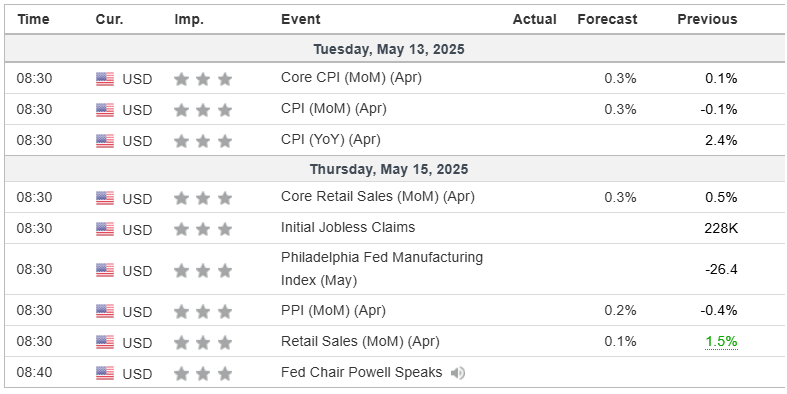
It’s a packed week of data ahead, with a strong focus on inflation, as markets brace for April’s CPI, PPI, and retail sales reports.
Key reports to watch:
CPI (Tue): Headline inflation is expected at 0.3% MoM, after falling -0.1% in March. The YoY reading was 2.4% last month.
Core CPI (Tue): Forecast at 0.3% MoM, up from 0.1% in March, pointing to still-elevated underlying inflation.
PPI (Thu): Expected to rebound 0.2% MoM, following a sharp -0.4% drop last month.
Retail Sales (Thu): Forecast to rise 0.1% MoM, down sharply from March’s strong 1.5% gain.
Fed Chair Powell Speech (Thu): Scheduled just after the key data releases; markets will watch for commentary on inflation persistence and rates path.
2. Earnings Calendar
The earnings season continues next week, and 11 companies from the S&P 500, including Walmart and Cisco, are expected to release their quarterly results.
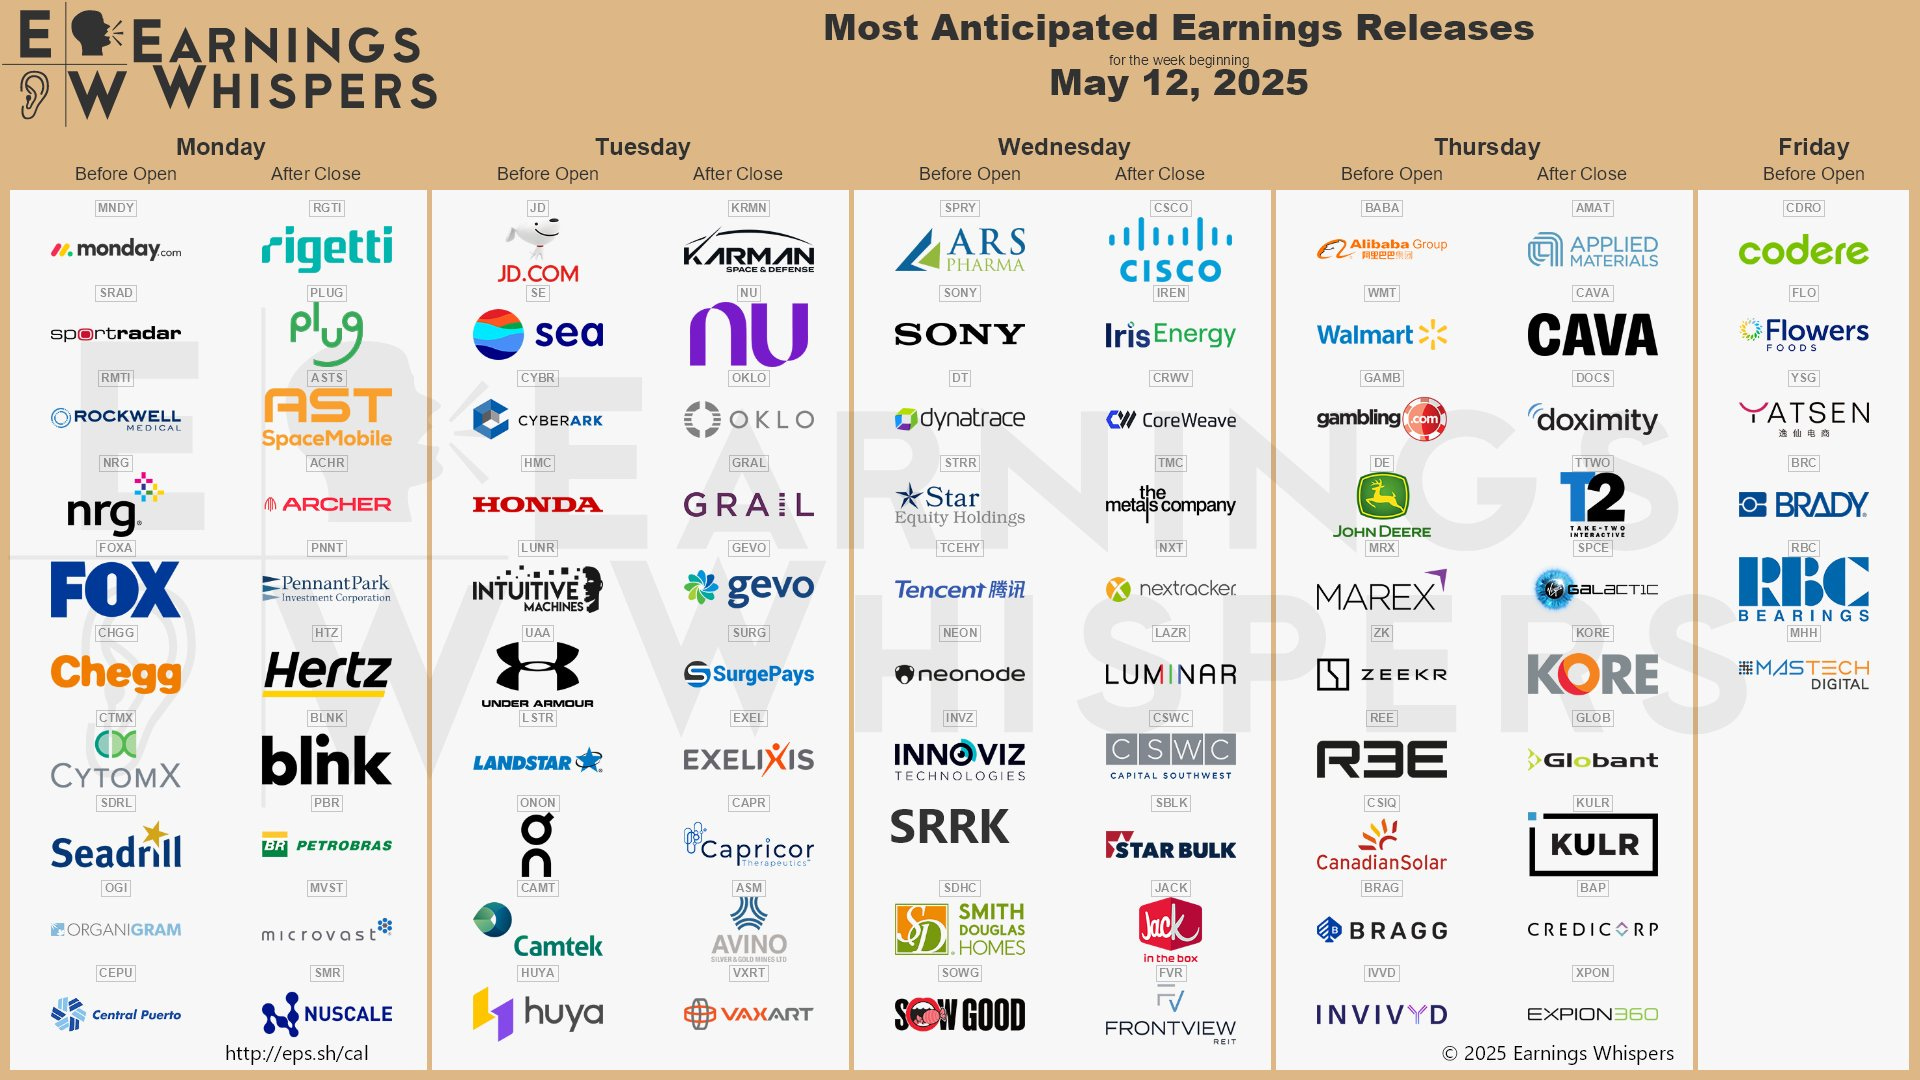
Below are notable stocks reporting earnings next week, along with several key indicators I like to monitor:
Stock Indicators:
3-Month Performance: Assessing recent stock trends.
RSI (Relative Strength Index): A reading above 70 suggests overbought conditions, while below 30 indicates oversold.
P/E Ratio: A value below 25 often points to a "cheap" valuation or low growth expectations.
Stock Price Reactions to Earnings:
1-Day Stock Return on Earnings: How the stock performs on its earnings release day.
Implied Volatility: The options market's forecast for the expected 1-day stock move after earnings.

3. Stock Analysis of the Week
Every week, I share my analysis of 1 stock that has reported earnings in recent weeks, focusing on implications for long-term investors. This week, I prepared an analysis of Microsoft ($MSFT).
👨💻 My View: BUY
Microsoft had been lagging in 2024, stuck in a tight $400–$450 range for most of the year. And 2025 didn’t start any better, with a breakdown triggered by the economic and tariff worries.
But we’re now seeing a strong recovery. The stock has delivered a powerful bounce from its April low, capped by a clean surge above the 30-week EMA following solid earnings last week.
I like the relative strength here and believe Microsoft can re-emerge as a market leader, especially if broader market weakness is finally put behind us. I’m considering adding to my long-term portfolio soon.
Check out the post for more details about $MSFT performance, trend and key levels.
CONCLUSION
Thank you for reading my Weekly Market Recap, which, I hope, got you ready for the week ahead.
If you want to take your investing journey to the next level, consider upgrading to a paid subscription. Subscribe now and learn more about my holistic, end-to-end momentum approach to investing.
Your first month is free, so this is the perfect opportunity to explore the full value of My Weekly Stock with no commitment!
Thanks again, and I look forward to sharing my market recap with you next week.
Happy investing!
My Weekly Stock
DISCLAIMER
The information provided in this newsletter is for informational purposes only and should not be taken as financial advice. Any investments or decisions made based on the information provided in this newsletter are the reader's sole responsibility. We recommend that readers conduct their own research and consult a qualified financial professional before making investment decisions. The author does not assume any responsibility for any losses or damages arising from using the information provided in this newsletter.
Markets are uncertain!