


Weekly Market Recap (Nov. 27 - Dec 1)
Everything you need to know about last week's markets performance and what to expect next
Dear subscribers,
Welcome to my weekly market recap!
Navigating the markets can be overwhelming, but I'm here to provide you with the latest updates and actionable insights to help you succeed. Whether you're an experienced investor or just starting out, my recap has something for everyone.
I hope you enjoy this week's edition and find it helpful. If you like what you see, please share it with your network on social media and, if you haven't already, subscribe to our email updates.
Thank you for joining us, and let's get started!
SUMMARY
Here are this week's highlights and what to look out for next:
1. The markets were positive for the week, with the S&P 500 up 0.8%, the Nasdaq 0.4%, and the Dow Jones 2.4%. Real Estate (+4.7%) and Materials (+2.7%) were the best-performing sectors.
2. The stock indices continued their march up, fueled by optimism that the economy could achieve a soft landing.
3. The long-term trend for the S&P 500 is positive, and so is the short-term momentum. The next resistance is at 4,600, while support is at 4,400.
4. The earnings season is almost over, and 490 companies from the S&P 500 index have released their 3rd quarter results, with 82% beating estimates. Earnings are expected to be up 7% in Q3 2023 and 11% in 2024.
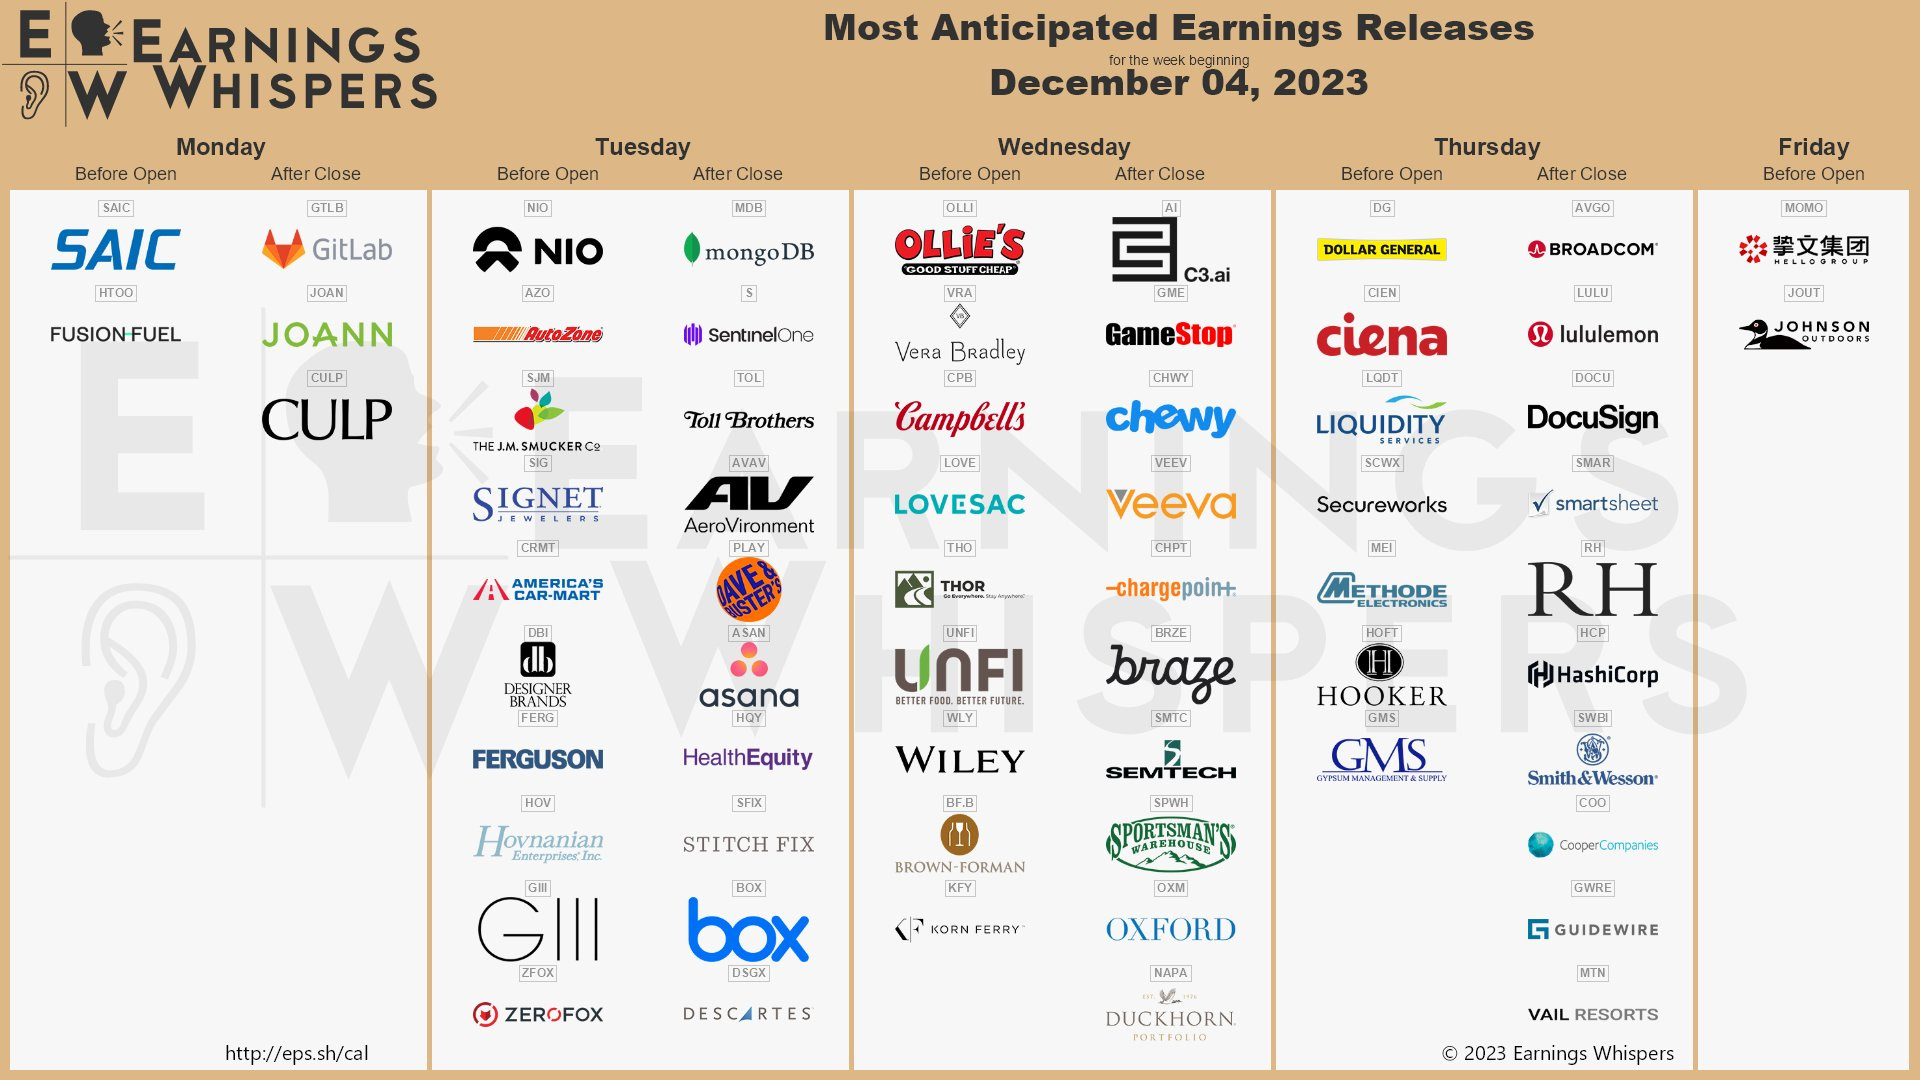
5. Earnings reports from Campbell Soup and Dollar General and the Non-Farm Payroll report are scheduled for next week.
My take:
We've seen a 5th consecutive week of gains, though it has been relatively quiet, and the S&P500 traded in a tight 50-point range. My analysis remains unchanged; ideally, I'd like to see a minor pullback before the anticipated Santa rally starts in earnest. Yet, the bears seem dormant for now, and any small dips are quickly bought.
Looking ahead, the 4,600 zone remains the next significant resistance, which we tested for the 1st time this Friday. Meanwhile, 4,400 is the support we should hold on any pullback now.
The long-term trend remains positive, and I'm "cautiously" optimistic that we will reach new all-time highs in the upcoming months.

PERFORMANCE RECAP
1. SP500 Sector Performance
Over the week, 10 of the 11 S&P 500 sectors have achieved gains. Real Estate led the way and rose by 4.7%. By contrast, Communication Services was the weakest and fell by 1.5%.
Year-to-date, 7 sectors have seen positive results. Technology has been the most successful sector, with a 49% gain. On the other hand, Utilities has been trailing behind.

2. S&P 500 Weekly Heat Map
Last week, 77% of the stocks in the S&P 500 index have risen in value.
The best-performing stocks were:
Boston Properties, Inc. (BXP, 18%)
Netapp Inc (NTAP, 17%)
Salesforce Inc (CRM, 16%)
Meanwhile, the worst-performing stocks were:
Cigna Group (CI, -7%)
GE HealthCare Technologies Inc (GEHC, -6%)
Pfizer Inc. (PFE, -5%)

In addition, 76 stock within the S&P 500 reached a new 52-week high, while 4 set new lows, indicating the momentum is clearly to the upside.
The following are the top stocks, ranked by market size, that reached a new high or low in the last 5 days:

MARKET TRENDS & MOMENTUM
1. S&P 500 Long-Term Trend
The long-term trend for the S&P 500 is positive. I base this evaluation on the weekly chart's 9 and 30 exponential moving averages (EMAs). To determine if the trend is strongly positive, I look for the following conditions (the 1st is the most important):
EMA9 is above the EMA30: 🟢
Price is trading above the EMA9: 🟢
Price is trading above the EMA30: 🟢
EMA9 is rising: 🟢
EMA30 is rising: 🟢
I also use MACD as an additional tool to detect trend changes. The MACD has crossed above its signal line, signaling potentially more gains ahead.

2. S&P 500 Short-Term Outlook and Key Levels
My short-term technical analysis remained the same as the S&P 500, which traded in a tight range all week. Overall, the index remains on a positive uptrend in the short term. The 4,600 zone is the next significant resistance, while 4,440 is the support to hold on a pullback.
In the longer term, my target would be to, at minimum, test 4,800, the all-time high of the index. On the other hand, a break below 4,110 would be a setback to the bullish case.
3. Momentum Analysis of the Week
This week's momentum analysis is about seasonality, as we are about to start the month of December, the best month of the year over the past 20 years. The S&P500 has been up 70% of the time, for a +0.9% return on average.

EARNINGS RECAP
1. Q3 Earnings Season Summary
490 companies from the S&P 500 index have released their Q3 2023 earnings, with 82% posting higher EPS than expectations. This is higher than the previous four-quarter average of 74%, and the historical average of 67%.
2. Q3 and 2024 Expected EPS & Revenue Growth
Q3 2023 earnings for the S&P 500 are expected to be up 7%. Excluding the energy sector, the figure is +13%.
The earnings are projected to be up 11% in 2024, higher than the 9% growth seen on average over the last decade. Earnings are expected to increase year-over-year in all the 11 sectors, with the Healthcare and Communication Services sectors leading the way. On the other hand, the Materials and Energy sectors are projected to see a softer performance.

MARKET SENTIMENT
Measures of investor sentiment can be helpful as they provide insight into the views and opinions of professional or individual investors. However, it's important to note that these measures are not perfect predictors of market movements. They should be combined with other indicators and analysis tools for a complete market picture.
1. Individual Investors (AAII)
The American Association of Individual Investors (AAII) conducts a weekly survey among its members to gauge their expectations for the stock market over the next six months. The results of the survey are published every Wednesday.
According to the most recent AAII survey, 49% of the respondents had a bullish outlook on the stock market, a 4-point increase from the previous week. The bullish sentiment is at a 4-month high.

2. Institutional Investors (BofA Bull & Bear Indicator)
The Bank of America Bull-Bear Indicator is a proprietary measure of investor sentiment developed by Bank of America. It is based on a survey of fund managers and institutional investors, and it tracks the percentage of respondents who are bullish, bearish, or neutral on the stock market. Results are published in the form of a score ranging from 0 (extremely bearish) to 10 (extremely bullish)
The indicator rose from 2.1 to 2.7 behind strong inflows to stocks.
THE WEEK AHEAD
1. Economic Calendar
Slated for next week is the Non-Farm Payroll data. A valuable indicator of employment trends, it provides insights that can affect everything from consumer spending to Fed policies.

2. Earnings Calendar
The Q3 earnings season is well under way next week, and 7 companies from the S&P 500, including Campbell Soup and Dollar General, are expected to release their quarterly results.
3. Next Week’s Earnings Watchlist
Below is my watchlist of stocks reporting week next week, along with several key indicators I like to review:
Stock performance in the last 3 months.
RSI, where a reading of 70 indicates overbought status and a reading of 30 oversold.
PE ratio, where a reading below 25 indicates a "cheap" value and/or low growth expectations.
Implied volatility is the expected 1-day stock change after earnings are released, as assessed by the options markets.
It is helpful to analyze these indicators to understand better the stocks before their earnings.

Every week, I share a deep dive into one stock reporting earnings in the coming days. This week, I prepared an in-depth overview of Dollar General ($DG). In this post, I break down key data points around Dollar General’s fundamentals, stock returns, analyst ratings, and past earnings performance to help you make informed investment decisions.

Thank you for reading my weekly market recap! I hope you found it helpful in understanding the stock markets better. If you did, please share this post with your friends and followers.
If you have any questions or feedback, please don't hesitate to reach out by email or in the comment section. Your support helps me to continue creating high-quality content and is greatly appreciated!
Have a great week!
My Weekly Stock
DISCLAIMER
The information provided in this newsletter is for informational purposes only and should not be taken as financial advice. Any investments or decisions made based on the information provided in this newsletter are the reader's sole responsibility. We recommend that readers conduct their own research and consult a qualified financial professional before making investment decisions. The author does not assume any responsibility for any losses or damages arising from using the information provided in this newsletter.
I found you by accident and feel it was meant to be. Great analysis and insight. Appreciate the effort you put in to this..it's great.
Great summation and information.