A Momentum Review of Bear Markets: Lessons from the Past 25 Years
What 6 bear markets in the past 25 years reveal about trend shifts, recovery patterns, and how to navigate the next one.
Dear readers,
Welcome back to My Weekly Stock, where in-depth market analysis meets proven momentum-based trading strategies. My mission? To help you win in the markets with unbiased, data-driven insights you can act on.
This mid-week update is a special deep dive into bear markets. I break down six major cycles from the past 25 years using my momentum framework, focusing on where trends broke down, how long the pain lasted, and what signaled a true recovery.
The goal? To extract practical insights we can apply today as we navigate a market that’s been flashing warning signs for weeks. It isn’t about calling tops or bottoms—which is more a matter of luck than skills—but being prepared for what might come next.
Let’s go!
Analytical Framework
I assess the strength of a trend using the 9- and 30-week exponential moving averages (EMAs) as a guide. A strong uptrend has typically the following elements:
The 9-week EMA is above the 30-week EMA (most important).
Price is trading above the 9-week EMA.
Price is trading above the 30-week EMA.
The 9-week EMA trend line is rising.
The 30-week EMA trend line is rising.
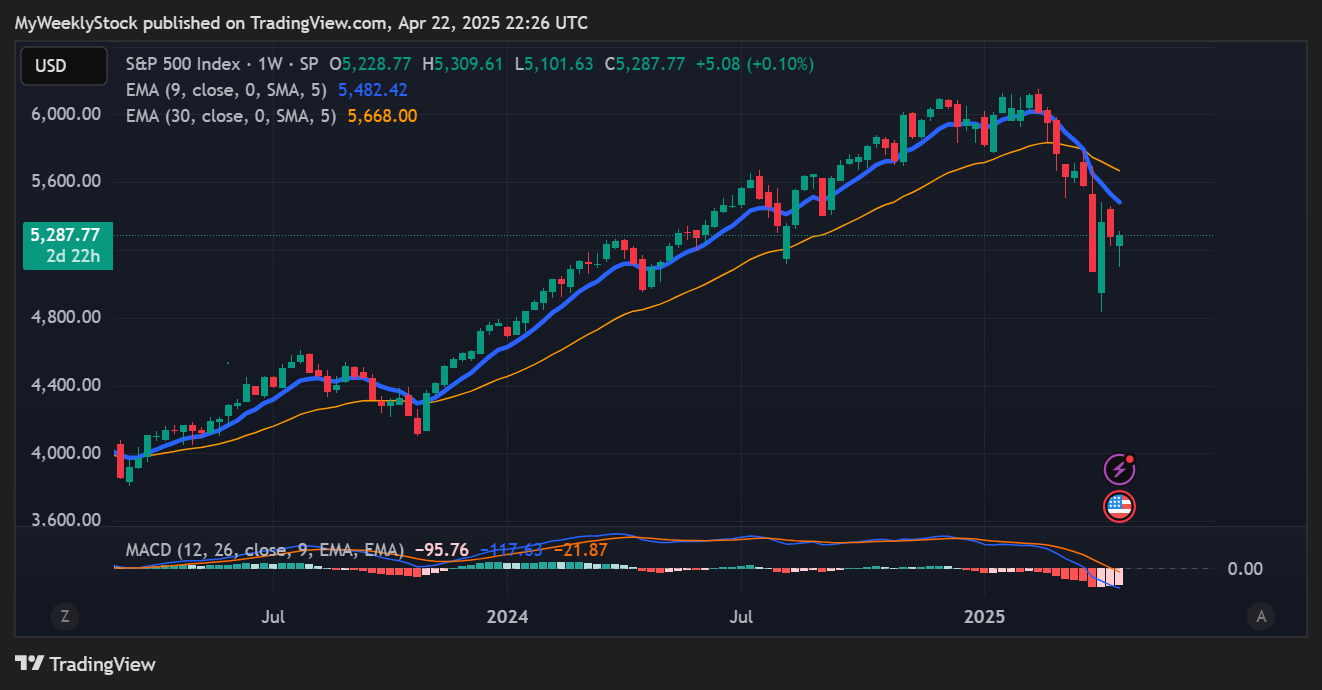
Currently, momentum is weak as the S&P 500 lost its 30-week EMA in early March. That’s notable because, in the two years of this bull market, it has only happened twice—once in October 2023 and again in August 2024. In both cases, the index quickly recovered and resumed its uptrend. This time we have seen little reaction. Even worse, there was negative follow-through—and now, both EMAs are starting to slope downward.
Note: In all the charts, the 9-week EMA is in BLUE, while the 30-week EMA is in YELLOW.
Next, I’ll analyze six bear markets of the past 25 years and look at the following metrics:
Peak: When the market topped
Trough: When the market bottomed
Duration: Length of the bearish cycle
Drop: Maximum drawdown during that period
Number of failed rallies: This one’s more subjective. I counted any rally that pushed the index back above the 30-week EMA before turning lower again.
Time to reclaim previous top: From the bear market low to fully recover the prior high.
Below, I break down each of the six bear markets using this framework—spotting patterns and common signals that marked both breakdowns and recoveries.
If you enjoy this type of analysis and want to see how I apply it to my trading and investing portfolios, you should check out the paid section. As a paid subscriber, you’ll not only support my work—you’ll also get access to my winning portfolios, exclusive momentum research, and more.
The first month is free, so it’s the perfect chance to explore My Weekly Stock with zero commitment.
Case Study #1: 2000 Dot.com Crash
Cause: Tech bubble burst, accounting scandals (Enron, WorldCom), 9/11 shock
Peak: March 24, 2000
Trough: October 9, 2002
Duration: 2 years, 7 months
Drop: -49% (Nasdaq: -78%)
Number of failed rallies: 4
Time to reclaim previous top: ~5 years and 7 months (recovered in May 2007)
Arguably the worst bear market of all—mainly because of how long it lasted and how long it took to recover. It took almost 6 years for the S&P 500 to reclaim its previous high and more than 10 years for the Nasdaq.
But what made it especially painful were the sharp fake-out rallies that kept confusing investors. It was a long, grinding bear market filled with powerful bounces that all turned out to be traps, each followed by lower lows. It took nearly 3 years to find a bottom finally; at its worst, the index had lost more than 50%.
Case Study #2: 2008 Global Financial Crisis
Cause: Subprime mortgage crisis, banking collapse, global recession
Peak: October 9, 2007
Trough: March 9, 2009
Duration: 1 year, 5 months
Drop: -57% (Nasdaq: -55%)
Number of failed rallies: 2
Time to reclaim previous top: ~4 years (recovered in March 2013)
It was the most painful bear market in terms of drawdown—but the downtrend itself was mostly clean. Aside from some uncertainty at the beginning and toward the end, the rest was an almost straightforward selloff. A disciplined investor following trend signals could have avoided most of the damage.
Case Study #3: 2011 Sovereign Debt Crisis
Cause: U.S. debt ceiling crisis, S&P downgrade of U.S. credit rating, Eurozone debt crisis
Peak: April 29, 2011
Trough: October 3, 2011
Duration: ~5 months
Drop: -20% (Nasdaq: -18%)
Number of failed rallies: 1
Time to reclaim previous top: ~4 months (recovered in February 2012)
A short and mild bear market with a fast recovery—the S&P 500 even finished the year roughly flat. Still, it took nearly a year to fully reclaim the previous high.
Case Study #4: 2018 Fed Pivot
Cause: Fed rate hikes, balance sheet reduction, U.S.-China trade war, global growth slowdown
Peak: September 20, 2018
Trough: December 24, 2018
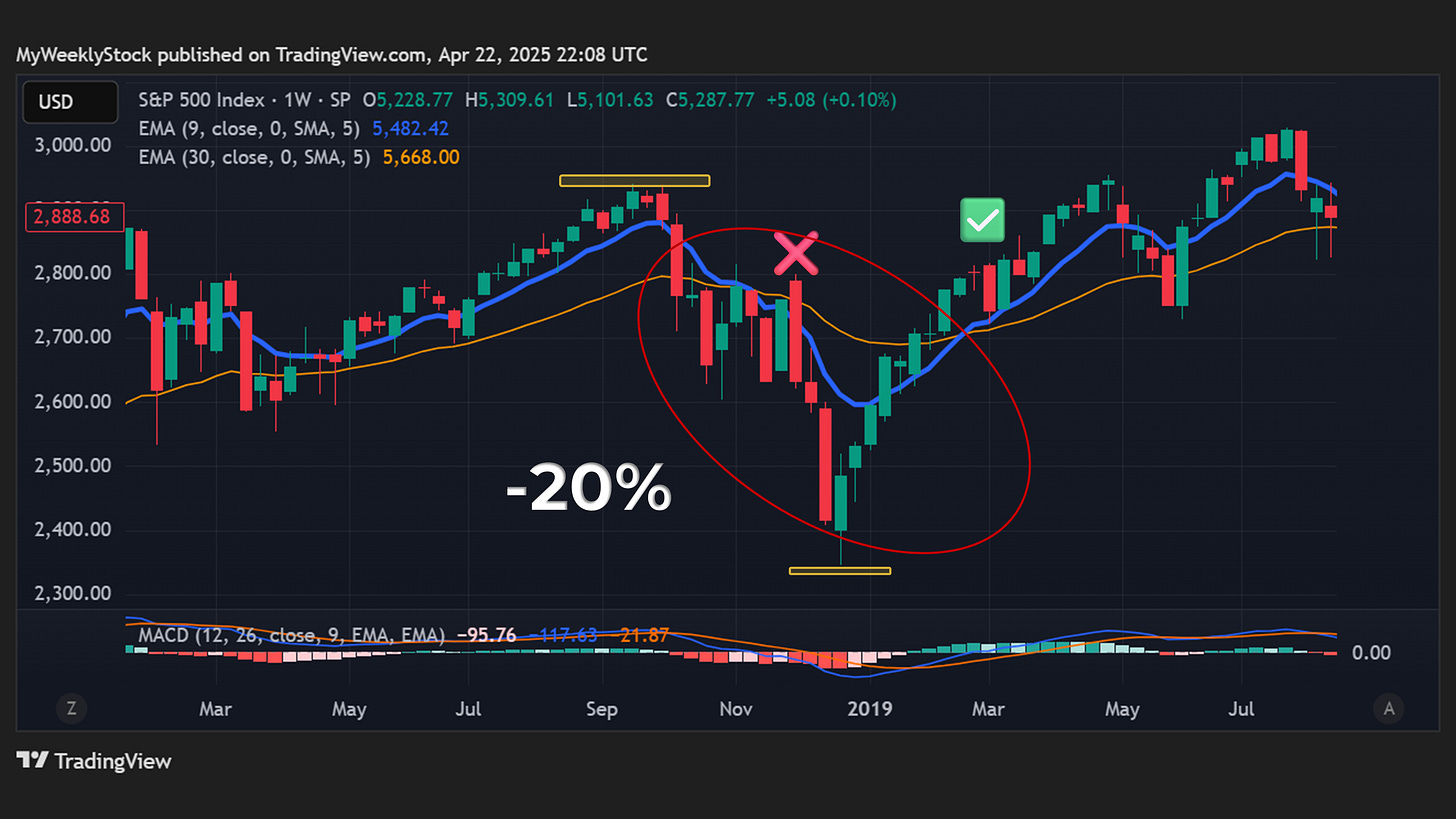
Duration: ~3 months
Drop: -20% (Nasdaq: -24%)
Number of failed rallies: 1
Time to reclaim previous top: ~4 months (recovered in April 2019)
Another relatively short-lived bear market—with an even faster recovery. I see some similarities to today’s setup regarding the causes and the weekly chart structure. Back then, the index lost its 30-week EMA and chopped around for a month before a complete breakdown. After the final capitulation, we got a strong bounce with solid follow-through in a multi-week rally. That’s exactly what today’s market needs to do for me to feel more confident.
Case Study #5: 2020 Covid Crash
Cause: COVID-19 pandemic, global shutdowns, liquidity panic
Peak: February 19, 2020
Trough: March 23, 2020
Duration: ~1 month
Drop: -34% (Nasdaq: -30%)
Number of failed rallies: 0
Time to reclaim previous top: ~5 months (recovered in August 2020)
The poster child of a V-shaped recovery. But the sheer speed made it unique—both in the breakdown and rebound. Bulls might argue that the current tariff shock is comparable and that removing the catalyst could trigger a similar snapback. That’s what we experienced in the past 2 weeks in this headline-driven market. I would argue however that the challenges in this market started before the tariff headlines. Again, only a multi-week rally would validate such a scenario.
Case Study #6: 2022 Inflation Surge
Cause: Inflation surge, aggressive Fed tightening, Russia-Ukraine war, growth slowdown
Peak: January 3, 2022
Trough: October 12, 2022
Duration: ~9 months
Drop: -25% (Nasdaq: -38%)
Number of failed rallies: 3
Time to reclaim previous top: ~16 months (recovered in early 2024)
While the length and recovery time were about average, this bear market was particularly painful because of the number of failed rallies—each one seeming to signal that the worst was over. That’s the kind of scenario that can really shake long-term investors, as it suggests the current bounce might ultimately fail, leading to a new lower low.
CONCLUSION
The bearish cycle we're experiencing will only be fully understood once it's over. That said, reviewing the bear markets of the past 25 years still brings valuable insights. For me, they point to 3 important things every investor should aim to develop as we navigate this kind of environment:
Patience. Unless we're in some kind of COVID-like, V-shaped recovery, we're probably in for a few months (or more) of chop before we can fully enjoy a new uptrend and reclaim previous highs.
Discipline. We need to be on the lookout for fake-out bounces. If the past 25 years have taught us anything, the first attempt at forming a low and bouncing is unlikely to be successful. No need to FOMO every rally.
A Clear Plan. For me, that starts with a multi-week rally that pushes the index back above the 30-week EMA. Holding that move is the first real test. The "all-clear" buy signal I rely on is when the 9-week EMA crosses back above the 30-week EMA.
That’s why I’m mostly in cash across my portfolios right now (though I hold meaningful crypto and commodity exposure in my Macro ETF portfolio). I’m sticking to the principles I outlined above and waiting patiently for momentum to improve. We’re not there yet. And yes, that might mean missing some early gains—but it’s a tradeoff I’m happy to make to protect capital.
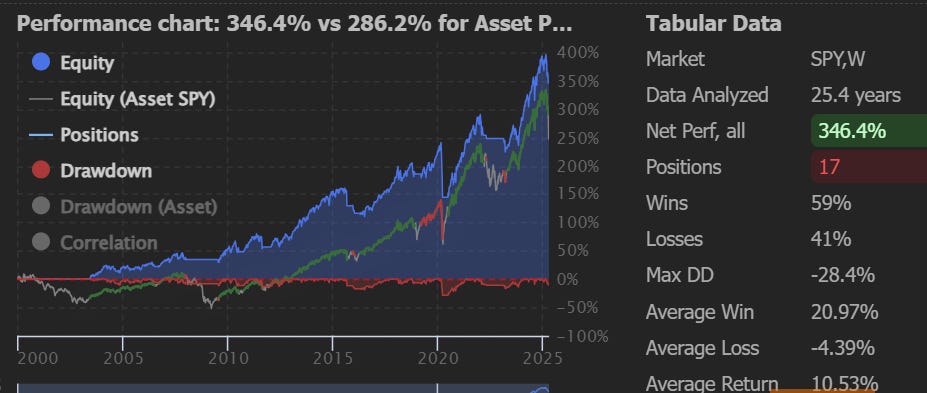
To be clear: waiting for perfect trend alignment can lead to disappointing returns—good entry points matter. And on the flip side, exiting only after everything has turned negative is often too late. To avoid that, I use a simple rule in my long-term strategy: the 9-week EMA crossing above or below the 30-week EMA. This straightforward signal, applied to the S&P 500 (via SPY), has delivered strong results over the past 25 years: a 59% win rate and a +346% total return—outperforming a buy-and-hold strategy by more than 60% points.
Regardless of your investing style—even if you don't use technical indicators—whatever your strategy, I urge you to develop your battle plan and apply patience and discipline.
SUBSCRIBER POLL
Thank you for reading this week's special update, which, I hope, provided valuable insights.
My goal with my newsletter is to show you how I connect strategy to insights and, ultimately, portfolio decisions. Sharing my holistic, end-to-end framework is the best way to bring value to you and truly help you become a better investor. But, remember, success won't come from just blindly copying someone else’s trades. Instead, do your homework and see how my work can feed into your own investing approach. After all, while I can help you navigate the markets, the journey is yours to take.
Thanks again, and I look forward to sharing my next post soon.
Happy investing!
My Weekly Stock
DISCLAIMER
Please be aware that I currently have, or may initiate, a position in the stocks mentioned in this article. This disclosure is made for transparency purposes and should not be taken as a recommendation to buy or sell any securities.
The information provided in this newsletter is for informational purposes only and should not be taken as financial advice. Any investments or decisions made based on the information provided in this newsletter are the reader's sole responsibility. We recommend that readers conduct their own research and consult a qualified financial professional before making investment decisions. The author does not assume any responsibility for any losses or damages arising from using the information provided in this newsletter.


