


Weekly Market Recap (Feb 10-14): Markets Shake Off Hot Inflation Reports - But Can Bulls Finally Clear New Highs?
Everything you need to know about last week's markets performance and what to expect next.
Dear readers,
Welcome back to My Weekly Stock, where in-depth market analysis meets proven momentum-based trading strategies. My mission? To help you win in the markets with unbiased, data-driven insights you can act on.
Friday means it's time to review the week in the markets. Each week, I dedicate hours to curating this market recap, preparing insightful analysis with clear visuals and a structured layout—making it easy for you to find exactly what you need, week after week. And because it's easy to get swayed by personal bias, I like to let the data do most of the talking.
If you want the full experience, consider upgrading your subscription. As a paid subscriber, you'll gain access to my 3 winning portfolios—and so much more: a clear investing framework, my momentum-based analysis, and live portfolio updates
Plus, as a token of my appreciation, your first month is FREE. If you're ready to give it a try—or simply want to support my work—this is your chance!
Let's dive in!
SUMMARY
Here are this week's highlights and what to look out for next:
1. The markets were positive this week, with the S&P 500 up 1.5%, the Nasdaq 2.6%, and the Dow Jones 0.6%. Technology (+3.1%) and Communication Serv. (+2.5%) were the best-performing sectors.
2. The S&P 500's long-term trend is positive, and so is the short-term momentum. 6,130 is the next resistance, while 6,000 is support.
3. The Q4 earnings season is well under way and 383 companies from the S&P 500 index have released their quarterly results, with 74% beating estimates. Earnings are expected to be up 15% in Q4 2024 and 11% in 2025.
4. Market sentiment is at the "Fear" level (44) as measured by CNN’s Fear & Greed indicator, while VIX is at a low value of 15.
5. Earnings reports from Walmart and Booking Holdings, and the latest PMI report and the FOMC meeting minutes.
My take:
This week was a significant win for the bulls as the S&P 500 closed just a few inches from its all-time high. But, once again, it wasn't an easy ride—seemingly the theme for 2025 so far. AI competition fears, tariffs, hot inflation reports, disappointing economic data—none had a lasting negative effect. That doesn't mean the choppiness is over, but even the bears must acknowledge how resilient this market has been.
Now what? We're back at the upper end of the broad 300-point range that has defined price action since December. To confirm that the consolidation phase is behind us, we need only a firm breakout to new highs. My view is that we'll keep grinding higher, but in this market, we must take it one level at a time.

PERFORMANCE RECAP
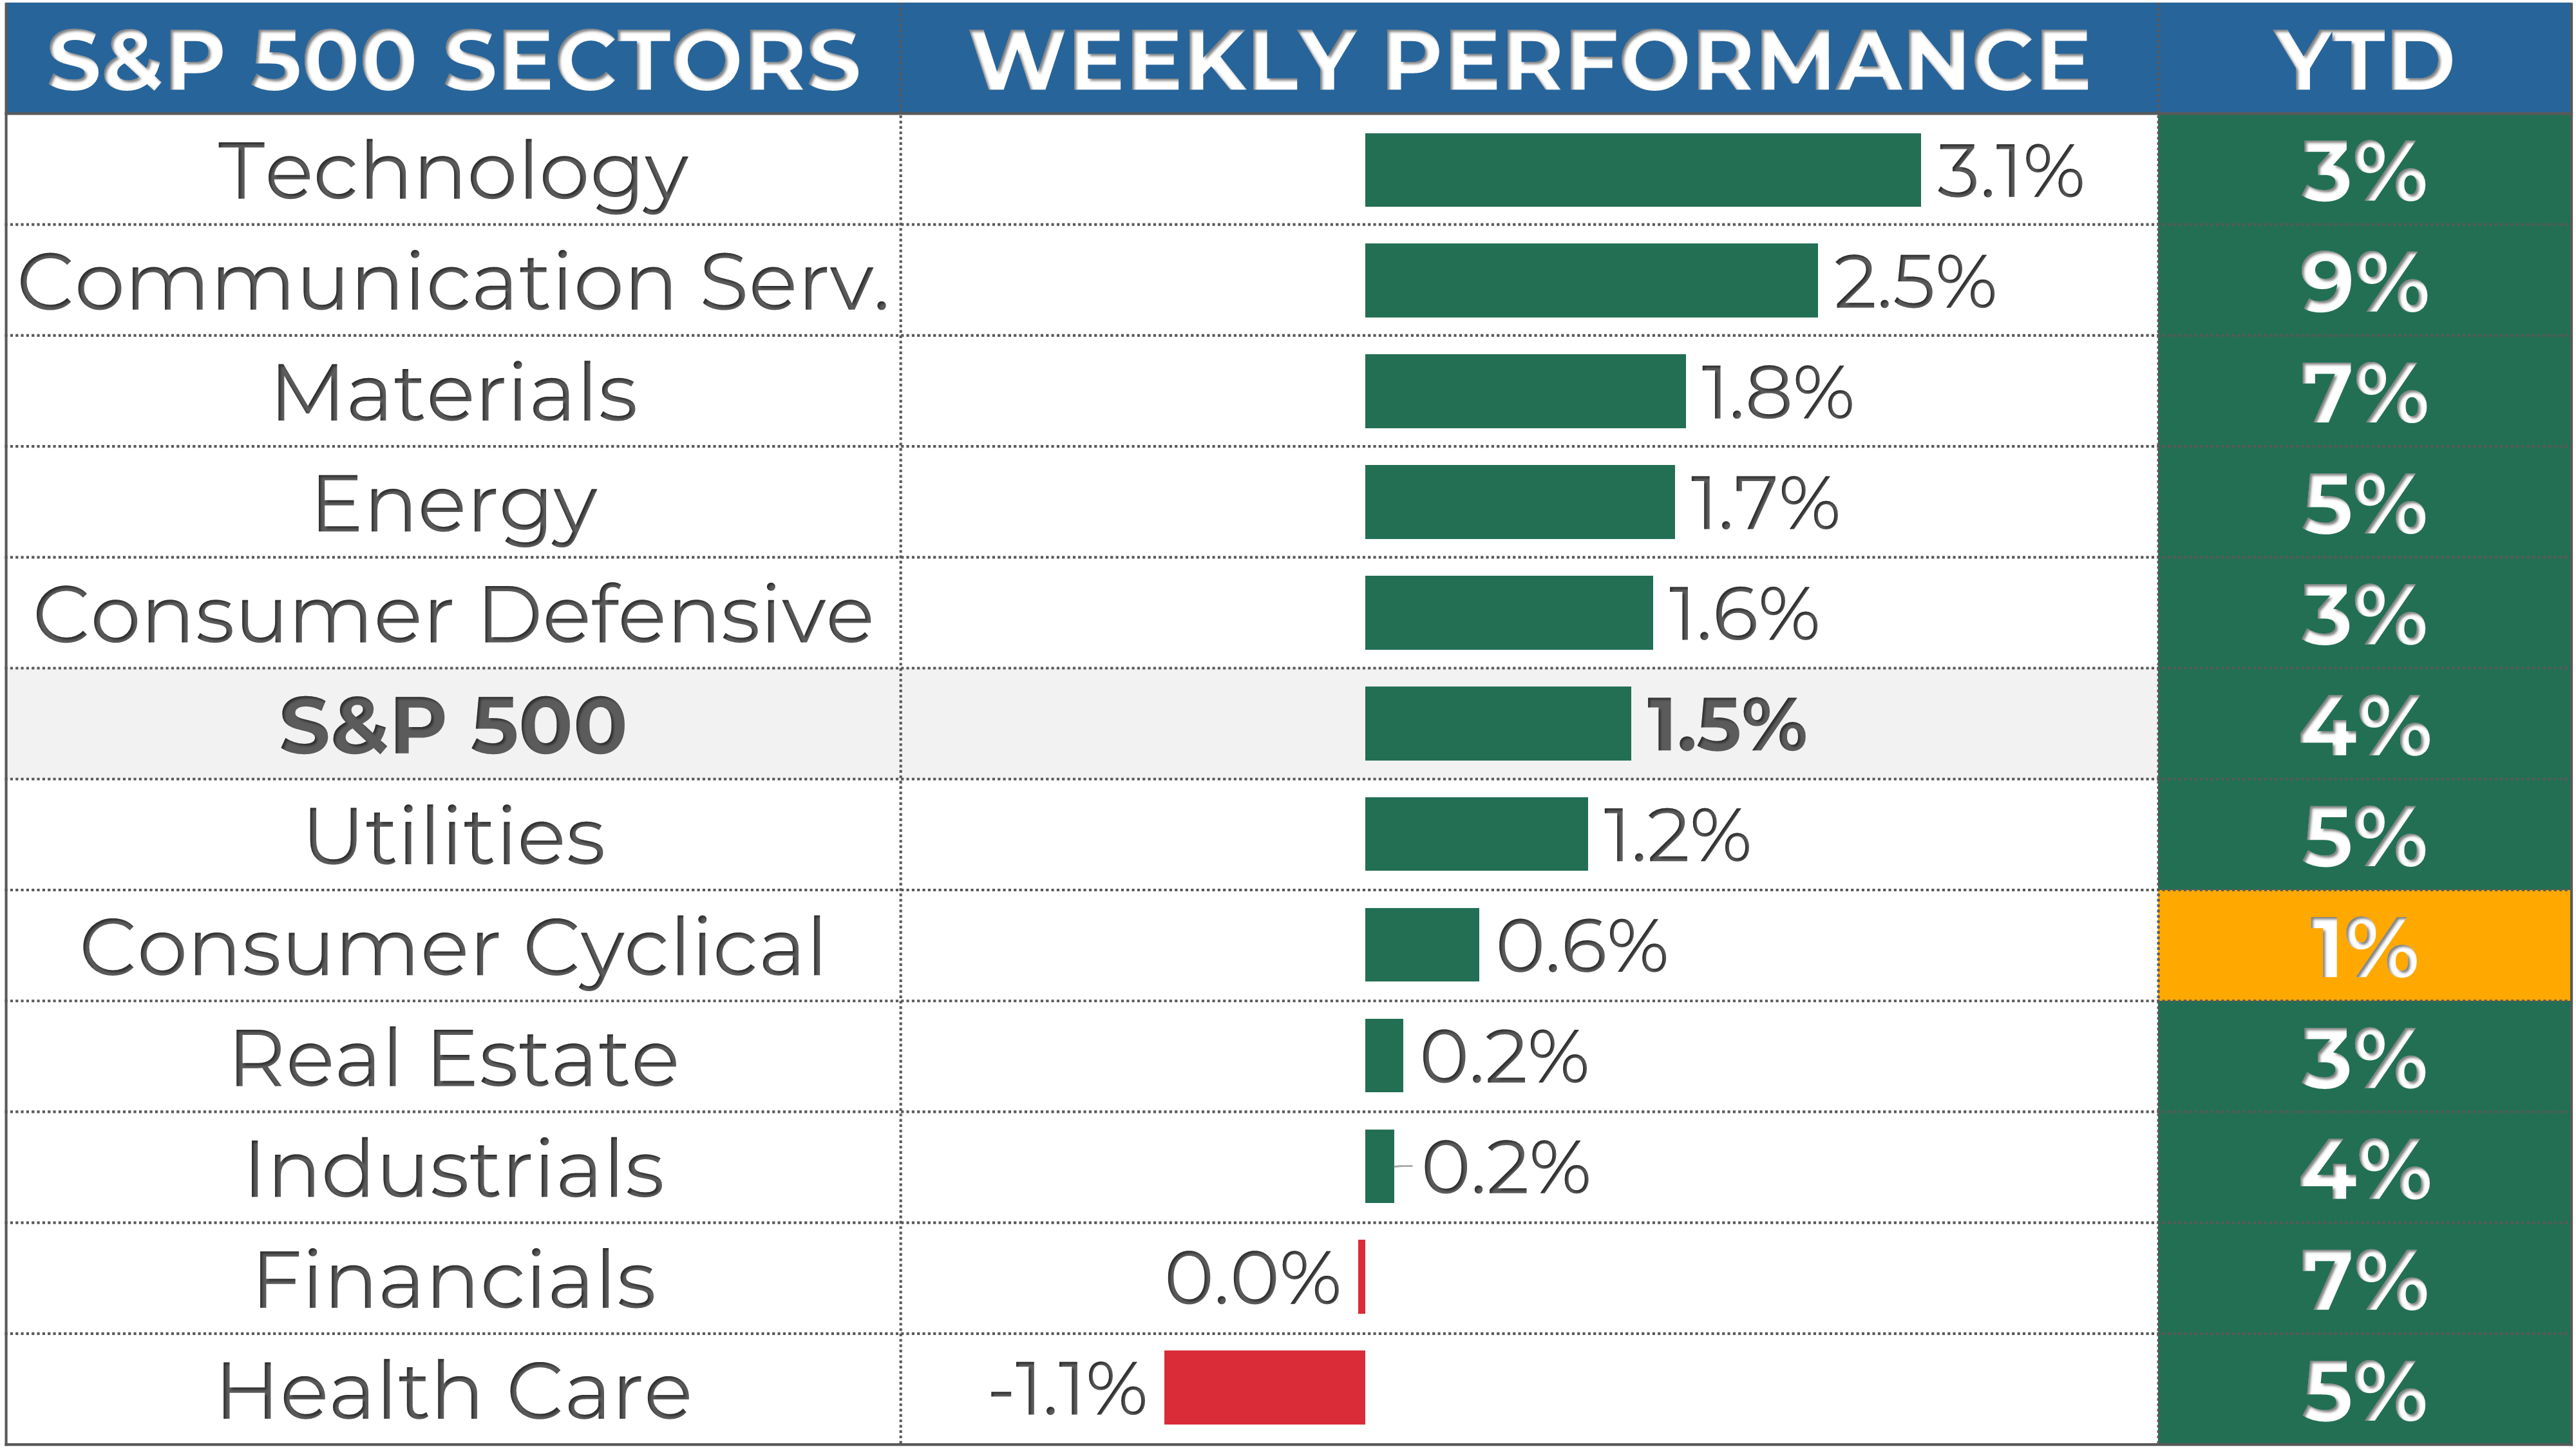
1. S&P 500 Sector Performance
This week, 9 out of the 11 S&P 500 sectors posted gains. Technology led the market with a 3.1% increase, while Health Care was the laggard, dropping 1.1%.
Year-to-date, 11 sectors have achieved positive performance. Communication Serv. is the top-performing sector with a 8.8 % gain, while Consumer Cyclical lags behind, with a 1.2 % gain.
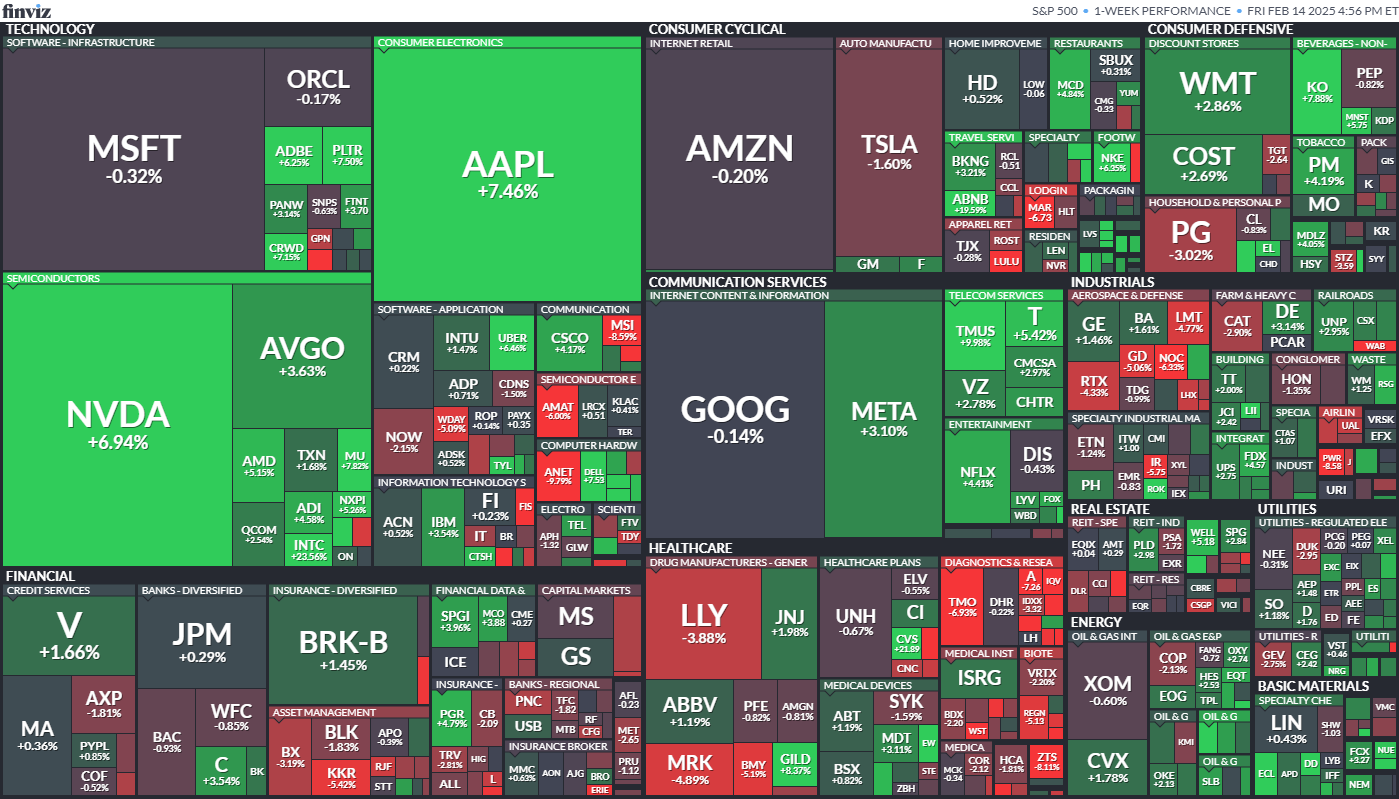
2. S&P 500 Top & Worst Performers
Over the last five trading days, 55% of the stocks in the S&P 500 index rose in value.
Top Performers:
$SMCI (Super Micro Computer Inc): 32.1%
$INTC (Intel Corp): 23.6%
$CVS (CVS Health Corp): 21.9%
$ABNB (Airbnb Inc): 19.6%
$MGM (MGM Resorts International): 15.2%
Worst Performers:
$ANET (Arista Networks Inc): -9.8%
$IRM (Iron Mountain Inc): -10%
$ZBRA (Zebra Technologies Corp): -12.4%
$GDDY (Godaddy Inc): -13.8%
$FIS (Fidelity National Information Services, Inc): -17.3%
In addition, 49 stocks within the S&P 500 reached a new 52-week high, while 35 stocks set new lows. The majority of this week’s highs came from the Technology sector.
Notable Highs:
$META (Meta Platforms Inc)
$WMT (Walmart Inc)
$V (Visa Inc)
$COST (Costco Wholesale Corp)
$NFLX (Netflix Inc)
Notable Lows:
$MRK (Merck & Co Inc)
$DHR (Danaher Corp)
$GD (General Dynamics Corp)
$DHI (D.R. Horton Inc)
$F (Ford Motor Co)

MARKET MOMENTUM
1. Momentum Review
To evaluate the market's current health, I examine 4 key elements: performance, breadth, trends, and key levels. Healthy bull markets typically feature indices setting new highs, broad market participation, and ascending trend lines.
Performance (POSITIVE 🟢): evaluating recent market performance to gauge the momentum’s strength. Ideally i want to see returns accelerating short-term and index trading less than 5% from its 1-year high
1-month performance: +2.9% 🟢
3-month performance: +2.1% 🟢
vs. 1-year high: -0.2% 🟢
Breadth (MIXED 🟡): assessing market participation to understand the health of the trend. Extreme levels (above 80% or below 20%) may indicate overextended trends.
% of stocks above 200-day moving average: 57% (down from 59% last week) 🟡
% of stocks above 20-day moving average: 54% (down from 48% last week) 🟡
Trends: analyzing trend strength across multiple timeframes using exponential moving averages, scored on a scale of 1 to 5. A score of 3 or above suggests solid trends and supports holding a position.
Weekly chart: STRONG ⭐️⭐️⭐️⭐️⭐️

Daily chart: SOLID ⭐️⭐️⭐️⭐️

4-hour chart: SOLID ⭐️⭐️⭐️⭐️

Key levels: identifying critical price zones to confirm the current trend or signal a potential reversal.
Support:
$6,050 (-1.1%)
$6,000 (-1.9%)
$5,960 (-2.5%)
Resistance:
$6,130 (+0.3%)
$6,250 (+2.2%)
$6,370 (+4.2%)
Enjoying the analysis so far? There’s so much more in the paid version, where I cover 70+ stocks and ETFs every month. Subscribe now to learn how I connect strategy to insights and, ultimately, portfolio decisions.
2. Post of the Week
This week's momentum analysis is about the Semiconductor sector. Using a combination of performance metrics and technical indicators, I've developed a proprietary algorithm to rank 10 semis stocks. Based on this approach, I've identified Broadcom and TSM as having the best relative momentum currently.
EARNINGS & ECONOMIC REPORTS RECAP
1. Earnings Outlook
Q4 Earnings: S&P 500 earnings are expected to grow by 15%, rising to 19% when excluding the energy sector.
2025 Full-Year Outlook: Earnings are expected to increase by 11%, above the 10-year average growth of 9%.
Analyst Revisions: Over the past month, 43% of all earnings revisions by analysts have been upward adjustments to their outlook.
Valuation: The forward 4-quarter P/E ratio stands at 22.6, above the 5-year and 10-year historical averages.

2. Earnings Season Recap
Out of 383 S&P 500 companies that have reported fourth-quarter earnings, 74% exceeded EPS expectations. It is below with the four-quarter average of 78% but above the historical average of 67%.
Below are some notable companies that reported earnings last week. I’ve highlighted their EPS and revenue performance vs estimate, as well as their stock return this week.
Notably, Coca-Cola was a standout performer, beating both earnings and Revenue expectations, while the stock returned 8% last week.

3. Economic Reports
It was a disappointing week on most fronts, with hot inflation numbers and weaker-than-expected retail sales raising concerns about the resilience of consumer spending and potential Fed policy implications.
CPI (January): Inflation came in hotter than expected, with Core CPI rising 0.4% MoM (vs. 0.3% expected), and headline CPI increasing 0.5% MoM, reinforcing concerns that price pressures remain sticky.
PPI (January): Producer prices also exceeded expectations at +0.4% MoM, further adding to inflation worries.
Retail Sales (January): A major disappointment, with core retail sales falling -0.4% (vs. +0.3% expected) and overall retail sales dropping -0.9%, raising questions about consumer strength.

MARKET SENTIMENT
Measures of investor sentiment can be helpful as they provide insight into the views and opinions of professional or individual investors. While not definitive predictors of market direction, these measures can serve as a valuable complement to other indicators and analysis tools, helping to paint a more comprehensive picture of the market's current state.
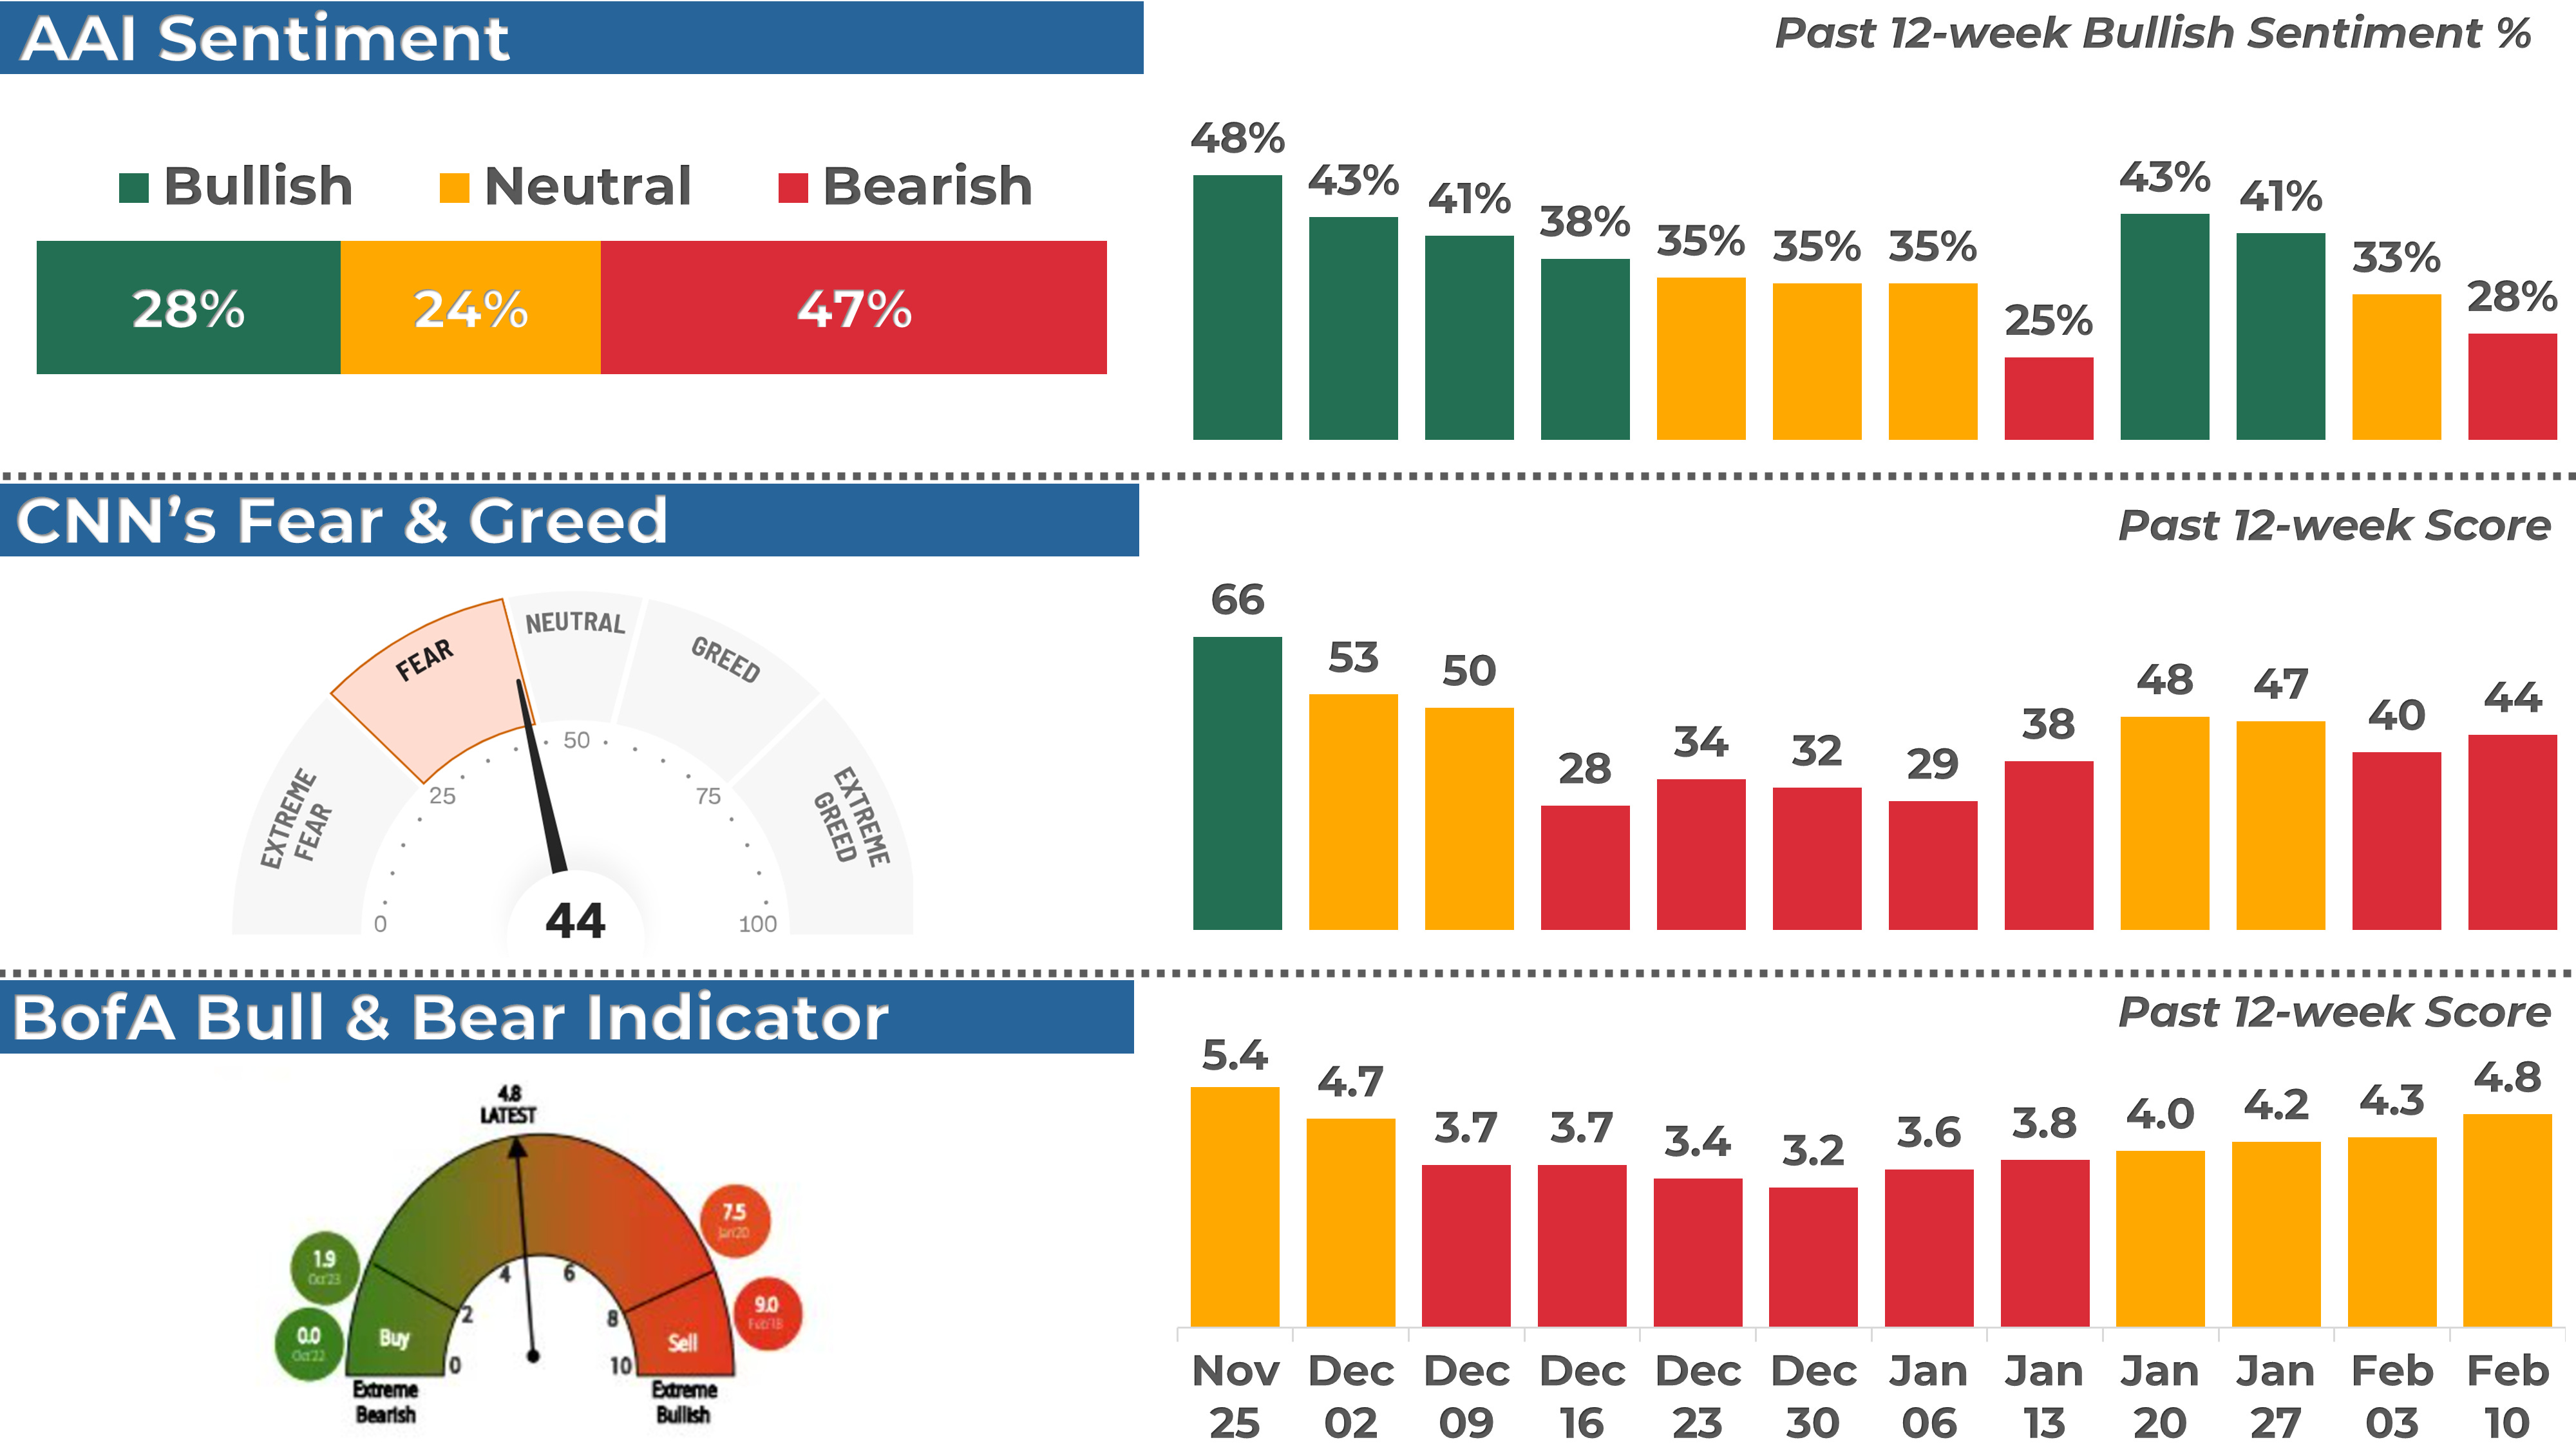
1. AAII Sentiment Survey (Individual Investors)
The American Association of Individual Investors (AAII) conducts a weekly survey to gauge members' expectations for the stock market over the next six months. Results are published every Wednesday.
In the latest survey, 28% of respondents had a bullish outlook, down from 33% the previous week.
2. BofA Bull & Bear Indicator (Institutional Investors)
The Bank of America Bull-Bear Indicator measures investor sentiment based on fund managers' and institutional investors' views. Scores range from 0 (extremely bearish) to 10 (extremely bullish).
The most recent reading was 4.8, a neutral sentiment.
3. CNN Fear & Greed Index (Technical)
This daily measure analyzes seven indicators to assess how emotions drive market decisions. Scores range from Extreme Fear to Extreme Greed.
The index closed at 44 (Fear), up from 40 last Friday.
THE WEEK AHEAD
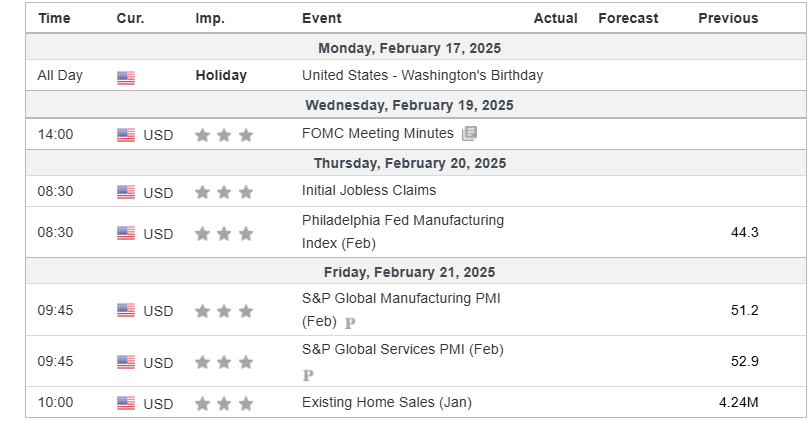
1. Economic Calendar
It will be a shortened trading week as U.S. markets will be closed on Monday for Washington’s Birthday.
Key reports to watch include:
FOMC Meeting Minutes (Wednesday): Investors will look for any clues on the Fed’s interest rates and inflation outlook.
PMI Data (Friday): The latest S&P Global Manufacturing and Services PMI readings will provide insights into economic activity and business conditions.
With limited economic releases, market attention will likely remain on broader macro trends and earnings reports.
2. Earnings Calendar
Earnings season continues next week, and 43 companies from the S&P 500, including Walmart and Booking Holdings, are expected to release their quarterly results.
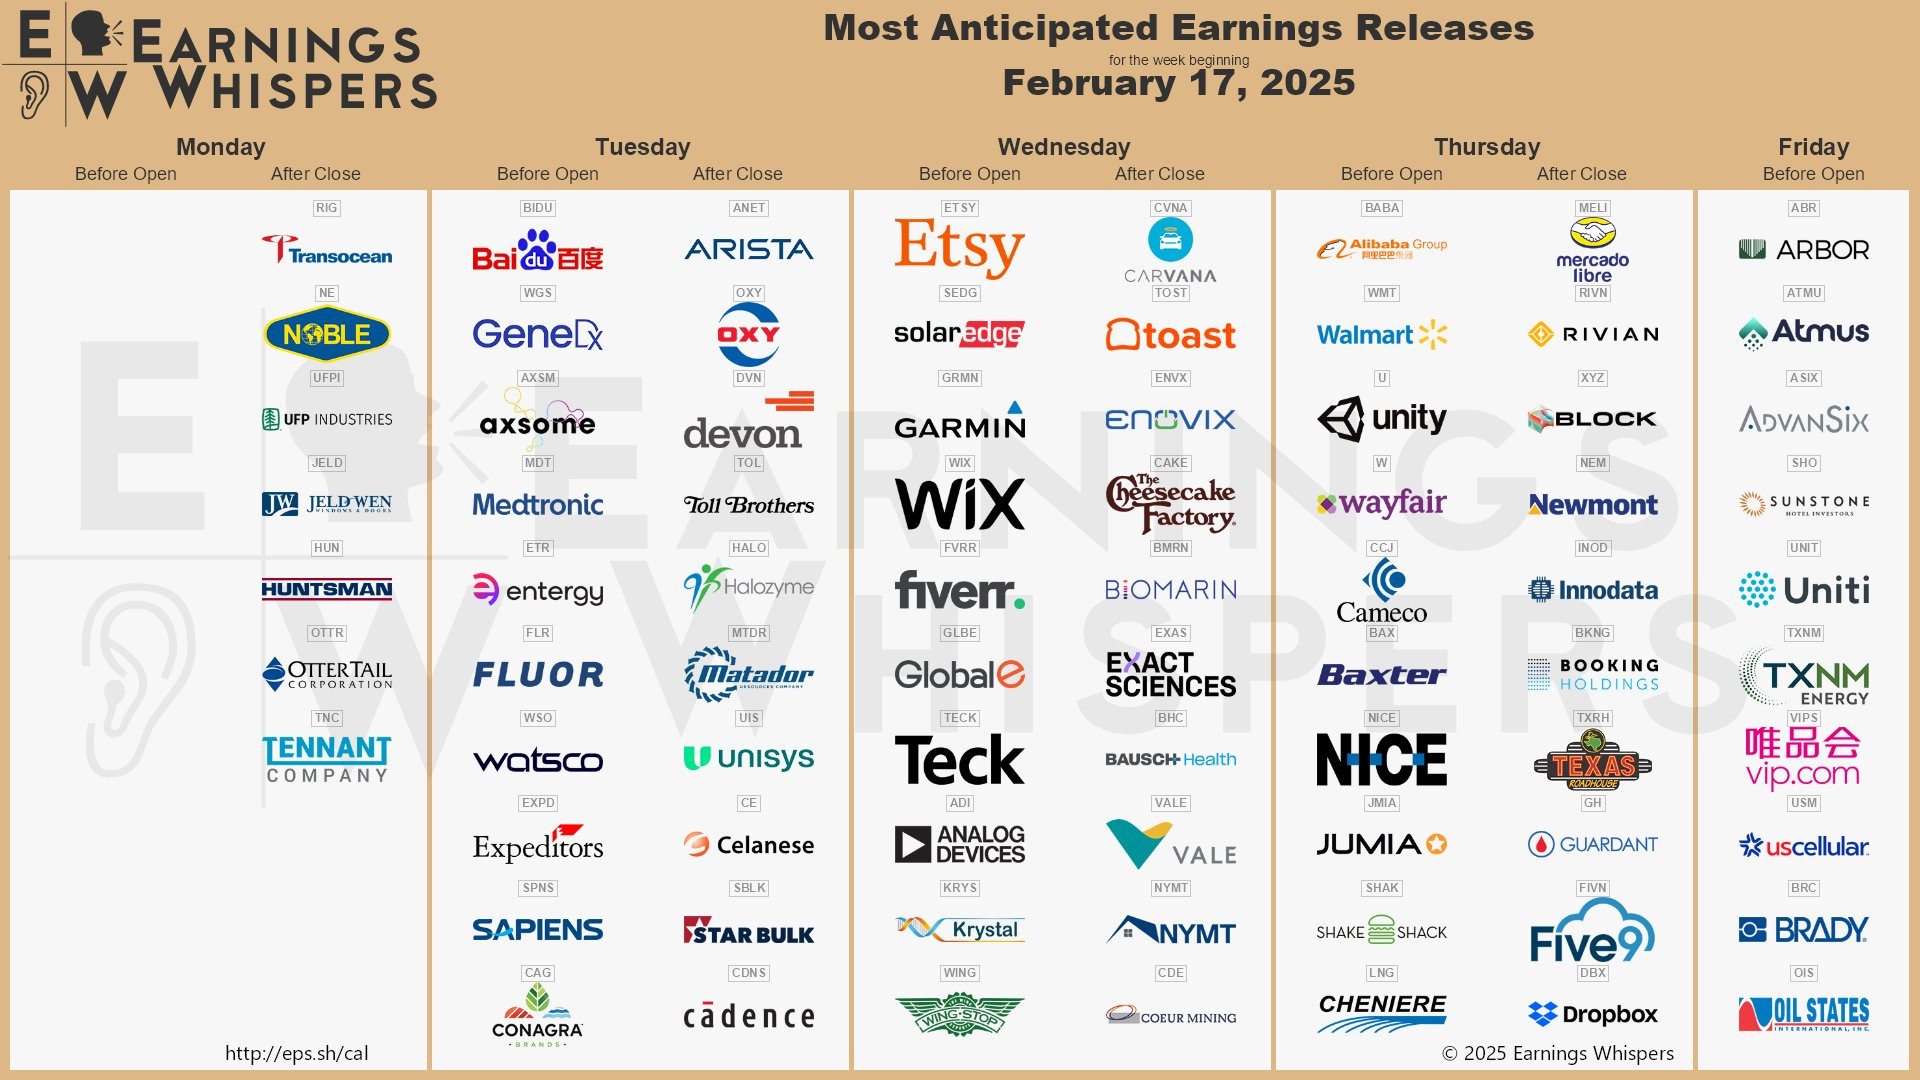
Below are notable stocks reporting earnings next week, along with several key indicators I like to monitor:
Stock Indicators:
3-Month Performance: Assessing recent stock trends.
RSI (Relative Strength Index): A reading above 70 suggests overbought conditions, while below 30 indicates oversold.
P/E Ratio: A value below 25 often points to a "cheap" valuation or low growth expectations.
Stock Price Reactions to Earnings:
1-Day Stock Return on Earnings: How the stock performs on its earnings release day.
Implied Volatility: The options market's forecast for the expected 1-day stock move after earnings.
In particular, Walmart heads into earnings on a hot streak, with the stock up 21% over the last three months. Its RSI of 70 is nearing overbought territory, signaling strong momentum but raising whether the rally can continue.
The market has received recent earnings reports well. However, with high expectations, can the retail giant deliver another strong quarter?

3. Stock Analysis of the Week
Every week, I share my analysis of 1 stock that has reported earnings in recent weeks, focusing on implications for long-term investors. This week, I prepared an analysis of Palantir Technologies ($PLTR).
👨💻 My View: HOLD
Palantir continues to skyrocket, almost doubling in value in the past quarter. While the momentum remains incredibly strong, we are far beyond the 9-week EMA, a typical support line. It suggests a cooling-off period may be needed to digest recent gains.
If you own $PLTR—congrats! Enjoy the ride while it lasts, but remember, taking some profits along the way never hurts.
If you don’t own it yet—this is likely one of the worst times to enter. Chasing at these levels could be risky, and a better entry opportunity may arise on the next pullback.
Check out the post for more details about $PLTR performance, trend and key levels.
4. Subscribers Poll:
CONCLUSION
Thank you for reading my Weekly Market Recap, which, I hope, got you ready for the week ahead.
If you want to take your investing journey to the next level, consider upgrading to a paid subscription. Subscribe now and learn more about my holistic, end-to-end momentum approach to investing.
Your first month is free, so this is the perfect opportunity to explore the full value of My Weekly Stock at no risk!
Thanks again, and I look forward to sharing my market recap with you next week.
Happy investing!
My Weekly Stock
DISCLAIMER
The information provided in this newsletter is for informational purposes only and should not be taken as financial advice. Any investments or decisions made based on the information provided in this newsletter are the reader's sole responsibility. We recommend that readers conduct their own research and consult a qualified financial professional before making investment decisions. The author does not assume any responsibility for any losses or damages arising from using the information provided in this newsletter.
Thanks for compiling, appreciate this recap.