


Weekly Market Recap (Feb 17-21): Markets Retreat From Highs on Economic Worries – Stuck in Chop Mode?
Everything you need to know about last week's markets performance and what to expect next.
Dear readers,
Welcome back to My Weekly Stock, where in-depth market analysis meets proven momentum-based trading strategies. My mission? To help you win in the markets with unbiased, data-driven insights you can act on.
Friday means it's time to review the week in the markets. Each week, I dedicate hours to curating this market recap, preparing insightful analysis with clear visuals and a structured layout—making it easy for you to find exactly what you need, week after week. And because it's easy to get swayed by personal bias, I like to let the data do most of the talking.
If you want the full experience, consider upgrading your subscription. As a paid subscriber, you'll gain access to my 3 winning portfolios—and so much more: a clear investing framework, my momentum-based analysis, and live portfolio updates
Plus, as a token of my appreciation, your first month is FREE. If you're ready to give it a try—or simply want to support my work—this is your chance!
Let's dive in!
SUMMARY
Here are this week's highlights and what to look out for next:
1. The markets were negative this week, with the S&P 500 down -1.7%, the Nasdaq -2.5%, and the Dow Jones -2.5%. Consumer Defensive (+2%) and Utilities (+1.5%) were the best-performing sectors.
2. The S&P 500's long-term trend is positive, and the short-term momentum is mixed. 6,130 is the next resistance, while 6,000 is support.
3. The Q4 earnings season is well under way and 425 companies from the S&P 500 index have released their quarterly results, with 76% beating estimates. Earnings are expected to be up 16% in Q4 2024 and 11% in 2025.
4. Market sentiment is at the "Fear" level (36) as measured by CNN’s Fear & Greed indicator, while VIX is at a medium value of 18.
5. Earnings reports from Nvidia and Home Depot, and the PCE inflation report are scheduled for next week.
My take:
We closed another frustrating week for the market, which started on a strong note with a new all-time high but finished sourly. Concerns over the economy, sparked by Walmart's guidance and weak consumer sentiment readings, weighed on sentiment. While the S&P500 is just 2% away from its highs, the damage was more pronounced in economically sensitive stocks, particularly financials.
We have been stuck in a large consolidation range since December, and to confirm that this phase is behind us, we need a firm and sustained breakout above 6,150. Unfortunately, there was no follow-through after this week's new high, dragging us back into choppy waters. And if the long-term trend remains intact, the first few months of 2025 have made it clear that this year is unlikely to be a smooth ride.

PERFORMANCE RECAP
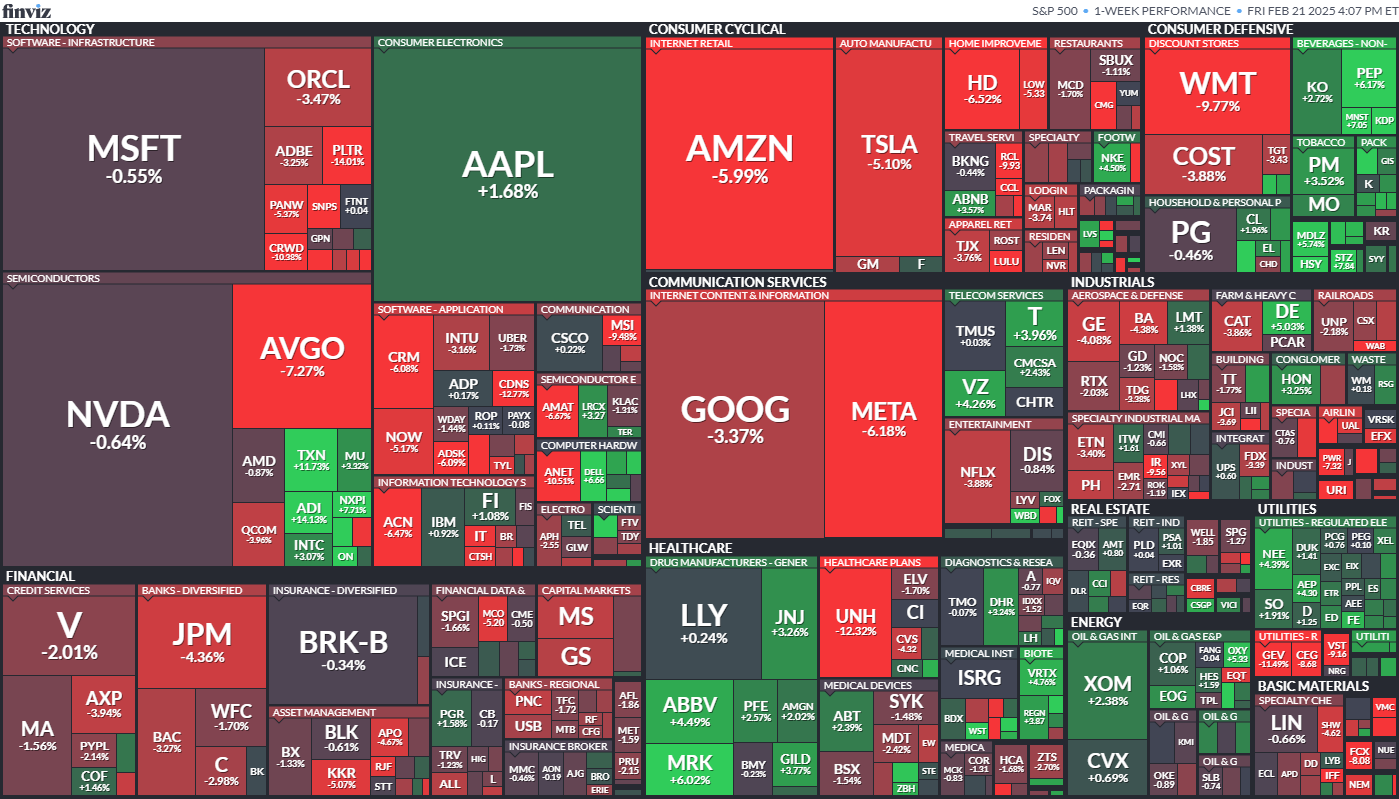
1. S&P 500 Sector Performance
This week, 5 out of the 11 S&P 500 sectors posted gains. Consumer Defensive led the market with a 2% increase, while Consumer Cyclical was the laggard, dropping 3.8%.
Year-to-date, 10 sectors have achieved positive performance. Health Care is the top-performing sector with a 6.4 % gain, while Consumer Cyclical lags behind, with a 2.7 % loss.

2. S&P 500 Top & Worst Performers
Over the last five trading days, 43% of the stocks in the S&P 500 index rose in value.
Top Performers:
$SMCI (Super Micro Computer Inc): 32.6%
$ADI (Analog Devices Inc): 14.1%
$WYNN (Wynn Resorts Ltd): 12.8%
$MCHP (Microchip Technology, Inc): 12.6%
$HAS (Hasbro, Inc): 12.1%
Worst Performers:
$GDDY (Godaddy Inc): -18.2%
$CE (Celanese Corp): -19.2%
$DVA (DaVita Inc): -19.6%
$EPAM (EPAM Systems Inc): -22%
$AXON (Axon Enterprise Inc): -22.8%
In addition, 46 stocks within the S&P 500 reached a new 16-week high, while 16 stocks set new lows. The majority of this week’s highs came from the Technology sector.
Notable Highs:
$JPM (JPMorgan Chase & Co)
$V (Visa Inc)
$PLTR (Palantir Technologies Inc)
$PM (Philip Morris International Inc)
$ABT (Abbott Laboratories)
Notable Lows:
$MRK (Merck & Co Inc)
$DHI (D.R. Horton Inc)
$LHX (L3Harris Technologies Inc)
$LEN (Lennar Corp)
$GIS (General Mills, Inc)

MARKET MOMENTUM
1. Momentum Review
To evaluate the market's current health, I examine 4 key elements: performance, breadth, trends, and key levels. Healthy bull markets typically feature indices setting new highs, broad market participation, and ascending trend lines.
Performance (MIXED 🟡): evaluating recent market performance to gauge the momentum’s strength. Ideally i want to see returns accelerating short-term and index trading less than 5% from its 1-year high
1-month performance: -1.1% 🟡
3-month performance: +2.0% 🟢
vs. 1-year high: -2.2% 🟢
Breadth (MIXED 🟡): assessing market participation to understand the health of the trend. Extreme levels (above 80% or below 20%) may indicate overextended trends.
% of stocks above 200-day moving average: 59% (up from 57% last week) 🟡
% of stocks above 20-day moving average: 45% (down from 54% last week) 🟡
Trends: analyzing trend strength across multiple timeframes using exponential moving averages, scored on a scale of 1 to 5. A score of 3 or above suggests solid trends and supports holding a position.
Weekly chart: STRONG ⭐️⭐️⭐️⭐️

Daily chart: MIXED ⭐️⭐️

4-hour chart: WEAK ⭐️
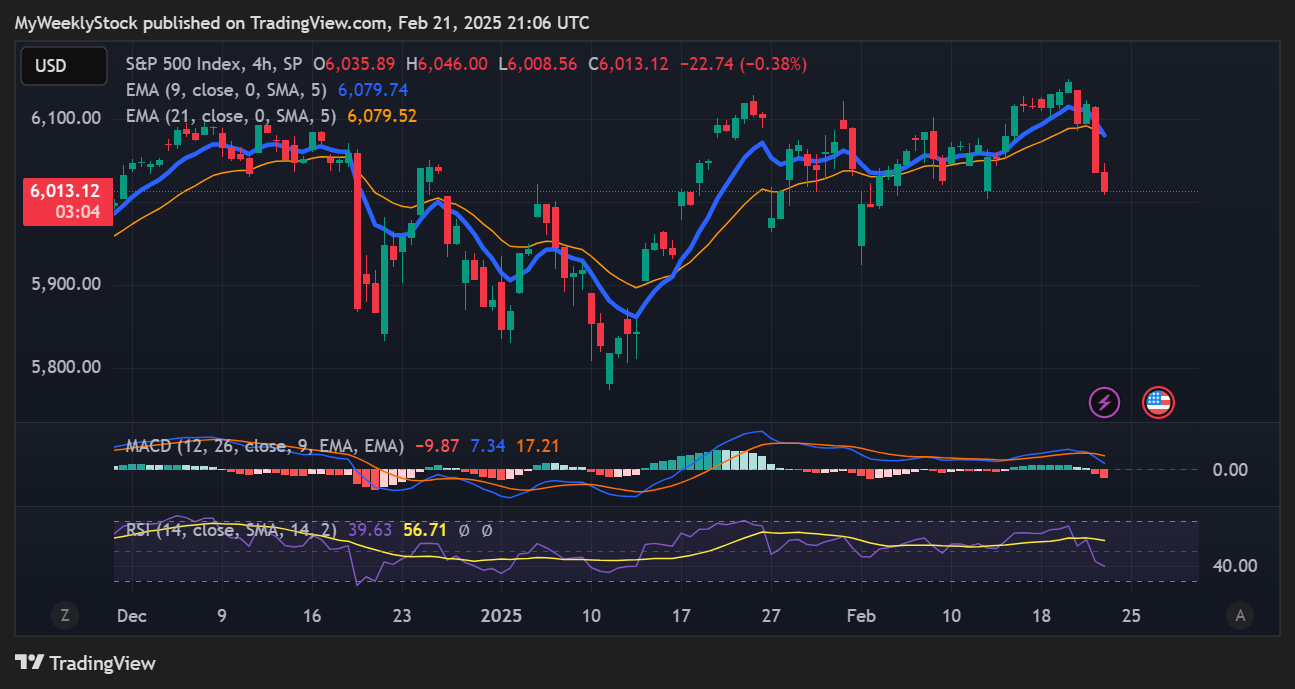
Key levels: identifying critical price zones to confirm the current trend or signal a potential reversal.
Support:
$6,000 (-0.2%)
$5,960 (-0.9%)
$5,830 (-3.0%)
Resistance:
$6,150 (+2.3%)
$6,200 (+3.1%)
$6,370 (+5.9%)
Enjoying the analysis so far? There’s so much more in the paid version, where I cover 70+ stocks and ETFs every month. Subscribe now to learn how I connect strategy to insights and, ultimately, portfolio decisions.
2. Post of the Week
This week's momentum analysis is about the S&P 500 sectors. Using a combination of performance metrics and technical indicators, I've developed a proprietary algorithm to rank 11 sectors. Based on this approach, I've identified Communication Services and Financials as having the best relative momentum currently.
EARNINGS & ECONOMIC REPORTS RECAP
1. Earnings Outlook
Q4 Earnings: S&P 500 earnings are expected to grow by 16%, rising to 19% when excluding the energy sector.
2025 Full-Year Outlook: Earnings are expected to increase by 11%, above the 10-year average growth of 9%.
Analyst Revisions: Over the past month, 43% of all earnings revisions by analysts have been upward adjustments to their outlook.
Valuation: The forward 4-quarter P/E ratio stands at 22.6, above the 5-year and 10-year historical averages.

2. Earnings Season Recap
Out of 425 S&P 500 companies that have reported fourth-quarter earnings, 76% exceeded EPS expectations. It is slightly below with the four-quarter average of 78% but above the historical average of 67%.
Below are some notable companies that reported earnings last week. I’ve highlighted their EPS and revenue performance vs estimate, as well as their stock return this week.
One highlight of the week was Walmart, which topped Revenues and EPS estimates. However, the somewhat softer guidance spooked investors, sending the stock 6% lower on Thursday and 10% for the week.

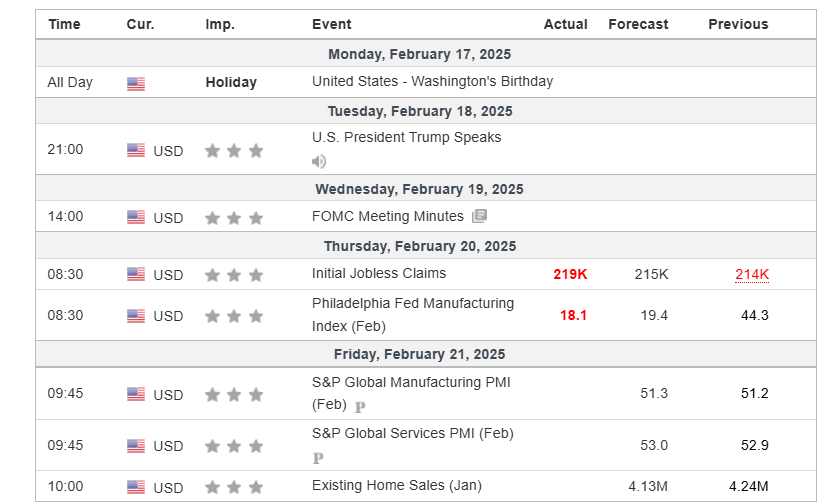
3. Economic Reports
It was a quiet week for markets, with the markets closed on Monday’s in observance of Presidents' Day holiday.
MARKET SENTIMENT
Measures of investor sentiment can be helpful as they provide insight into the views and opinions of professional or individual investors. While not definitive predictors of market direction, these measures can serve as a valuable complement to other indicators and analysis tools, helping to paint a more comprehensive picture of the market's current state.

1. AAII Sentiment Survey (Individual Investors)
The American Association of Individual Investors (AAII) conducts a weekly survey to gauge members' expectations for the stock market over the next six months. Results are published every Wednesday.
In the latest survey, 29% of respondents had a bullish outlook, up from 28% the previous week.
2. BofA Bull & Bear Indicator (Institutional Investors)
The Bank of America Bull-Bear Indicator measures investor sentiment based on fund managers' and institutional investors' views. Scores range from 0 (extremely bearish) to 10 (extremely bullish).
The most recent reading was 5.3, a neutral sentiment.
3. CNN Fear & Greed Index (Technical)
This daily measure analyzes seven indicators to assess how emotions drive market decisions. Scores range from Extreme Fear to Extreme Greed.
The index closed at 36 (Fear), down from 44 last Friday.
THE WEEK AHEAD
1. Economic Calendar
It will be a data-heavy week with key reports to watch include:
GDP (Q4, 2nd Estimate - Thursday): A key update on economic growth, with expectations for 2.3% annualized growth A weaker print could reinforce concerns about slowing momentum.
Core PCE Price Index (January - Friday): The Fed's go-to inflation metric, with the last reading being at 2.8% for the year-over-year inflation. Markets will closely monitor if inflation remains sticky, which could impact the Fed's future rate path.

2. Earnings Calendar
Earnings season continues next week, and 57 companies from the S&P 500, including Nvidia and Home Depot, are expected to release their quarterly results.
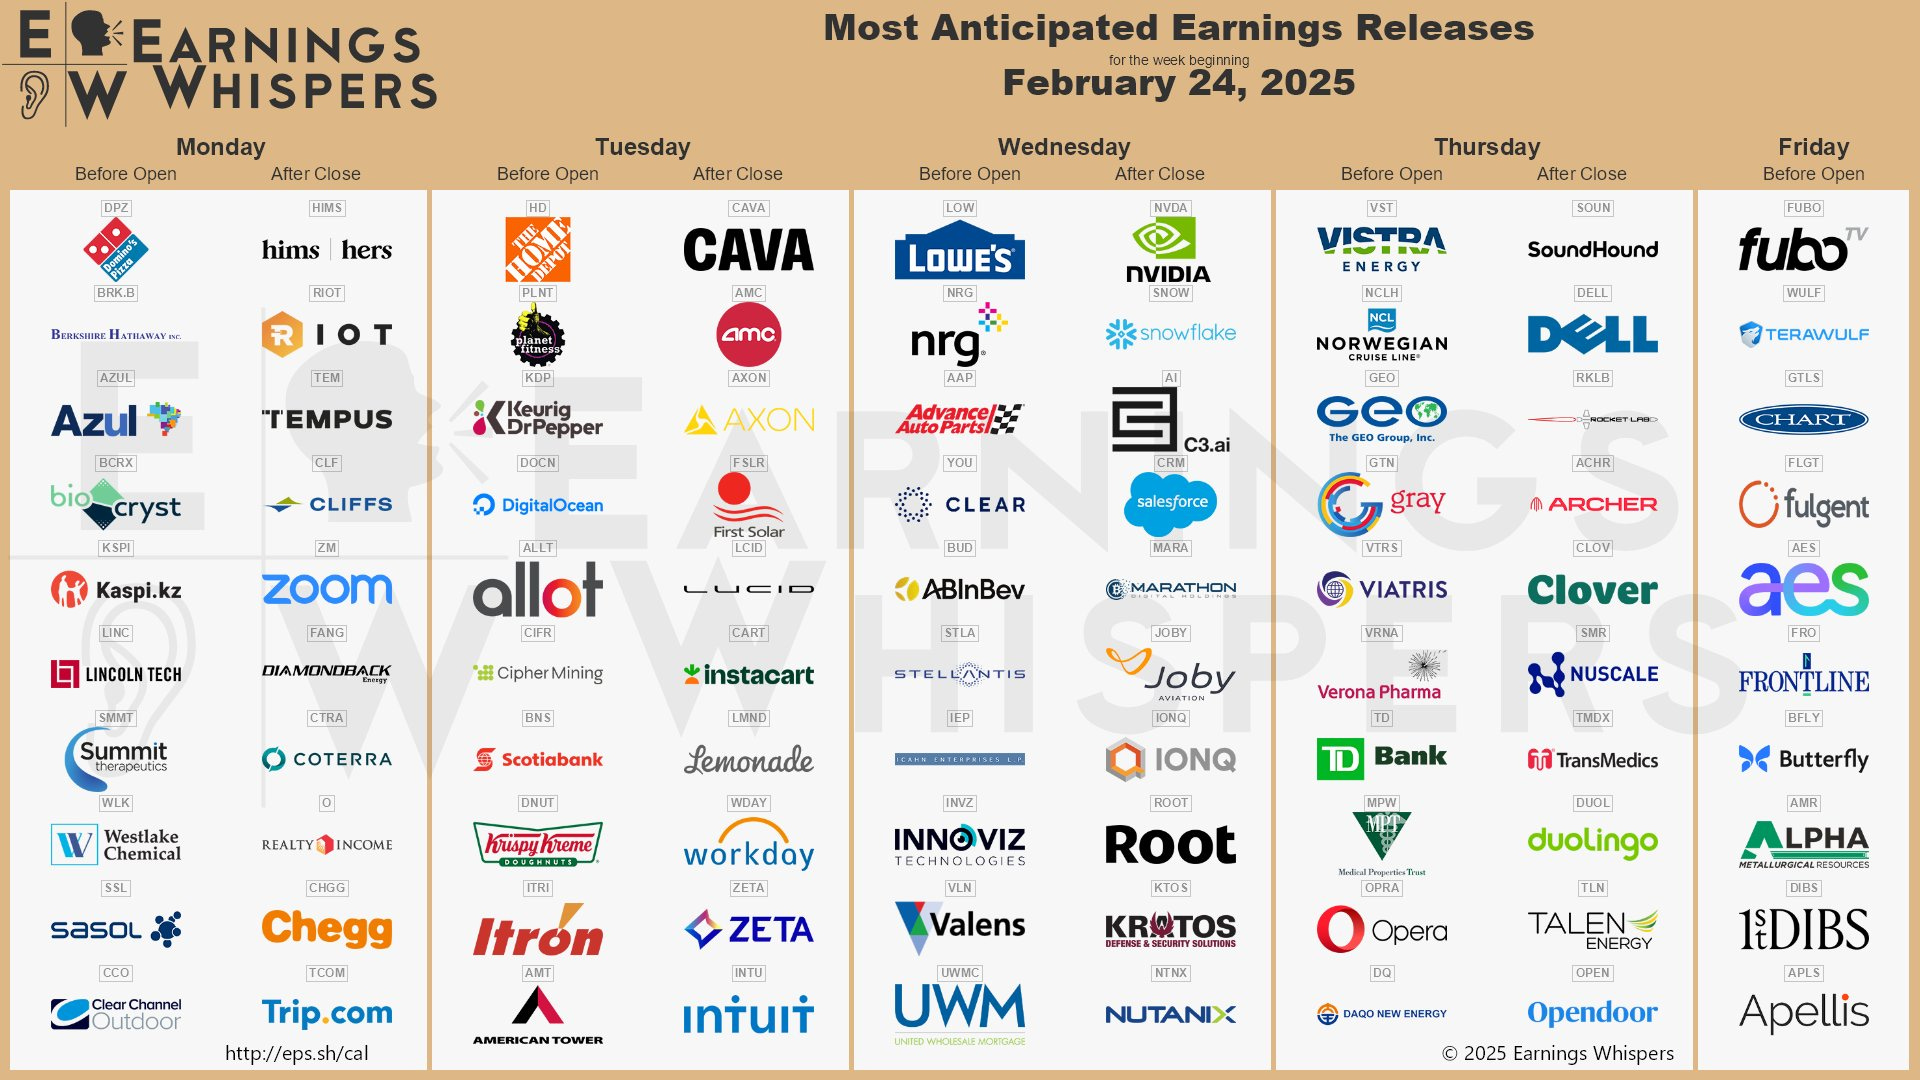
Below are notable stocks reporting earnings next week, along with several key indicators I like to monitor:
Stock Indicators:
3-Month Performance: Assessing recent stock trends.
RSI (Relative Strength Index): A reading above 70 suggests overbought conditions, while below 30 indicates oversold.
P/E Ratio: A value below 25 often points to a "cheap" valuation or low growth expectations.
Stock Price Reactions to Earnings:
1-Day Stock Return on Earnings: How the stock performs on its earnings release day.
Implied Volatility: The options market's forecast for the expected 1-day stock move after earnings.

3. Stock Analysis of the Week
Every week, I share my analysis of 1 stock that has reported earnings in recent weeks, focusing on implications for long-term investors. This week, I prepared an analysis of Booking Holdings ($BKNG).
👨💻 My View: HOLD
$BKNG has been in a strong uptrend for over two years. We saw a sizeable pullback recently that took us to the 30-week EMA, where buyers stepped in and the stock finally bounced. And yesterday's earnings report was well received by the market, reinforcing the stock's recovery.
Now, we must break above the $5,300 resistance to confirm the next leg higher and that the bullish cycle still has room to run.
Check out the post for more details about $BKNG performance, trend and key levels.
4. Subscribers Poll: Nvidia’s earnings.
CONCLUSION
Thank you for reading my Weekly Market Recap, which, I hope, got you ready for the week ahead.
If you want to take your investing journey to the next level, consider upgrading to a paid subscription. Subscribe now and learn more about my holistic, end-to-end momentum approach to investing.
Your first month is free, so this is the perfect opportunity to explore the full value of My Weekly Stock at no risk!
Thanks again, and I look forward to sharing my market recap with you next week.
Happy investing!
My Weekly Stock
DISCLAIMER
The information provided in this newsletter is for informational purposes only and should not be taken as financial advice. Any investments or decisions made based on the information provided in this newsletter are the reader's sole responsibility. We recommend that readers conduct their own research and consult a qualified financial professional before making investment decisions. The author does not assume any responsibility for any losses or damages arising from using the information provided in this newsletter.
$BKNG has bull flag makings possible $4595.91 to $4500 the lower end on monthly chart