


Weekly Market Recap (Feb 24-28): Markets Rally from Oversold Conditions – Will the Bounce Be Short-Lived?
Everything you need to know about last week's markets performance and what to expect next.
Dear readers,
Welcome back to My Weekly Stock, where in-depth market analysis meets proven momentum-based trading strategies. My mission? To help you win in the markets with unbiased, data-driven insights you can act on.
Friday means it's time to review the week in the markets. Each week, I dedicate hours to curating this market recap, preparing insightful analysis with clear visuals and a structured layout—making it easy for you to find exactly what you need, week after week. And because it's easy to get swayed by personal bias, I like to let the data do most of the talking.
If you want the full experience, consider upgrading your subscription. As a paid subscriber, you'll gain access to my 3 winning portfolios—and so much more: a clear investing framework, my momentum-based analysis, and live portfolio updates
Plus, as a token of my appreciation, your first month is FREE. If you're ready to give it a try—or simply want to support my work—this is your chance!
Let's dive in!
SUMMARY
Here are this week's highlights and what to look out for next:
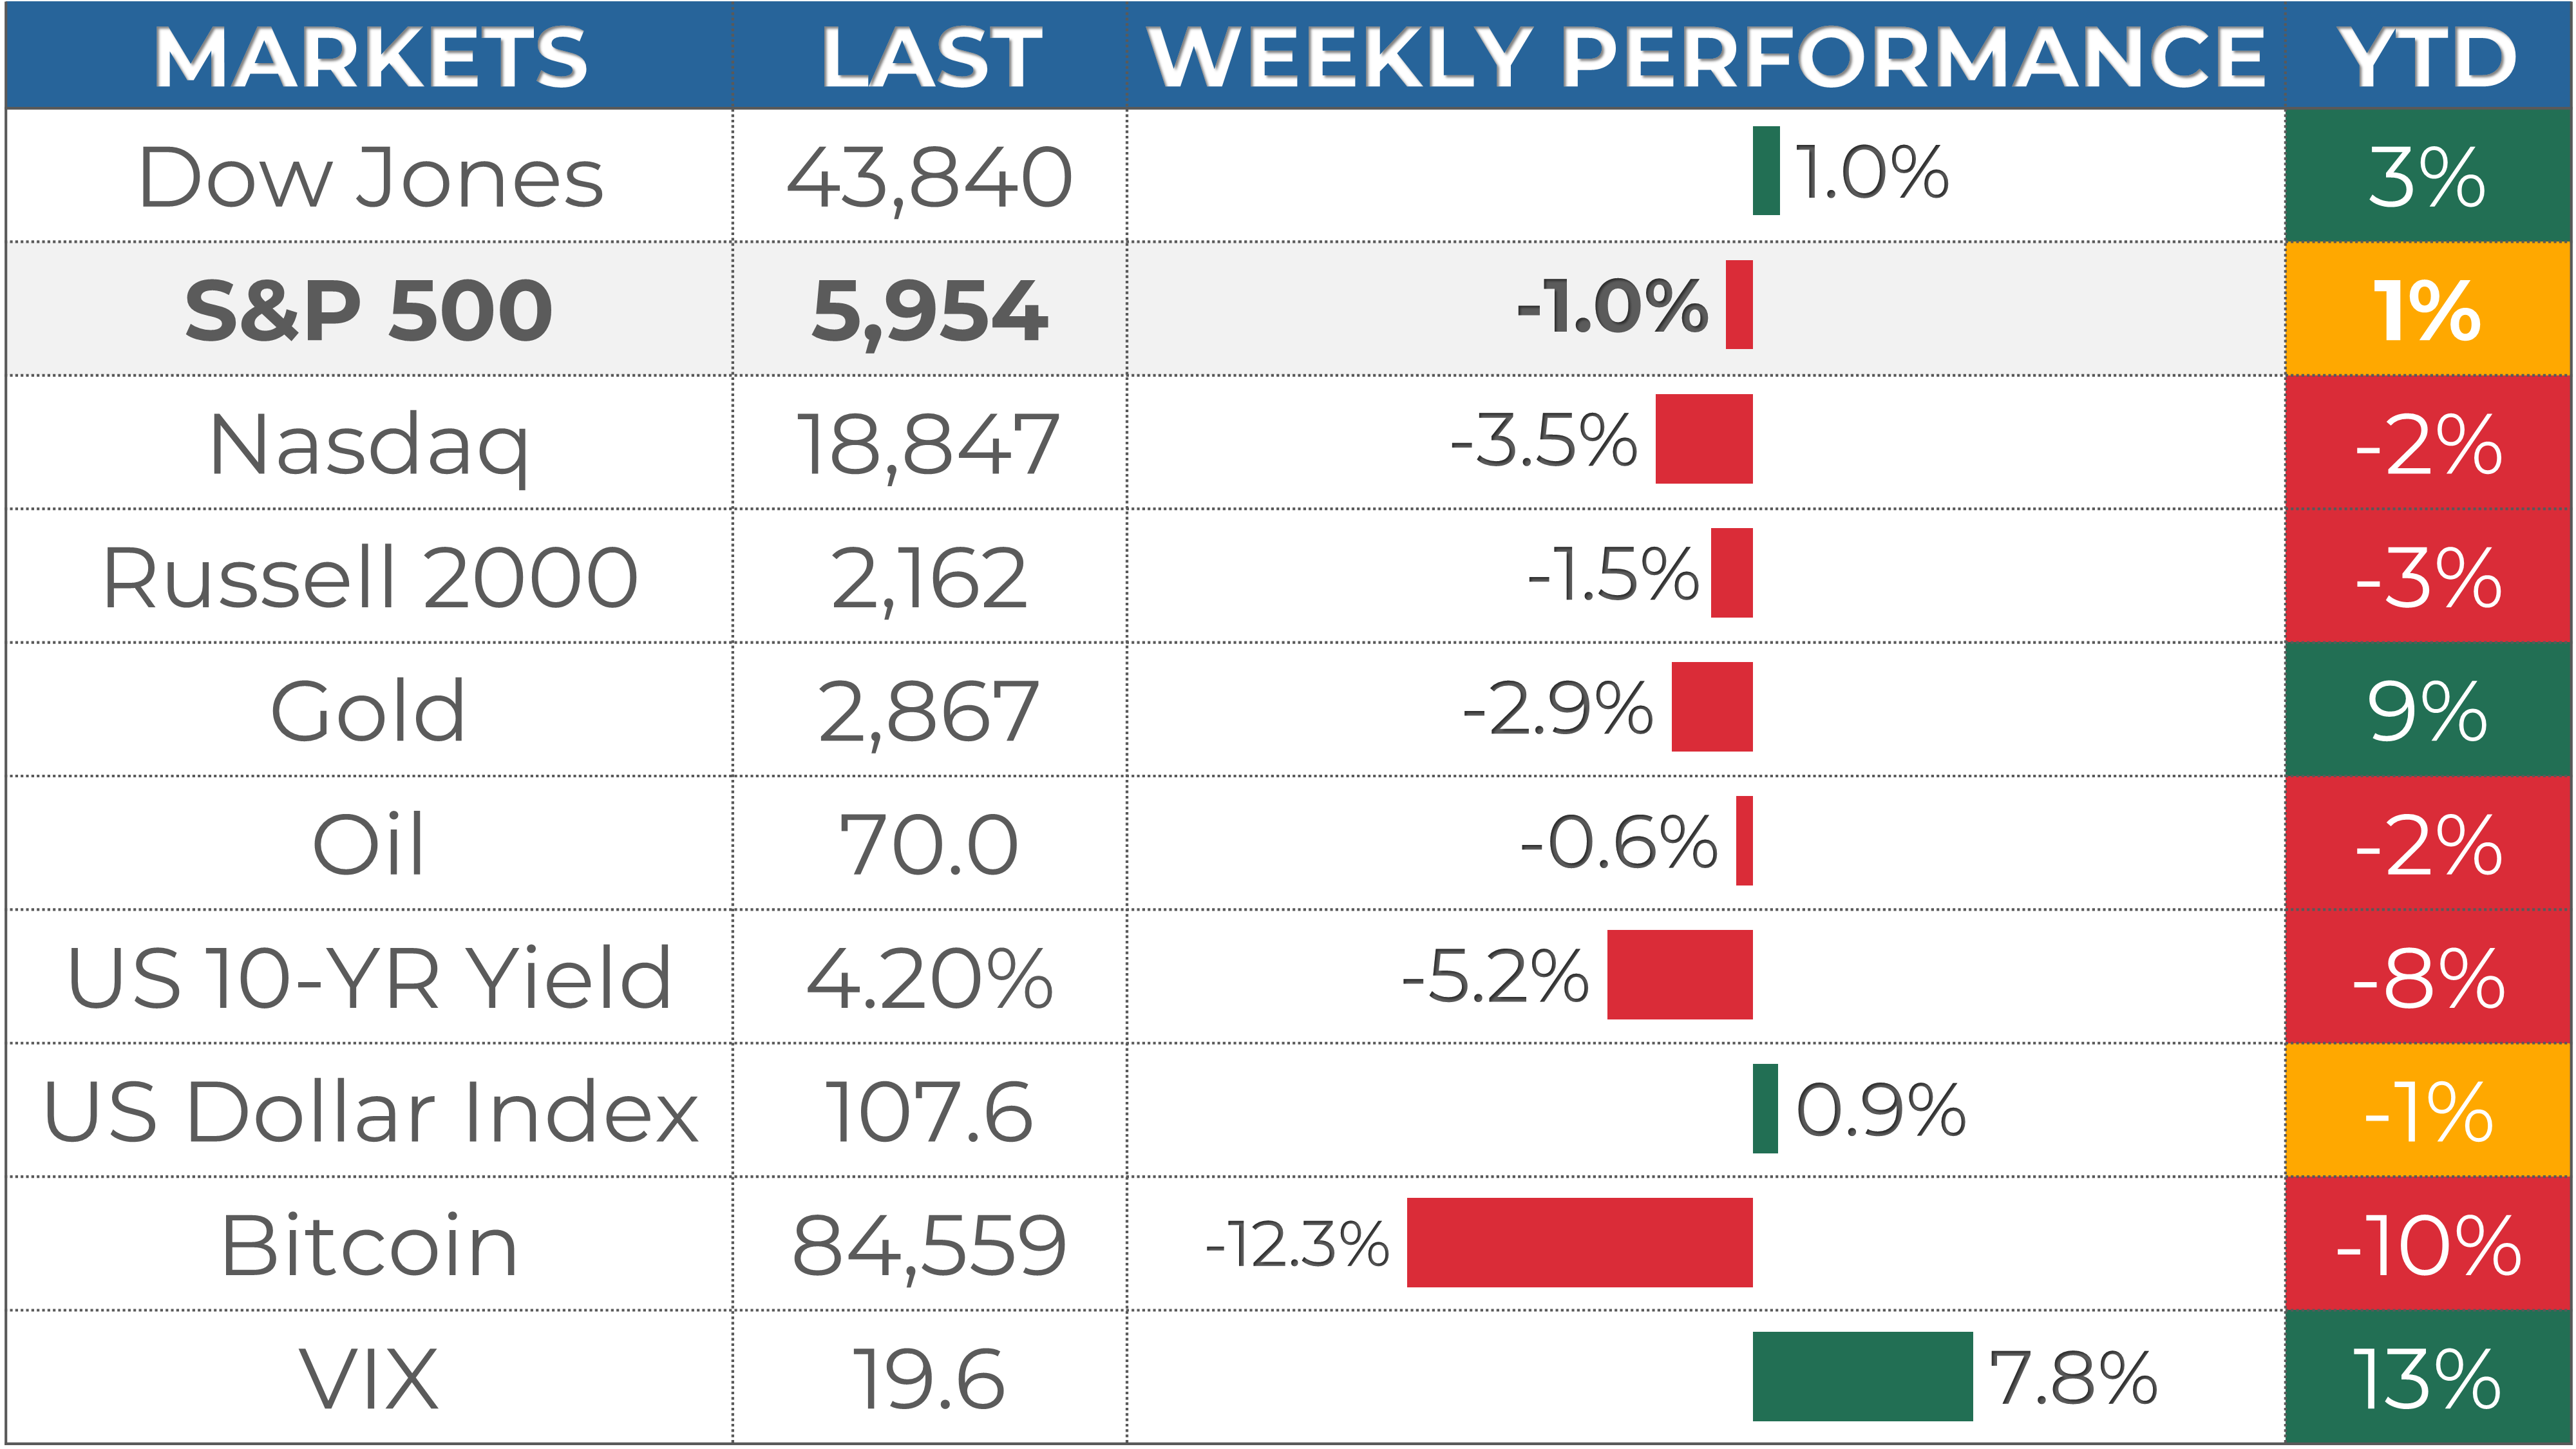
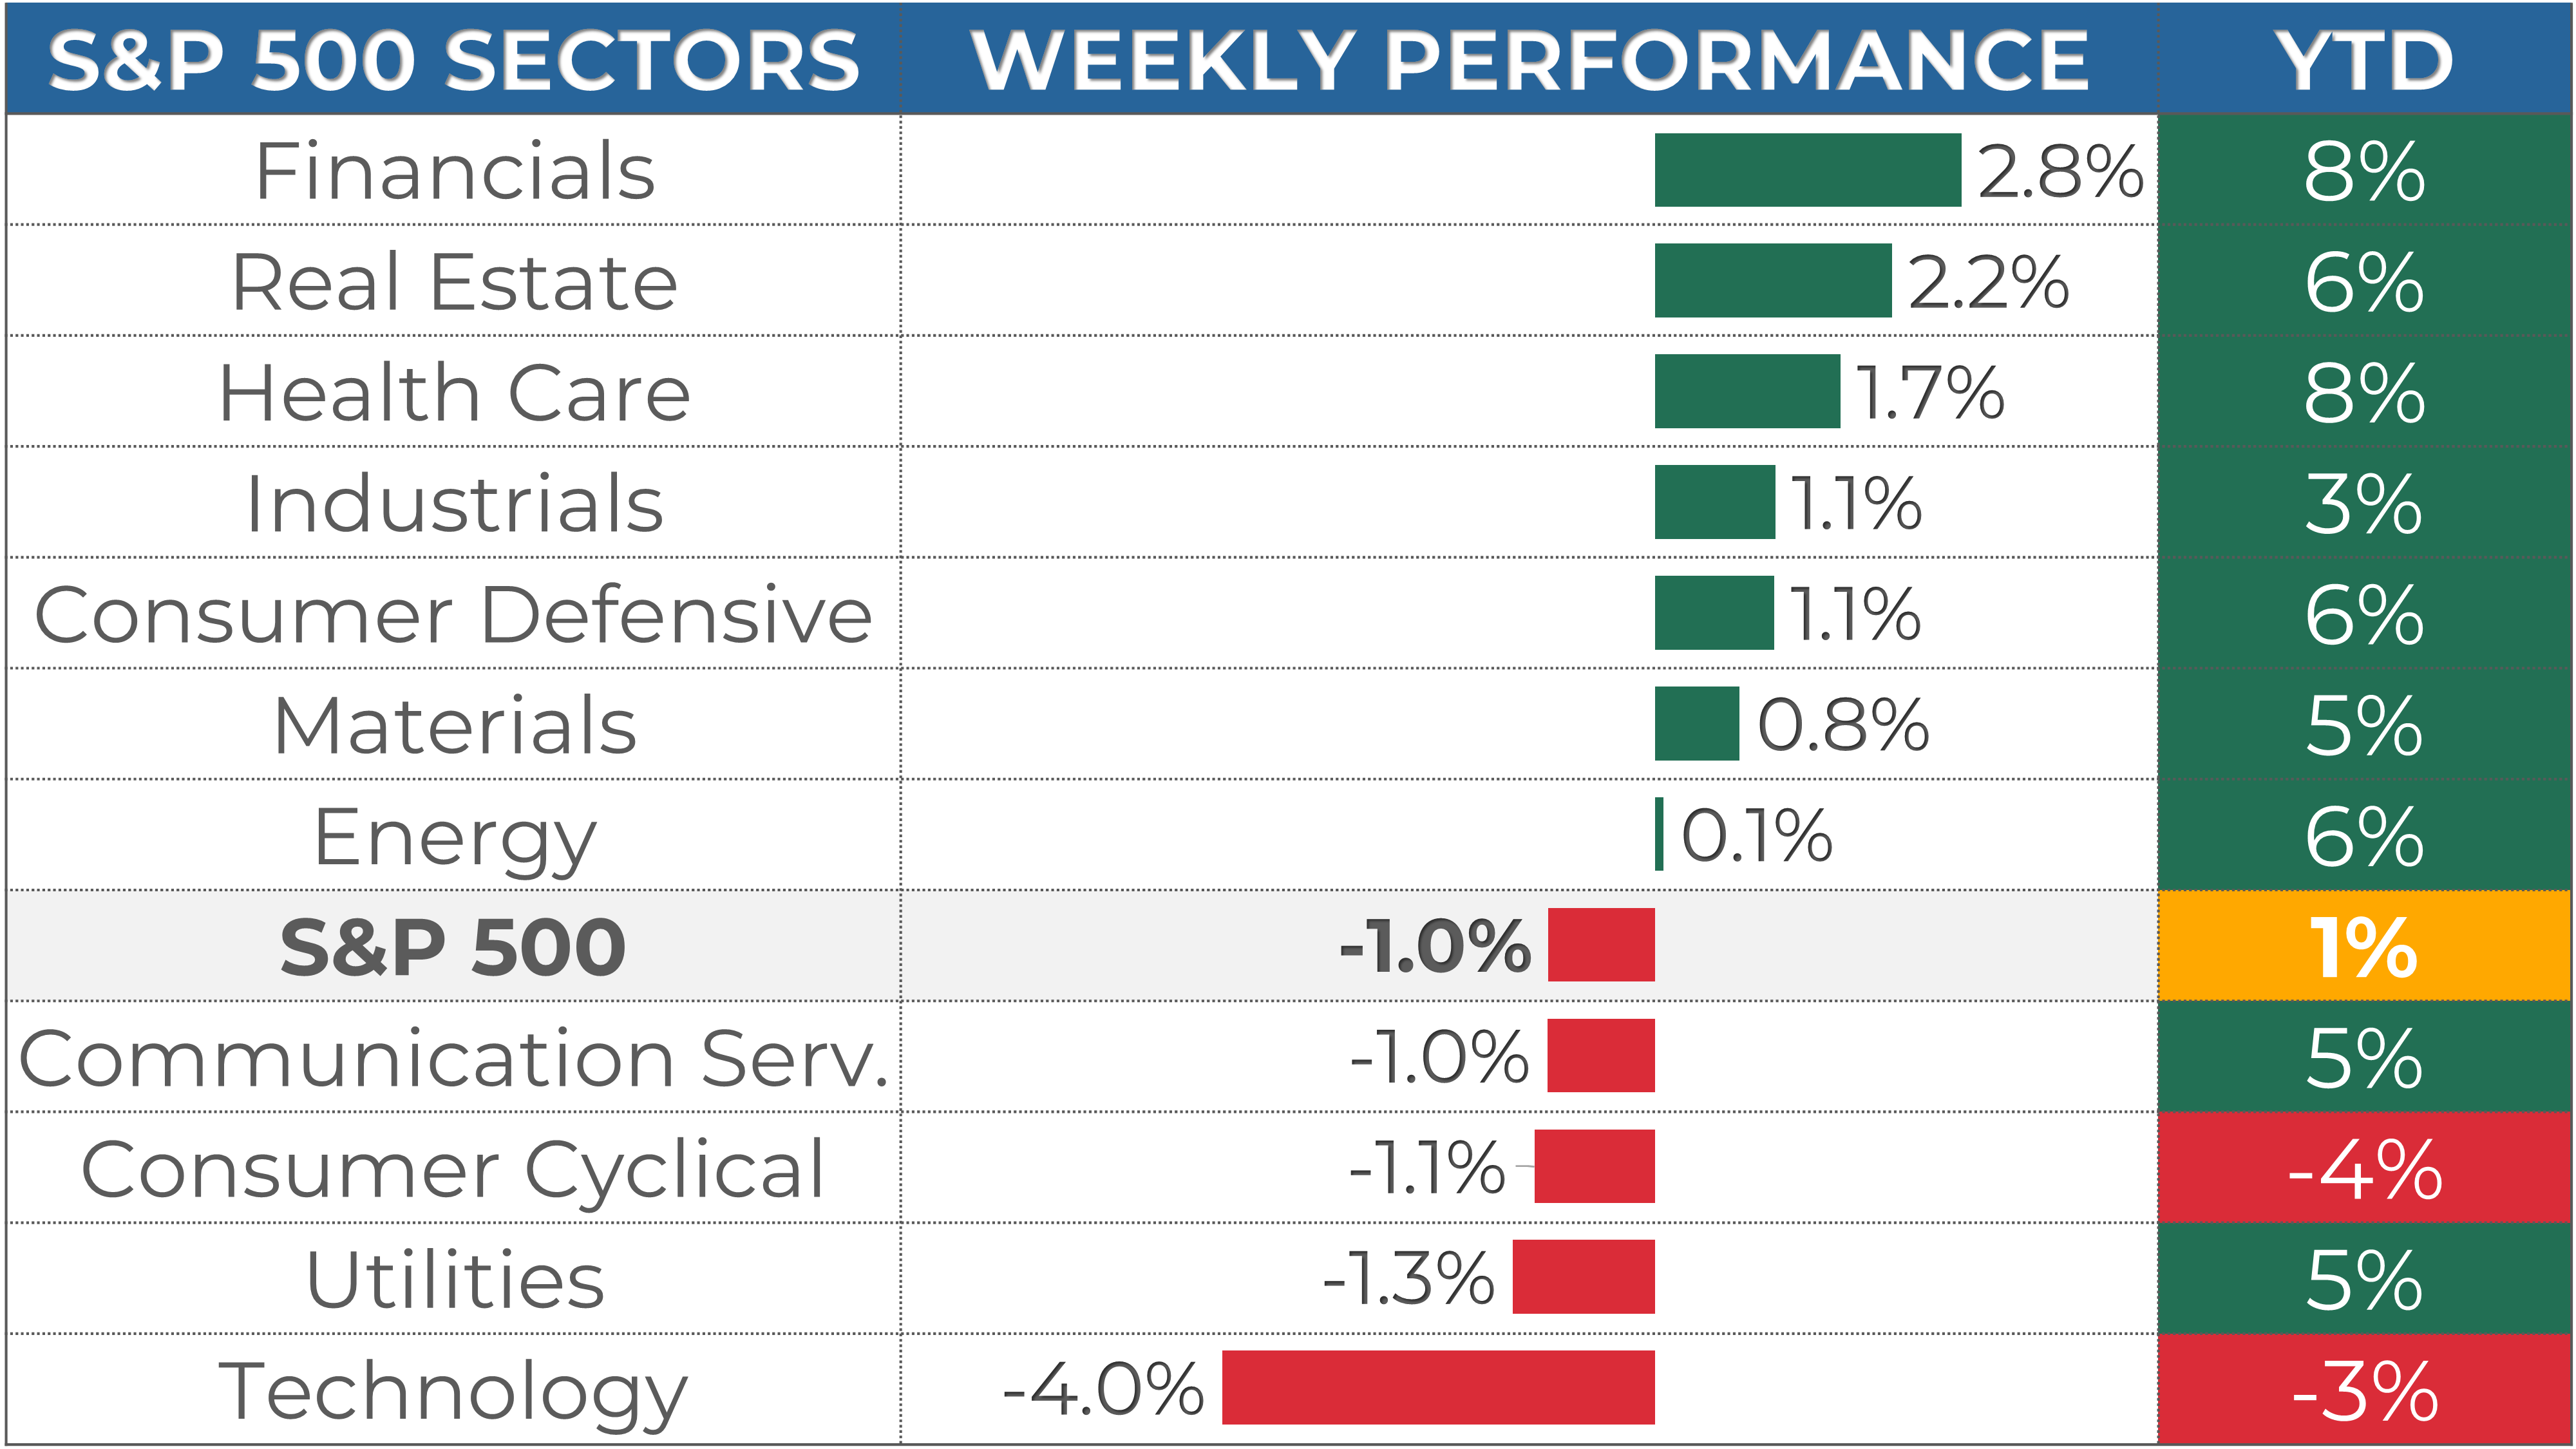
1. The markets were negative this week, with the S&P 500 down -1%, the Nasdaq down -3.5%, and the Dow Jones up 1%. Financials (+2.8%) and Real Estate (+2.2%) were the best-performing sectors.
2. The S&P 500's long-term trend is positive, and the short-term momentum is weak. 6,000 is the next resistance, while 5,830 is support.
3. The Q4 earnings season is well under way and 480 companies from the S&P 500 index have released their quarterly results, with 74% beating estimates. Earnings are expected to be up 17% in Q4 2024 and 11% in 2025.
4. Market sentiment is at the "Extreme Fear" level (20) as measured by CNN’s Fear & Greed indicator, while VIX is at a high value of 20.
5. Earnings reports from Costco and Broadcom, and the Job report are scheduled for next week.
My take:
The S&P 500 sold off for six straight days before finally bouncing on Friday as sentiment remained bearish for most of the week, weighing on risk-on assets. This bounce was long overdue, as many indicators had reached oversold conditions. It's no surprise that it happened right at an important support zone around 5,830—a level dating back to election day and one that has been tested multiple times since.
Now, the key question is whether this bounce has legs or will be short-lived. In a bull market, the kind of action we saw in the last two days typically suggests a swing low has been set. However, if bulls fail to hold their ground in the coming weeks, I'd start to question the strength of this cycle.
PERFORMANCE RECAP
1. S&P 500 Sector Performance
This week, 7 out of the 11 S&P 500 sectors posted gains. Financials led the market with a 2.8% increase, while Technology was the laggard, dropping 4%.
Year-to-date, 9 sectors have achieved positive performance. Health Care is the top-performing sector with a 8.3 % gain, while Consumer Cyclical lags behind, with a 3.7 % loss.
2. S&P 500 Top & Worst Performers
Over the last five trading days, 60% of the stocks in the S&P 500 index rose in value.
Top Performers:
$ERIE (Erie Indemnity Co): 11.6%
$FICO (Fair Isaac Corp): 11.1%
$WST (West Pharmaceutical Services, Inc): 10.2%
$AES (AES Corp): 9.4%
$CINF (Cincinnati Financial Corp): 9.4%
Worst Performers:
$PLTR (Palantir Technologies Inc): -16.2%
$SRE (Sempra): -17.8%
$VTRS (Viatris Inc): -18%
$NTAP (Netapp Inc): -19.8%
$TFX (Teleflex Incorporated): -24.4%
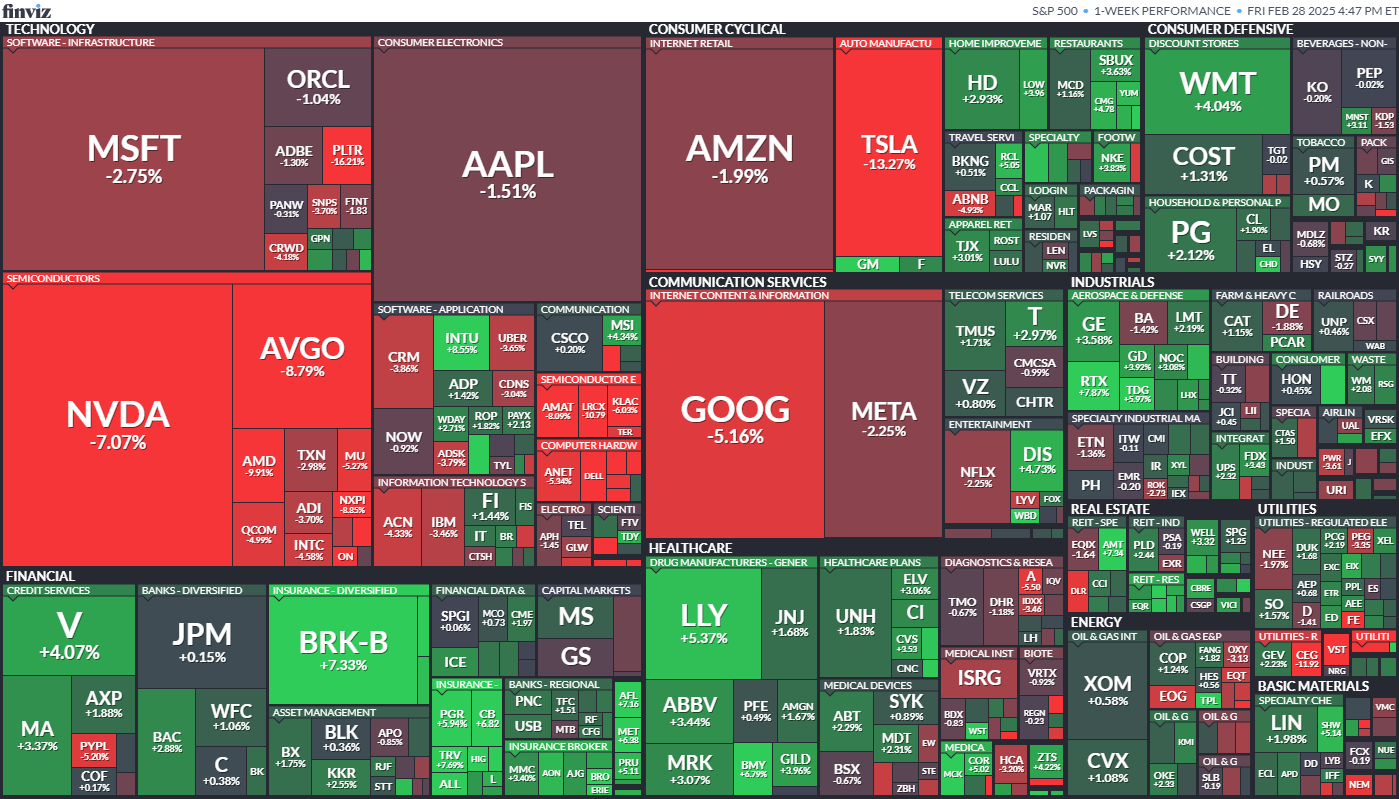
In addition, 43 stocks within the S&P 500 reached a new 16-week high, while 23 stocks set new lows. The majority of this week’s highs came from the Technology sector.
Notable Highs:
$V (Visa Inc)
$TMUS (T-Mobile US Inc)
$PM (Philip Morris International Inc)
$ABT (Abbott Laboratories)
$T (AT&T, Inc)
Notable Lows:
$INTU (Intuit Inc)
$AMD (Advanced Micro Devices Inc)
$AMAT (Applied Materials Inc)
$SNPS (Synopsys, Inc)
$SRE (Sempra)

MARKET MOMENTUM
1. Momentum Review
To evaluate the market's current health, I examine 4 key elements: performance, breadth, trends, and key levels. Healthy bull markets typically feature indices setting new highs, broad market participation, and ascending trend lines.
Performance (MIXED 🟡): evaluating recent market performance to gauge the momentum’s strength. Ideally i want to see returns accelerating short-term and index trading less than 5% from its 1-year high
1-month performance: -1.3% 🟡
3-month performance: -0.6% 🟡
vs. 1-year high: -3.0% 🟢
Breadth (MIXED 🟡): assessing market participation to understand the health of the trend. Extreme levels (above 80% or below 20%) may indicate overextended trends.
% of stocks above 200-day moving average: 58% (down from 59% last week) 🟡
% of stocks above 20-day moving average: 51% (up from 45% last week) 🟡
Trends: analyzing trend strength across multiple timeframes using exponential moving averages, scored on a scale of 1 to 5. A score of 3 or above suggests solid trends and supports holding a position.
Weekly chart: STRONG ⭐️⭐️⭐️⭐️

Daily chart: WEAK ⭐️

4-hour chart: WEAK ⭐️
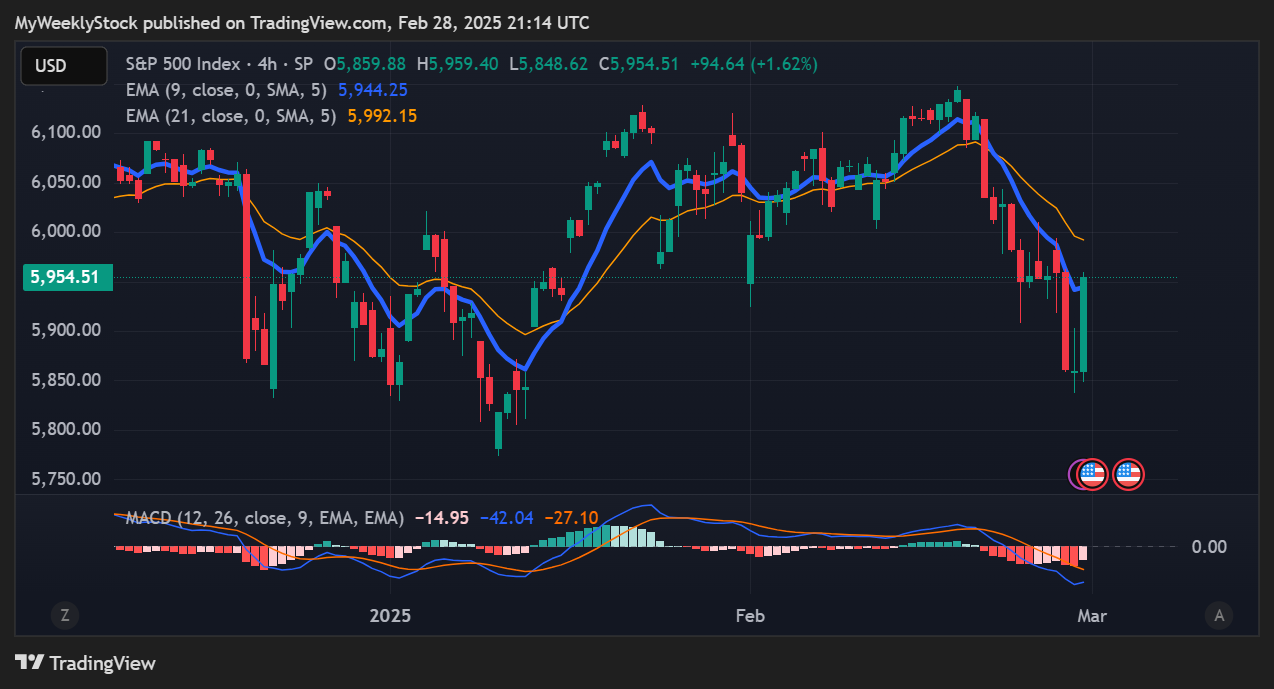
Key levels: identifying critical price zones to confirm the current trend or signal a potential reversal.
Support:
$5,830 (-2.1%)
$5,770 (-3.1%)
$5,700 (-4.3%)
Resistance:
$6,000 (+0.8%)
$6,150 (+3.3%)
$6,200 (+4.1%)
Enjoying the analysis so far? There’s so much more in the paid version, where I cover 70+ stocks and ETFs every month. Subscribe now to learn how I connect strategy to insights and, ultimately, portfolio decisions.
2. Post of the Week
This week's momentum analysis is about seasonality, as we are about to start the month of March. Since 1964, the S&P500 has been up 64% of the time in March, averaging a 1.0% return.
EARNINGS & ECONOMIC REPORTS RECAP
1. Earnings Outlook
Q4 Earnings: S&P 500 earnings are expected to grow by 17%, rising to 20% when excluding the energy sector.
2025 Full-Year Outlook: Earnings are expected to increase by 11%, above the 10-year average growth of 9%.
Analyst Revisions: Over the past month, 42% of all earnings revisions by analysts have been upward adjustments to their outlook.
Valuation: The forward 4-quarter P/E ratio stands at 21.7, above the 5-year and 10-year historical averages.

2. Earnings Season Recap
Out of 480 S&P 500 companies that have reported fourth-quarter earnings, 74% exceeded EPS expectations. It is slightly below with the four-quarter average of 78% but above the historical average of 67%.
Below are some notable companies that reported earnings last week. I’ve highlighted their EPS and revenue performance vs estimate, as well as their stock return this week.
One highlight of the week was Nvidia, which topped Revenues and EPS estimates. However, the stock still lost 8% lower on Thursday and 7% for the week.

3. Economic Reports
This week’s economic data brought no major surprises, with GDP and PCE inflation coming in line with expectations.
Q4 GDP grew 2.3% QoQ, matching forecasts but slowing from 3.1% in the previous quarter, signaling moderating economic growth.
Core PCE Price Index, the Fed’s preferred inflation gauge, rose 2.6% YoY, in line with estimates but slightly lower than last month’s 2.9%.
Jobless claims rose to 242K, slightly above expectations, while consumer confidence and new home sales came in weaker than forecast, adding to concerns about the broader economic momentum.

MARKET SENTIMENT
Measures of investor sentiment can be helpful as they provide insight into the views and opinions of professional or individual investors. While not definitive predictors of market direction, these measures can serve as a valuable complement to other indicators and analysis tools, helping to paint a more comprehensive picture of the market's current state.

1. AAII Sentiment Survey (Individual Investors)
The American Association of Individual Investors (AAII) conducts a weekly survey to gauge members' expectations for the stock market over the next six months. Results are published every Wednesday.
In the latest survey, 19% of respondents had a bullish outlook, down from 29% the previous week.
2. BofA Bull & Bear Indicator (Institutional Investors)
The Bank of America Bull-Bear Indicator measures investor sentiment based on fund managers' and institutional investors' views. Scores range from 0 (extremely bearish) to 10 (extremely bullish).
The most recent reading was 5.4, a neutral sentiment.
3. CNN Fear & Greed Index (Technical)
This daily measure analyzes seven indicators to assess how emotions drive market decisions. Scores range from Extreme Fear to Extreme Greed.
The index closed at 20 (Extreme Fear), down from 36 last Friday.
THE WEEK AHEAD
1. Economic Calendar
This week brings key economic data, with PMI surveys, to look at business conditions in the manufacturing and services sectors.
The main focus will be on Friday’s Nonfarm Payrolls (NFP) report, which is expected to show 133K job additions in February. With concerns about the economy’s strength, this report will be closely watched for signs of a potential slowdown or resilience in the labor market.
Fed Chair Powell is also scheduled to speak, and the Fed Monetary Policy Report will be released, making Friday a critical session for markets.

2. Earnings Calendar
Earnings season continues next week, and 11 companies from the S&P 500, including Broadcom and Costco, are expected to release their quarterly results.

Below are notable stocks reporting earnings next week, along with several key indicators I like to monitor:
Stock Indicators:
3-Month Performance: Assessing recent stock trends.
RSI (Relative Strength Index): A reading above 70 suggests overbought conditions, while below 30 indicates oversold.
P/E Ratio: A value below 25 often points to a "cheap" valuation or low growth expectations.
Stock Price Reactions to Earnings:
1-Day Stock Return on Earnings: How the stock performs on its earnings release day.
Implied Volatility: The options market's forecast for the expected 1-day stock move after earnings.

3. Stock Analysis of the Week
Every week, I share my analysis of 1 stock that has reported earnings in recent weeks, focusing on implications for long-term investors. This week, I prepared an analysis of Dell Technologies ($DELL).
👨💻 My View: PASS
Dell is down 40% from its highs and has struggled to regain momentum since losing its 30-week EMA in December—a critical long-term trend line.
I'm watching if the $90–$100 support zone can hold as the stock digests its recent earnings report. And more importantly, if the next bounce can finally clear the 30-week EMA.
Until then, I remain on the sidelines.
Check out the post for more details about $DELL performance, trend and key levels.
4. Subscribers Poll: Pullback Over?
CONCLUSION
Thank you for reading my Weekly Market Recap, which, I hope, got you ready for the week ahead.
If you want to take your investing journey to the next level, consider upgrading to a paid subscription. Subscribe now and learn more about my holistic, end-to-end momentum approach to investing.
Your first month is free, so this is the perfect opportunity to explore the full value of My Weekly Stock at no risk!
Thanks again, and I look forward to sharing my market recap with you next week.
Happy investing!
My Weekly Stock
DISCLAIMER
The information provided in this newsletter is for informational purposes only and should not be taken as financial advice. Any investments or decisions made based on the information provided in this newsletter are the reader's sole responsibility. We recommend that readers conduct their own research and consult a qualified financial professional before making investment decisions. The author does not assume any responsibility for any losses or damages arising from using the information provided in this newsletter.
Wild swing!
I appreciate the detail. Cool!