


Weekly Market Recap (Jan 13-17): Markets Bounce From Oversold Conditions - Will Bulls Follow Through?
Everything you need to know about last week's markets performance and what to expect next.
Dear readers,
Welcome back to My Weekly Stock, where in-depth market analysis meets proven momentum-based trading strategies. My mission? To help you win in the markets with unbiased, data-driven insights you can act on.
Friday means it's time to review the week in the markets. Each week, I dedicate hours to curating this market recap, preparing insightful analysis with clear visuals and a structured layout—making it easy for you to find exactly what you need, week after week. And because it's easy to get swayed by personal bias, I like to let the data do most of the talking.
If you want the full experience, consider upgrading your subscription. As a paid subscriber, you'll gain access to my 3 winning portfolios—and so much more: a clear investing framework, my momentum-based analysis, and live portfolio updates
Plus, as a token of my appreciation, your first month is FREE. If you're ready to give it a try—or simply want to support my work—this is your chance!
Let's dive in!
SUMMARY
Here are this week's highlights and what to look out for next:
1. The markets were positive this week, with the S&P 500 up 2.9%, the Nasdaq 2.5%, and the Dow Jones 3.7%. Energy (+6.3%) and Financials (+6.2%) were the best-performing sectors.
2. The S&P 500's long-term trend is positive, and the short-term momentum is turning positive. 6,100 is the next resistance, while 5,840 is support.
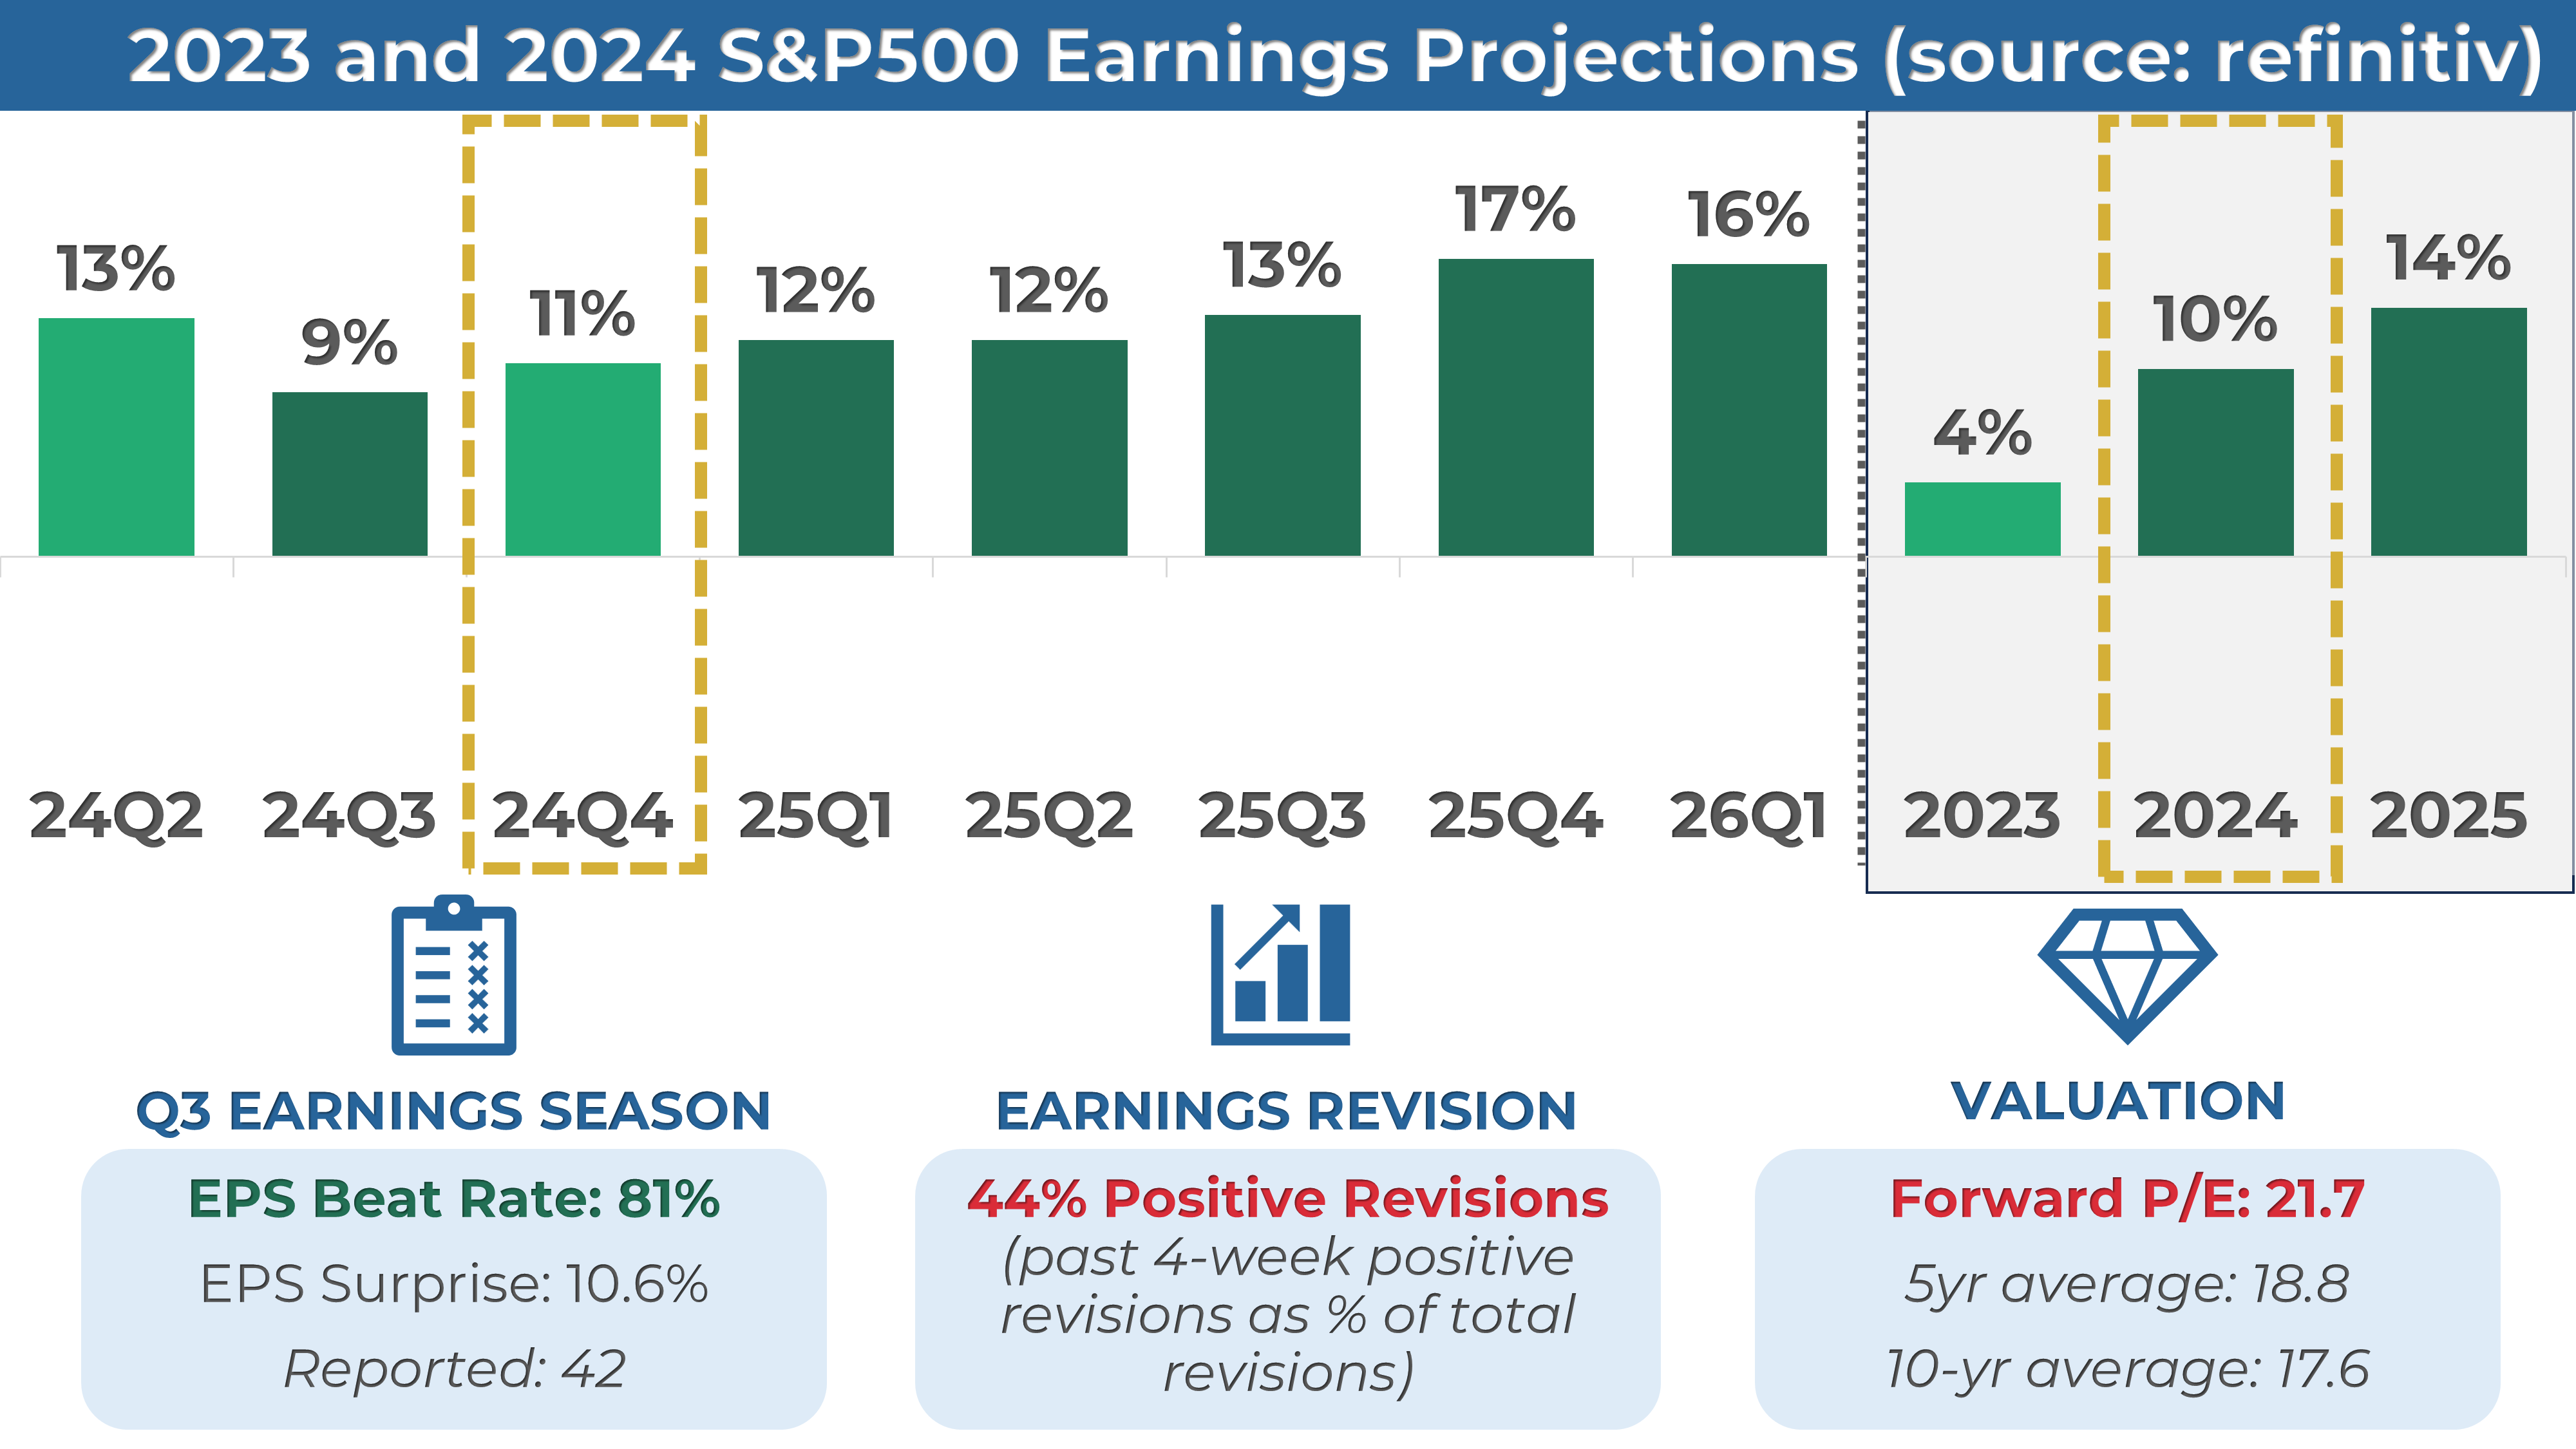
3. The Q4 earnings season just started and 42 companies from the S&P 500 index have released their quarterly results, with 81% beating estimates. Earnings are expected to be up 11% in Q4 2024 and 10% in 2024.
4. Market sentiment is at the "Fear" level (38) as measured by CNN’s Fear & Greed indicator, while VIX is at a medium value of 16.
5. Earnings reports from Netflix and American Express, and the latest PMI data are scheduled for next week.
My take:
The week started on the wrong foot as the S&P 500 finally filled the election day gap. Yet, as we've seen so many times over the past year, just when things were to take an ugly turn, the market staged an impressive bounce. And this time, the rally had legs, supported by softer CPI and retail sales data, which helped cool down yields.
It's not all clear skies just yet. The index remains in a large choppy zone, ranging from 5,770, this week's low, to 6,100, the all-time high. We could continue climbing toward the upper range or simply ping-pong within the range. With significant catalysts on the horizon, including earnings and Trump taking office, volatility may stay elevated. That said, this week's price action feels constructive and like classic behavior in a bull market. While the road ahead may not be smooth, we must give this bull market the benefit of the doubt until proven otherwise.

PERFORMANCE RECAP
1. S&P 500 Sector Performance
This week, 11 out of the 11 S&P 500 sectors posted gains. Energy led the market with a 6.3% increase, while Health Care was the laggard, still gaining 0.4%.
Year-to-date, 10 sectors have achieved positive performance. Energy is the top-performing sector with a 9.7 % gain, while Consumer Defensive lags behind, with a 1.7 % loss.

2. S&P 500 Top & Worst Performers
Over the last five trading days, 88% of the stocks in the S&P 500 index rose in value.
Top Performers:
$BLDR (Builders Firstsource Inc): 17.4%
$URI (United Rentals, Inc): 14.9%
$SLB (Schlumberger Ltd): 12.8%
$ALB (Albemarle Corp): 12.6%
$INTC (Intel Corp): 12.2%
Worst Performers:
$BIIB (Biogen Inc): -5.6%
$TGT (Target Corp): -5.7%
$LVS (Las Vegas Sands Corp): -5.9%
$LLY (Lilly(Eli) & Co): -9.2%
$CRL (Charles River Laboratories International Inc): -12.1%

In addition, 25 stocks within the S&P 500 reached a new 52-week high, while 32 stocks set new lows. The majority of this week’s lows came from the Consumer Defensive sector.
Notable Highs:
$JPM (JPMorgan Chase & Co)
$CSCO (Cisco Systems, Inc)
$AXP (American Express Co)
$ISRG (Intuitive Surgical Inc)
$GS (Goldman Sachs Group, Inc)
Notable Lows:
$AMD (Advanced Micro Devices Inc)
$ADBE (Adobe Inc)
$CMCSA (Comcast Corp)
$UPS (United Parcel Service, Inc)
$NKE (Nike, Inc)

MARKET MOMENTUM
1. Momentum Review
To evaluate the market's current health, I examine 4 key elements: performance, breadth, trends, and key levels. Healthy bull markets typically feature indices setting new highs, broad market participation, and ascending trend lines.
Performance (POSITIVE 🟢): evaluating recent market performance to gauge the momentum’s strength. Ideally i want to see returns accelerating short-term and index trading less than 5% from its 1-year high
1-month performance: -1.5% 🔴
3-month performance: +2.6% 🟢
vs. 1-year high: -1.9% 🟢
Breadth (STRONG 🟢) : assessing market participation to understand the robustness of the trend. Extreme levels (above 80% or below 20%) may indicate overextended trends.
% of stocks above 200-day moving average: 58% (up from 49% last week) 🟢
% of stocks above 20-day moving average: 73% (up from 20% last week) 🟢
Trends: analyzing trend strength across multiple timeframes using exponential moving averages, scored on a scale of 1 to 5. A score of 3 or above suggests solid trends and supports holding a position.
Weekly chart: STRONG ⭐️⭐️⭐️⭐️

Daily chart: MIXED ⭐️⭐️

4-hour chart: POSITIVE ⭐️⭐️⭐️

Key levels: identifying critical price zones to confirm the current trend or signal a potential reversal.
Support:
$5,900 (-1.6%)
$5,840 (-2.6%)
$5,770 (-0.7%)
Resistance:
$6,045 (+0.8%)
$6,100 (+1.7%)
Enjoying the analysis so far? There’s so much more in the paid version, where I cover 70+ stocks and ETFs every month. Subscribe now to learn how I connect strategy to insights and, ultimately, portfolio decisions.
2. Post of the Week
This week's momentum analysis is about the top most oversold/overbought stocks in the S&P 500 based on the Relative Strength Index. RSI is a momentum oscillator used to measure the speed and change of price movements. RSI is considered overbought when it is above 70 and oversold when it is below 30. While I would never use RSI alone to make an investment decision, it can be a helpful tool to identify a potential change in trend.
EARNINGS & ECONOMIC REPORTS RECAP
1. Earnings Outlook
Q3 Earnings: S&P 500 earnings are expected to grow by 11%, rising to 14% when excluding the energy sector.
2024 Full-Year Outlook: Earnings are expected to increase by 10%, slightly above the 10-year average growth of 9%.
Analyst Revisions: Over the past month, 44% of all earnings revisions by analysts have been upward adjustments to their outlook.
Valuation: The forward 4-quarter P/E ratio stands at 21.7, above the 5-year and 10-year historical averages.
2. Earnings Season Recap
Out of 42 S&P 500 companies that have reported fourth-quarter earnings, 81% exceeded EPS expectations. It is above the four-quarter average of 78% and the historical average of 67%.
Below are some notable companies that reported earnings last week. I’ve highlighted their EPS and revenue performance vs estimate, as well as their stock return this week.
Notably, Bank stocks like Morgan Stanley, Goldman Sachs, Wells Fargo and Citigroup were standout performers with a double EPS and Revenue beat and a double-digit return last week.

3. Economic Reports
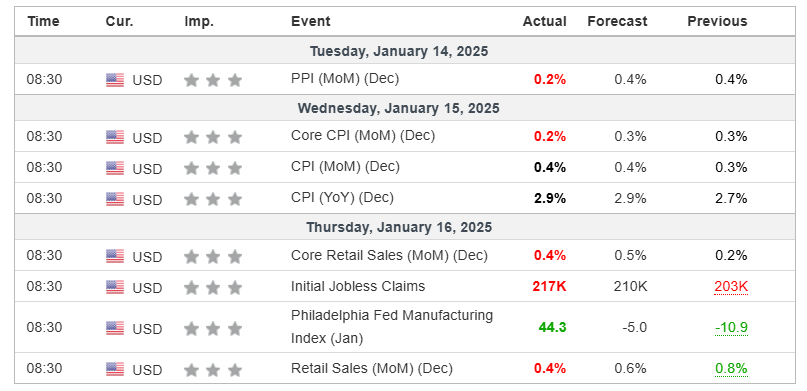
Here’s a summary of this week’s key economic reports:
CPI (December): The Consumer Price Index rose 0.4% month-over-month, matching expectations, while the annual figure remained steady at 2.9%. Core CPI increased by 0.2%, slightly below the forecast of 0.3%.
PPI (December): The Producer Price Index rose 0.2% month-over-month, falling short of the 0.4% forecast, signaling easing inflation pressures on the production side.
Retail Sales (December): Core retail sales rose 0.4% month-over-month, below expectations of 0.5%.
MARKET SENTIMENT
Measures of investor sentiment can be helpful as they provide insight into the views and opinions of professional or individual investors. While not definitive predictors of market direction, these measures can serve as a valuable complement to other indicators and analysis tools, helping to paint a more comprehensive picture of the market's current state.

1. AAII Sentiment Survey (Individual Investors)
The American Association of Individual Investors (AAII) conducts a weekly survey to gauge members' expectations for the stock market over the next six months. Results are published every Wednesday.
In the latest survey, 25% of respondents had a bullish outlook, down from 35% the previous week.
2. BofA Bull & Bear Indicator (Institutional Investors)
The Bank of America Bull-Bear Indicator measures investor sentiment based on fund managers' and institutional investors' views. Scores range from 0 (extremely bearish) to 10 (extremely bullish).
The most recent reading was 3.8, a slightly bearish sentiment.
3. CNN Fear & Greed Index (Technical)
This daily measure analyzes seven indicators to assess how emotions drive market decisions. Scores range from Extreme Fear to Extreme Greed.
The index closed at 38 (Fear), up from 29 last Friday.
THE WEEK AHEAD
1. Economic Calendar
Next week will feature a lighter economic calendar, with markets closed on Monday, January 20, for Martin Luther King Jr. Day. Key reports to watch include the PMI Data on Friday. The S&P Global Manufacturing PMI is expected to remain below 50, signaling contraction in the sector. The S&P Global Services PMI will also be released, providing insight into the broader economy’s service sector performance.

2. Earnings Calendar
Earnings season starts next week, and 37 companies from the S&P 500, including Netflix and American Express, are expected to release their quarterly results.
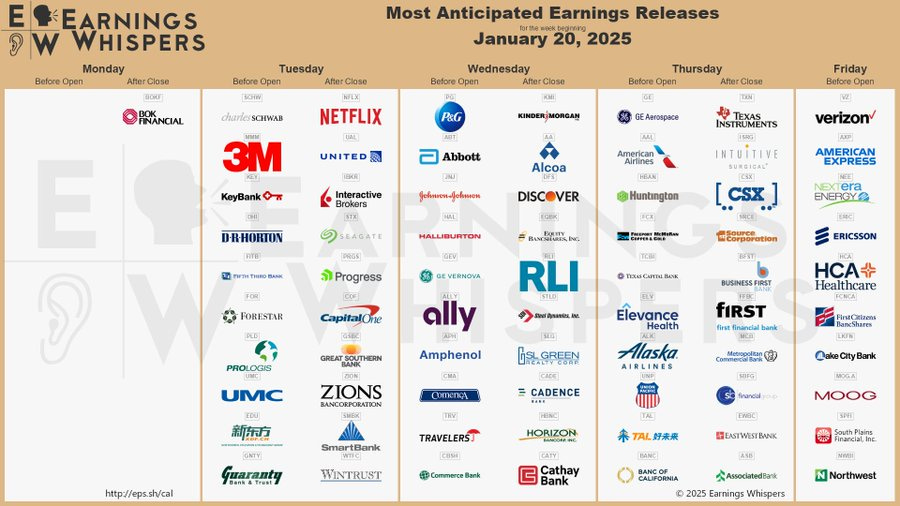
Below are notable stocks reporting earnings next week, along with several key indicators I like to monitor:
Stock Indicators:
3-Month Performance: Assessing recent stock trends.
RSI (Relative Strength Index): A reading above 70 suggests overbought conditions, while below 30 indicates oversold.
P/E Ratio: A value below 25 often points to a "cheap" valuation or low growth expectations.
Stock Price Reactions to Earnings:
1-Day Stock Return on Earnings: How the stock performs on its earnings release day.
Implied Volatility: The options market's forecast for the expected 1-day stock move after earnings.

3. Stock Analysis of the Week
Every week, I share my analysis of 1 stock reporting earnings in the coming days, focusing on implications for long-term investors. This week, I prepared an analysis of Netflix ($NFLX).
👨💻 My View: HOLD
Netflix is now entering its third year of an impressive bull cycle, consistently delivering higher highs and higher lows. However, the stock stumbled in early December, posting five consecutive weekly losses.
In my view, there’s no immediate reason to worry, as the overall trend remains intact. The recent pullback appears more like a pause rather than a reversal. Should the uptrend resume, it remains to be seen whether Netflix has enough momentum to break through the critical $1,000 barrier—a significant psychological and technical level.
Check out the post for more details about $NFLX performance, trend and key levels.
4. Subscribers Poll: Your Outlook
CONCLUSION
Thank you for reading my Weekly Market Recap, which, I hope, got you ready for the week ahead.
If you want to take your investing journey to the next level, consider upgrading to a paid subscription. Subscribe now and learn more about my holistic, end-to-end momentum approach to investing.
Your first month is free, so this is the perfect opportunity to explore the full value of My Weekly Stock at no risk!
Thanks again, and I look forward to sharing my market recap with you next week.
Happy investing!
My Weekly Stock
DISCLAIMER
The information provided in this newsletter is for informational purposes only and should not be taken as financial advice. Any investments or decisions made based on the information provided in this newsletter are the reader's sole responsibility. We recommend that readers conduct their own research and consult a qualified financial professional before making investment decisions. The author does not assume any responsibility for any losses or damages arising from using the information provided in this newsletter.