


Weekly Market Recap (Jan 20-24): The S&P 500 Squeezes to New Record Highs - But Fed Meeting and Tech Earnings Loom.
Everything you need to know about last week's markets performance and what to expect next.
Dear readers,
Welcome back to My Weekly Stock, where in-depth market analysis meets proven momentum-based trading strategies. My mission? To help you win in the markets with unbiased, data-driven insights you can act on.
Friday means it's time to review the week in the markets. Each week, I dedicate hours to curating this market recap, preparing insightful analysis with clear visuals and a structured layout—making it easy for you to find exactly what you need, week after week. And because it's easy to get swayed by personal bias, I like to let the data do most of the talking.
If you want the full experience, consider upgrading your subscription. As a paid subscriber, you'll gain access to my 3 winning portfolios—and so much more: a clear investing framework, my momentum-based analysis, and live portfolio updates
Plus, as a token of my appreciation, your first month is FREE. If you're ready to give it a try—or simply want to support my work—this is your chance!
Let's dive in!
SUMMARY
Here are this week's highlights and what to look out for next:
1. The markets were positive this week, with the S&P 500 up 1.7%, the Nasdaq 1.7%, and the Dow Jones 2.2%. Communication Serv. (+3.1%) and Health Care (+3%) were the best-performing sectors.
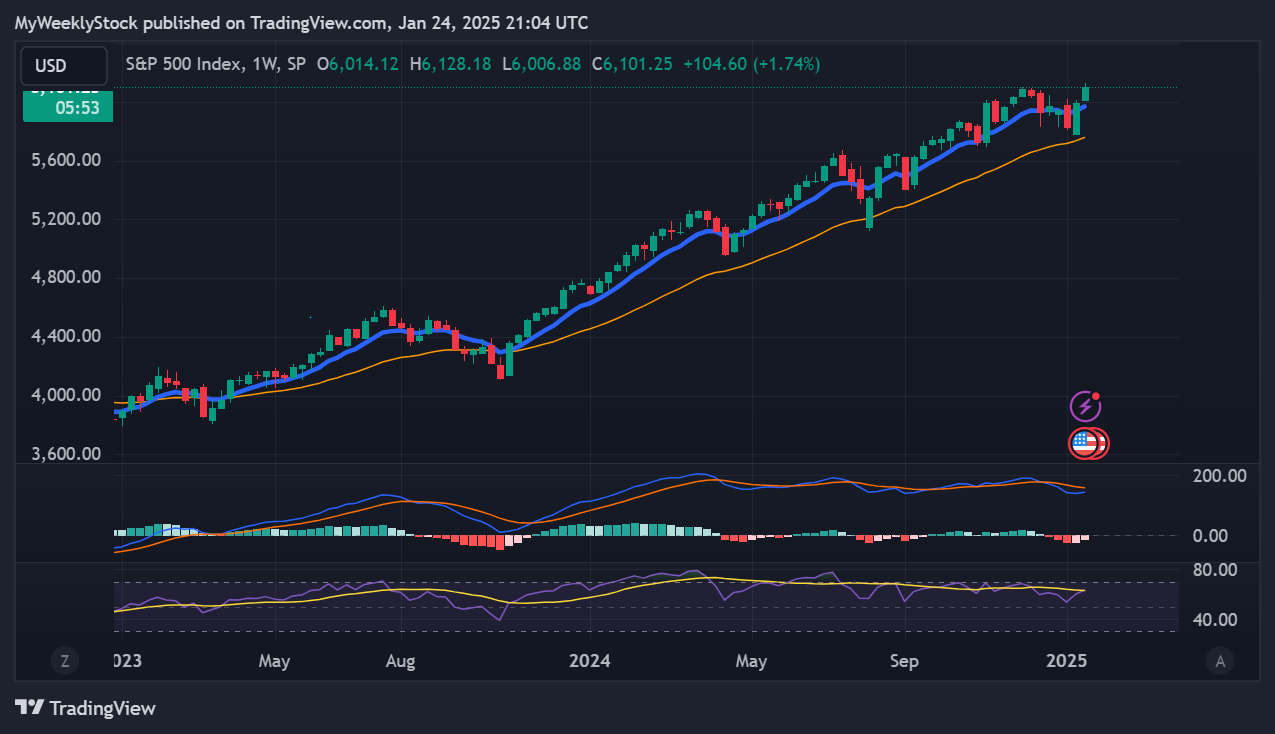
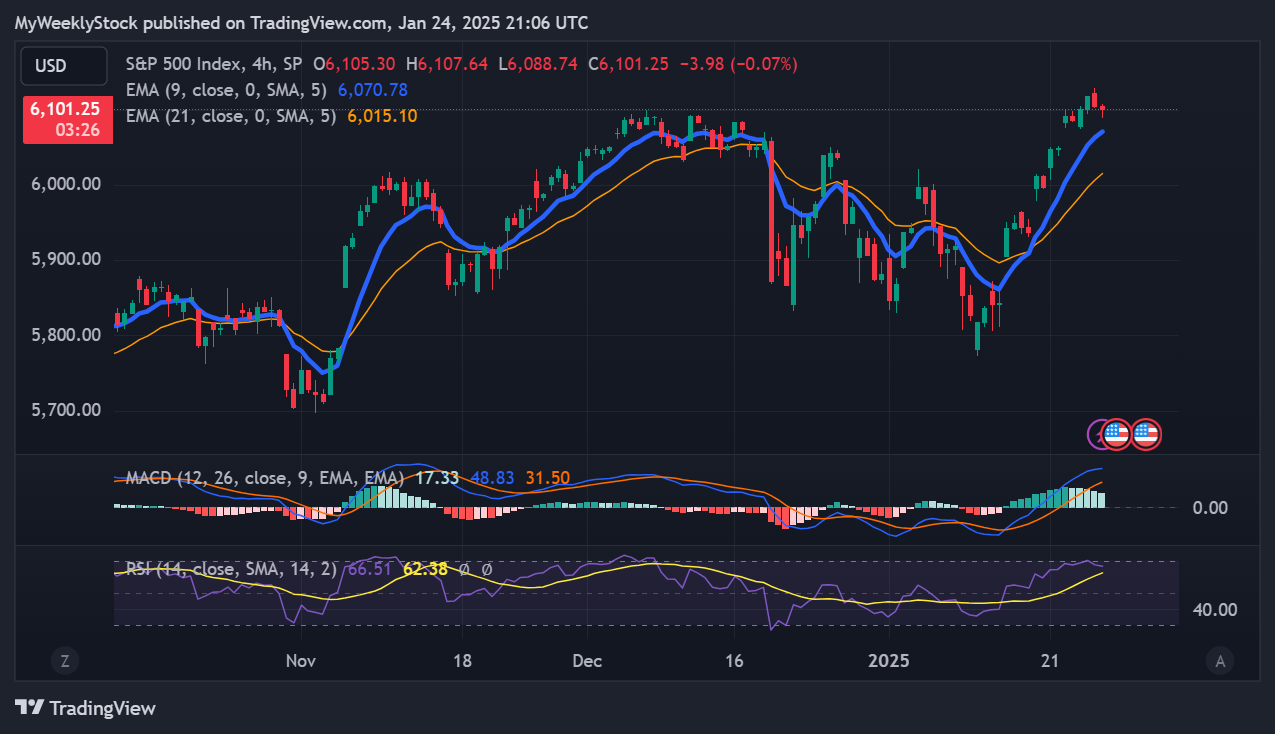
2. The S&P 500's long-term trend is positive, and so is the short-term momentum. 6,130 is the next resistance, while 6,070 is support.
3. The Q4 earnings season is picking up steam started and 78 companies from the S&P 500 index have released their quarterly results, with 78% beating estimates. Earnings are expected to be up 10% in Q4 2024 and 14% in 2025.
4. Market sentiment is at the "Neutral" level (48) as measured by CNN’s Fear & Greed indicator, while VIX is at a low value of 15.
5. Earnings reports from Apple, Microsoft, Meta and Tesla, the Fed meeting and the latest PCE data are scheduled for next week.
My take:
Since mid-December, the S&P 500 has been trading within a wide range between 6,100 and 5,775, with multiple back-and-forth moves. We finally broke above the upper range this week and hit a new all-time high. A failure to clear this resistance two months ago, coupled with hawkish commentary from the Fed in their last meeting, contributed to the choppy action we’ve experienced since.
Now, one month later, we’re kind of back at the spot with another Fed meeting looming. Adding to the stakes is arguably the most critical week of the earnings season, with four of the Mag 7 reporting quarterly results. While I remain cautious heading into this tricky week—especially given that the markets may have run too hot in the past 2 weeks—I’ll continue to let momentum and trend guide me. And for now, both short- and long-term indicators still suggest more upside ahead.

PERFORMANCE RECAP
1. S&P 500 Sector Performance
This week, 10 out of the 11 S&P 500 sectors posted gains. Communication Serv. led the market with a 3.1% increase, while Energy was the laggard, dropping 2.8%.
Year-to-date, 10 sectors have achieved positive performance. Industrials is the top-performing sector with a 7.1 % gain, while Consumer Defensive lags behind, with a 0.9 % loss.

2. S&P 500 Top & Worst Performers
Over the last five trading days, 70% of the stocks in the S&P 500 index rose in value.
Top Performers:
$MRNA (Moderna Inc): 22.7%
$NFLX (Netflix Inc): 16.1%
$ORCL (Oracle Corp): 15.1%
$PLTR (Palantir Technologies Inc): 14.1%
$STX (Seagate Technology Holdings Plc): 13.8%
Worst Performers:
$WBA (Walgreens Boots Alliance Inc): -8.2%
$JBHT (J.B. Hunt Transport Services, Inc): -8.7%
$EXPE (Expedia Group Inc): -9.2%
$CF (CF Industries Holdings Inc): -9.4%
$FSLR (First Solar Inc): -11.9%

In addition, 57 stocks within the S&P 500 reached a new 52-week high, while 5 stocks set new lows. The majority of this week’s highs came from the Financials sector.
Notable Highs:
$GOOG (Alphabet Inc)
$AMZN (Amazon.com Inc)
$JPM (JPMorgan Chase & Co)
$V (Visa Inc)
$NFLX (Netflix Inc)
Notable Lows:
$EA (Electronic Arts, Inc)
$HSY (Hershey Company)
$BIIB (Biogen Inc)
$AES (AES Corp)
$CAG (Conagra Brands Inc)

MARKET MOMENTUM
1. Momentum Review
To evaluate the market's current health, I examine 4 key elements: performance, breadth, trends, and key levels. Healthy bull markets typically feature indices setting new highs, broad market participation, and ascending trend lines.
Performance (POSITIVE 🟢): evaluating recent market performance to gauge the momentum’s strength. Ideally i want to see returns accelerating short-term and index trading less than 5% from its 1-year high
1-month performance: +2.9% 🟢
3-month performance: +4.2% 🟢
vs. 1-year high: -0.3% 🟢
Breadth (STRONG 🟢) : assessing market participation to understand the robustness of the trend. Extreme levels (above 80% or below 20%) may indicate overextended trends.
% of stocks above 200-day moving average: 60% (up from 58% last week) 🟢
% of stocks above 20-day moving average: 79% (up from 73% last week) 🟢
Trends: analyzing trend strength across multiple timeframes using exponential moving averages, scored on a scale of 1 to 5. A score of 3 or above suggests solid trends and supports holding a position.
Weekly chart: STRONG ⭐️⭐️⭐️⭐️⭐️
Daily chart: STRONG ⭐️⭐️⭐️⭐️

4-hour chart: STRONG ⭐️⭐️⭐️ ⭐️⭐️
Key levels: identifying critical price zones to confirm the current trend or signal a potential reversal.
Support:
$6,070 (-0.5%)
$5,960 (-2.3%)
$5,900 (-3.3%)
Resistance:
$6,130 (+0.5%)
$6,200 (+1.6%)
Enjoying the analysis so far? There’s so much more in the paid version, where I cover 70+ stocks and ETFs every month. Subscribe now to learn how I connect strategy to insights and, ultimately, portfolio decisions.
2. Post of the Week
This week's momentum analysis is about Mega Caps' trends. Using a combination of performance metrics and technical indicators, I've developed a proprietary algorithm to rank these various stocks and identify potential outperformers. Based on this approach, I've identified the Amazon and Alphabet as having the best relative momentum currently.
EARNINGS & ECONOMIC REPORTS RECAP
1. Earnings Outlook
Q3 Earnings: S&P 500 earnings are expected to grow by 10%, rising to 14% when excluding the energy sector.
2025 Full-Year Outlook: Earnings are expected to increase by 14%, above the 10-year average growth of 9%.
Analyst Revisions: Over the past month, 44% of all earnings revisions by analysts have been upward adjustments to their outlook.
Valuation: The forward 4-quarter P/E ratio stands at 22.4, above the 5-year and 10-year historical averages.

2. Earnings Season Recap
Out of 78 S&P 500 companies that have reported fourth-quarter earnings, 78% exceeded EPS expectations. It is in line with the four-quarter average of 78% and above the historical average of 67%.
Below are some notable companies that reported earnings last week. I’ve highlighted their EPS and revenue performance vs estimate, as well as their stock return this week.
Notably, Netflix was a standout performer with an EPS and Revenue beat and a 16% return last week.

3. Economic Reports
It was a relatively quiet week for economic reports, with markets closed on Monday in observance of Martin Luther King Jr. Day. The main event of the week was the U.S. Presidential inauguration.
In addition, the Manufacturing PMI rose slightly to 50.1, signaling marginal growth in the sector. However, the Services PMI fell to 52.8, below forecasts of 56.4, suggesting slower expansion in the services sector.

MARKET SENTIMENT
Measures of investor sentiment can be helpful as they provide insight into the views and opinions of professional or individual investors. While not definitive predictors of market direction, these measures can serve as a valuable complement to other indicators and analysis tools, helping to paint a more comprehensive picture of the market's current state.

1. AAII Sentiment Survey (Individual Investors)
The American Association of Individual Investors (AAII) conducts a weekly survey to gauge members' expectations for the stock market over the next six months. Results are published every Wednesday.
In the latest survey, 43% of respondents had a bullish outlook, up from 25% the previous week.
2. BofA Bull & Bear Indicator (Institutional Investors)
The Bank of America Bull-Bear Indicator measures investor sentiment based on fund managers' and institutional investors' views. Scores range from 0 (extremely bearish) to 10 (extremely bullish).
The most recent reading was 4.0, a neutral sentiment.
3. CNN Fear & Greed Index (Technical)
This daily measure analyzes seven indicators to assess how emotions drive market decisions. Scores range from Extreme Fear to Extreme Greed.
The index closed at 48 (Neutral), up from 38 last Friday.
THE WEEK AHEAD
1. Economic Calendar
Here's a summary of the key reports to watch for next week:
FOMC Meeting (Wednesday): The Federal Reserve is expected to announce its latest interest rate decision, followed by a press conference. Markets will closely monitor any changes in monetary policy or forward guidance.
Core PCE Price Index (Friday): The Fed's preferred measure of inflation, the Core Personal Consumption Expenditures Price Index, is forecast to rise by 0.1% month-over-month and 2.8% year-over-year, signaling stable inflationary trends.
GDP (Thursday): The Q4 GDP growth rate will be released. This update will provide insight into the economy's performance in the final quarter 2024.

2. Earnings Calendar
Earnings season starts next week, and 103 companies from the S&P 500, including Apple, Microsoft, Meta and Tesla, are expected to release their quarterly results.

Below are notable stocks reporting earnings next week, along with several key indicators I like to monitor:
Stock Indicators:
3-Month Performance: Assessing recent stock trends.
RSI (Relative Strength Index): A reading above 70 suggests overbought conditions, while below 30 indicates oversold.
P/E Ratio: A value below 25 often points to a "cheap" valuation or low growth expectations.
Stock Price Reactions to Earnings:
1-Day Stock Return on Earnings: How the stock performs on its earnings release day.
Implied Volatility: The options market's forecast for the expected 1-day stock move after earnings.
Apple ($AAPL) will be an interesting watch in the week ahead. Despite being down 6% over the last 3 months, its RSI of 31 suggests it’s approaching oversold territory. Historically, Apple tends to trade positively around earnings, and with implied volatility at ±4.6%, the options market is pricing in a relatively moderate move.

3. Stock Analysis of the Week
Every week, I share my analysis of 1 stock reporting earnings in the coming days, focusing on implications for long-term investors. This week, I prepared an analysis of Microsoft ($MSFT).
👨💻 My View: BUY
Microsoft was somewhat of a laggard among mega-cap tech in 2024. In particular, the stock ranged between $400 and $450 in the past 6 months.
After hovering around the range's lower bound in early January, the stock bounced back nicely and seems now ripe for a breakout attempt.
A sustained move above the previous all-time high at $470 would confirm the breakout and signal the next leg higher for Microsoft.
Check out the post for more details about $MSFT performance, trend and key levels.
4. Subscribers Poll: Earnings Season
CONCLUSION
Thank you for reading my Weekly Market Recap, which, I hope, got you ready for the week ahead.
If you want to take your investing journey to the next level, consider upgrading to a paid subscription. Subscribe now and learn more about my holistic, end-to-end momentum approach to investing.
Your first month is free, so this is the perfect opportunity to explore the full value of My Weekly Stock at no risk!
Thanks again, and I look forward to sharing my market recap with you next week.
Happy investing!
My Weekly Stock
DISCLAIMER
The information provided in this newsletter is for informational purposes only and should not be taken as financial advice. Any investments or decisions made based on the information provided in this newsletter are the reader's sole responsibility. We recommend that readers conduct their own research and consult a qualified financial professional before making investment decisions. The author does not assume any responsibility for any losses or damages arising from using the information provided in this newsletter.