


Weekly Market Recap (Jan 6-10): Softness Continues For The S&P 500 – Can It Finally Sustain a Bounce?
Everything you need to know about last week's markets performance and what to expect next.
Dear readers,
Welcome back to My Weekly Stock, where in-depth market analysis meets proven momentum-based trading strategies. My mission? To help you win in the markets with unbiased, data-driven insights you can act on.
Over the years, I've developed a proprietary momentum-based approach, enabling me to ride strong trends confidently. Every week, I dedicate hours to researching, analyzing, and curating data—I do all the hard work so you don't have to.
If you want the full experience, consider upgrading your subscription. As a paid subscriber, you'll gain access to my 3 winning portfolios—and so much more: a clear investing framework, my momentum-based analysis, and live portfolio updates
Plus, as a token of my appreciation, your first month is FREE. If you're ready to give it a try—or simply want to support my work—this is your chance!
Friday means it's time to review the week in markets. Each week, I dedicate hours to curating this market recap, preparing insightful analysis with clear visuals and a structured layout—making it easy for you to find exactly what you need, week after week. And because it's easy to get swayed by personal bias, I like to let the data do most of the talking.
Let's dive in!
SUMMARY
Here are this week's highlights and what to look out for next:
1. The markets were negative this week, with the S&P 500 down 2%, the Nasdaq down 2.4%, and the Dow Jones down 1.9%. Energy (+1.1%) and Health Care (+0.5%) were the best-performing sectors.
2. The S&P 500's long-term trend is positive, but the short-term momentum is negative. 5,925 is the next resistance, while 5,780 is support.
3. The Q4 earnings season just started and 22 companies from the S&P 500 index have released their quarterly results, with 77% beating estimates. Earnings are expected to be up 9% in Q3 2024 and 10% in 2024.
4. Market sentiment is at the "Fear" level (29) as measured by CNN’s Fear & Greed indicator, while VIX is at a high value of 19.
5. Earnings reports from JP Morgan and UnitedHealth, and the latest CPI, PPI and Retail Sales reports are scheduled for next week.
My take:
Heading into the Christmas holiday, I highlighted the 5,830–6,100 range as a large, noisy, choppy zone, and that's what the markets have delivered since then. We're now right below the lower end of that range, a level tested multiple times. If we don’t see a strong reaction here, we are likely to retrace all the post-election gains—a troubling sign for the bulls. In the short term, momentum remains weak, and unless the index recovers above 6,000 at a start, I expect continued choppy action or worse.
Looking ahead to 2025, I have no fixed year-end target, as I see little value in trying to forecast so far out. Instead, I focus on navigating what the market throws at us right now. After two consecutive years of 20%+ gains with only mild pullbacks, we are likely due for a more significant correction. I anticipate more bumps on the road this year, and how the index digests and rebounds from any future pullbacks will be key to gauging the health of this bull market.

PERFORMANCE RECAP
1. S&P 500 Sector Performance
This week, 3 out of the 11 S&P 500 sectors posted gains. Energy led the market with a 1.1% increase, while Real Estate was the laggard, dropping 4.1%.
Year-to-date, 2 sectors have achieved positive performance. Energy is the top-performing sector with a 3.2 % gain, while Real Estate lags behind, with a 3.7 % loss.

2. S&P 500 Top & Worst Performers
Over the last five trading days, 38% of the stocks in the S&P 500 index rose in value.
Top Performers:
$WBA (Walgreens Boots Alliance Inc): 28%
$CEG (Constellation Energy Corporation): 25.8%
$MU (Micron Technology Inc): 13.8%
$DAL (Delta Air Lines, Inc): 13.3%
$UAL (United Airlines Holdings Inc): 12.2%
Worst Performers:
$CPB (Campbells Co): -10.2%
$PLTR (Palantir Technologies Inc): -10.6%
$ON (ON Semiconductor Corp): -12.6%
$PCG (PG&E Corp): -14.2%
$STZ (Constellation Brands Inc): -18.3%

In addition, 12 stocks within the S&P 500 reached a new 52-week high, while 30 stocks set new lows. The majority of this week’s lows came from the Consumer Defensive sector.
Notable Highs:
$NVDA (NVIDIA Corp)
$$ANET (Arista Networks Inc)
$BSX (Boston Scientific Corp)
$C (Citigroup Inc)
$FTNT (Fortinet Inc)
Notable Lows:
$JNJ (Johnson & Johnson)
$PEP (PepsiCo Inc)
$ADBE (Adobe Inc)
$CMCSA (Comcast Corp)
$MDLZ (Mondelez International Inc)

MARKET MOMENTUM
1. Momentum Analysis
To evaluate the market's current health, I examine 4 key elements: performance, breadth, trends, and key levels. Healthy bull markets typically feature indices setting new highs, broad market participation, and ascending trend lines.
Performance (MIXED 🟡): evaluating recent market performance to gauge the momentum’s strength. Ideally i want to see returns accelerating short-term and index trading less than 5% from its 1-year high
1-month performance: -4% 🔴
3-month performance: +1% 🟡
vs. 1-year high: -4.7% 🟢
Breadth (WEAK 🔴) : assessing market participation to understand the robustness of the trend. Extreme levels (above 80% or below 20%) may indicate overextended trends.
% of stocks above 200-day moving average: 49% (down from 55% last week) 🟡
% of stocks above 20-day moving average: 20% (down from 22% last week) 🔴
Trends: analyzing trend strength across multiple timeframes using exponential moving averages, scored on a scale of 1 to 5. A score of 3 or above suggests solid trends and supports holding a position.
Weekly chart: Strong ⭐️⭐️⭐️⭐️

Daily chart: Weak

4-hour chart: Weak

Key levels: identifying critical price zones to confirm the current trend or signal a potential reversal.
Support:
$5,780 (-0.7%)
$5,700 (-2.2%)
$5,550 (-4.8%)
Resistance:
$5,925 (+1.7%)
$6,000 (+3.0%)
$6,100 (+4.7%)
Enjoying the analysis so far? There’s so much more in the paid version, where I cover 70+ stocks and ETFs every month. Subscribe now to learn how I connect strategy to insights and, ultimately, portfolio decisions.
2. Momentum Analysis of the Week
This week's momentum analysis is about seasonality, as we just started the month of January. Since 1964, the S&P500 has been up 58% of the time in January, averaging a 1.0% return.
EARNINGS & ECONOMIC REPORTS RECAP
1. Earnings Outlook
Q3 Earnings: S&P 500 earnings are expected to grow by 10%, rising to 12% when excluding the energy sector.
2024 Full-Year Outlook: Earnings are expected to increase by 10%, slightly above the 10-year average growth of 9%.
Analyst Revisions: Over the past month, 44% of all earnings revisions by analysts have been upward adjustments to their outlook.
Valuation: The forward 4-quarter P/E ratio stands at 21.7, above the 5-year and 10-year historical averages.
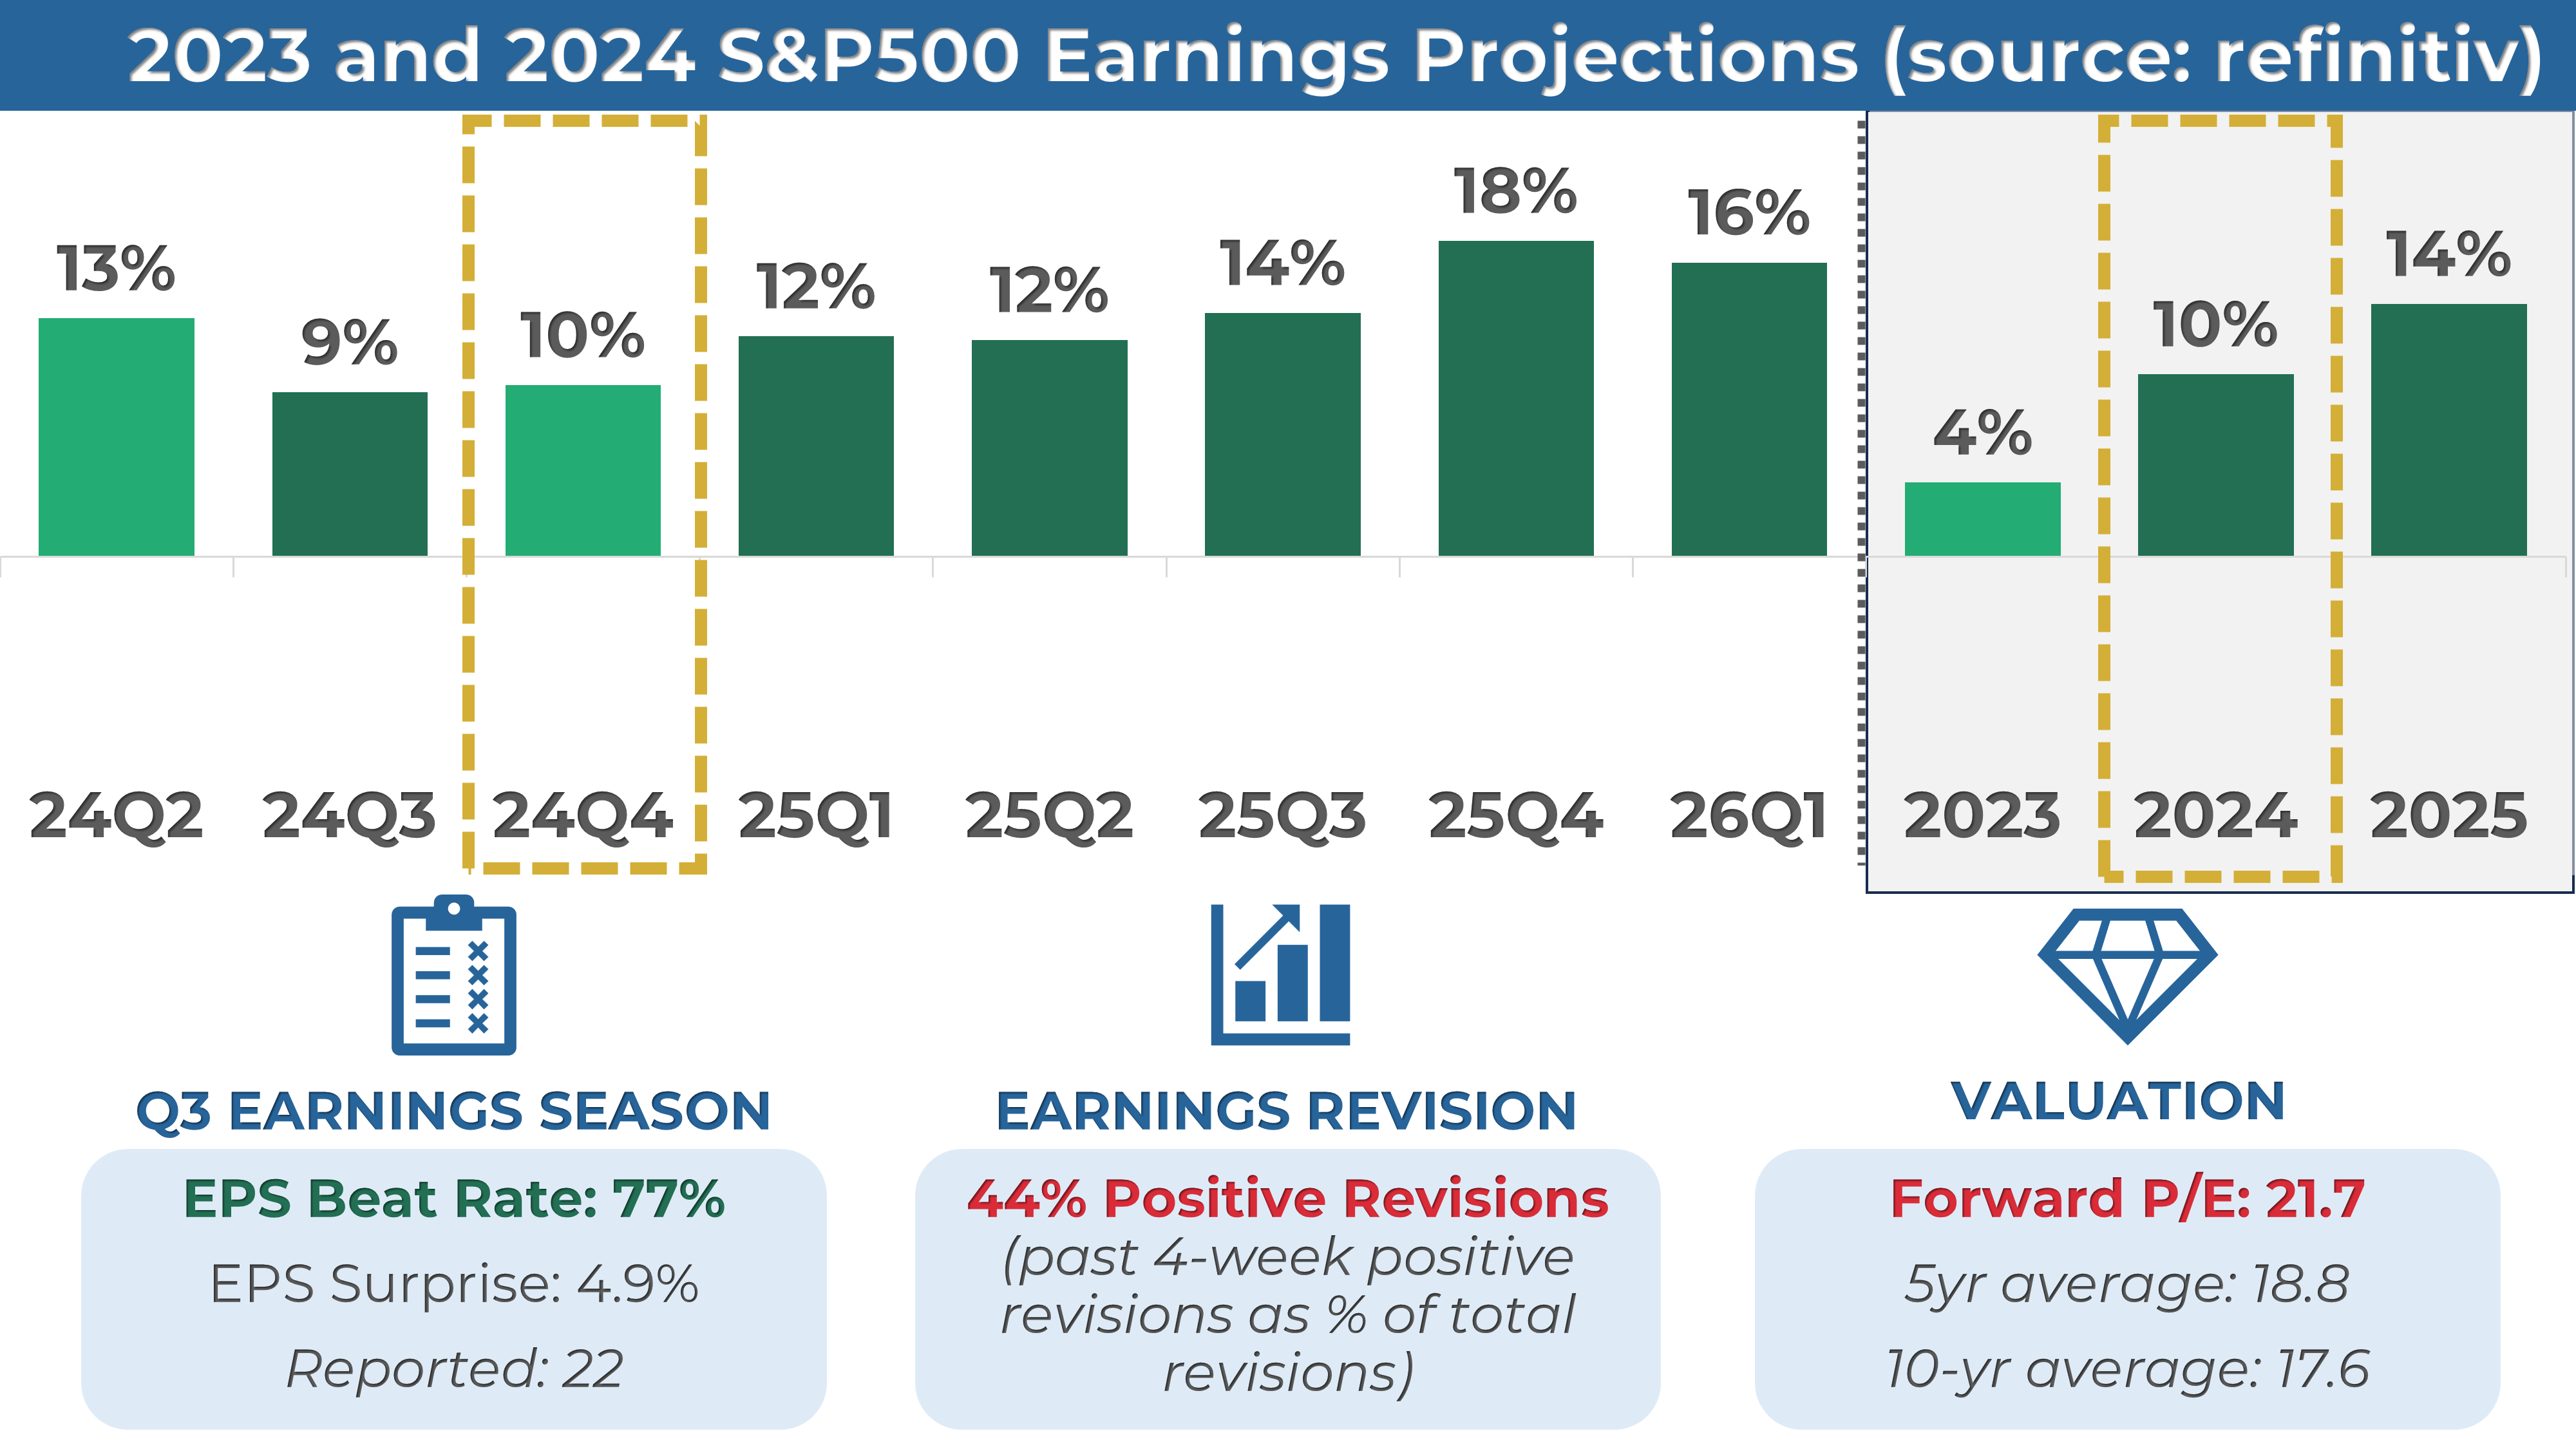
2. Earnings Season Recap
Out of 22 S&P 500 companies that have reported fourth-quarter earnings, 77% exceeded EPS expectations. It is slightly below the four-quarter average of 78% but well above the historical average of 67%.
Below are some notable companies that reported earnings last week. I’ve highlighted their EPS and revenue performance vs estimate, as well as their stock return this week.
Notably, Delta Airlines ($DAL) was a standout performer with a double EPS and Revenue beat and a 13% return last week.

3. Economic Reports
It was a data-heavy week for the markets. Here are the key highlights:
ISM Non-Manufacturing PMI (December): The index rose to 54.1, exceeding expectations of 53.5 and improving from 52.1, indicating stronger service sector growth.
FOMC Meeting Minutes (December): The Federal Reserve’s minutes highlighted discussions on inflation concerns and potential future rate hikes, maintaining a cautious tone for monetary policy.
Nonfarm Payrolls (December): Job growth surprised to the upside at 256K, significantly above the forecast of 164K and the previous month’s 212K, signaling robust labor market strength.
Unemployment Rate (December): Fell to 4.1%, slightly below the forecast and prior reading of 4.2%, underscoring a still-tight labor market.

MARKET SENTIMENT
Measures of investor sentiment can be helpful as they provide insight into the views and opinions of professional or individual investors. While not definitive predictors of market direction, these measures can serve as a valuable complement to other indicators and analysis tools, helping to paint a more comprehensive picture of the market's current state.
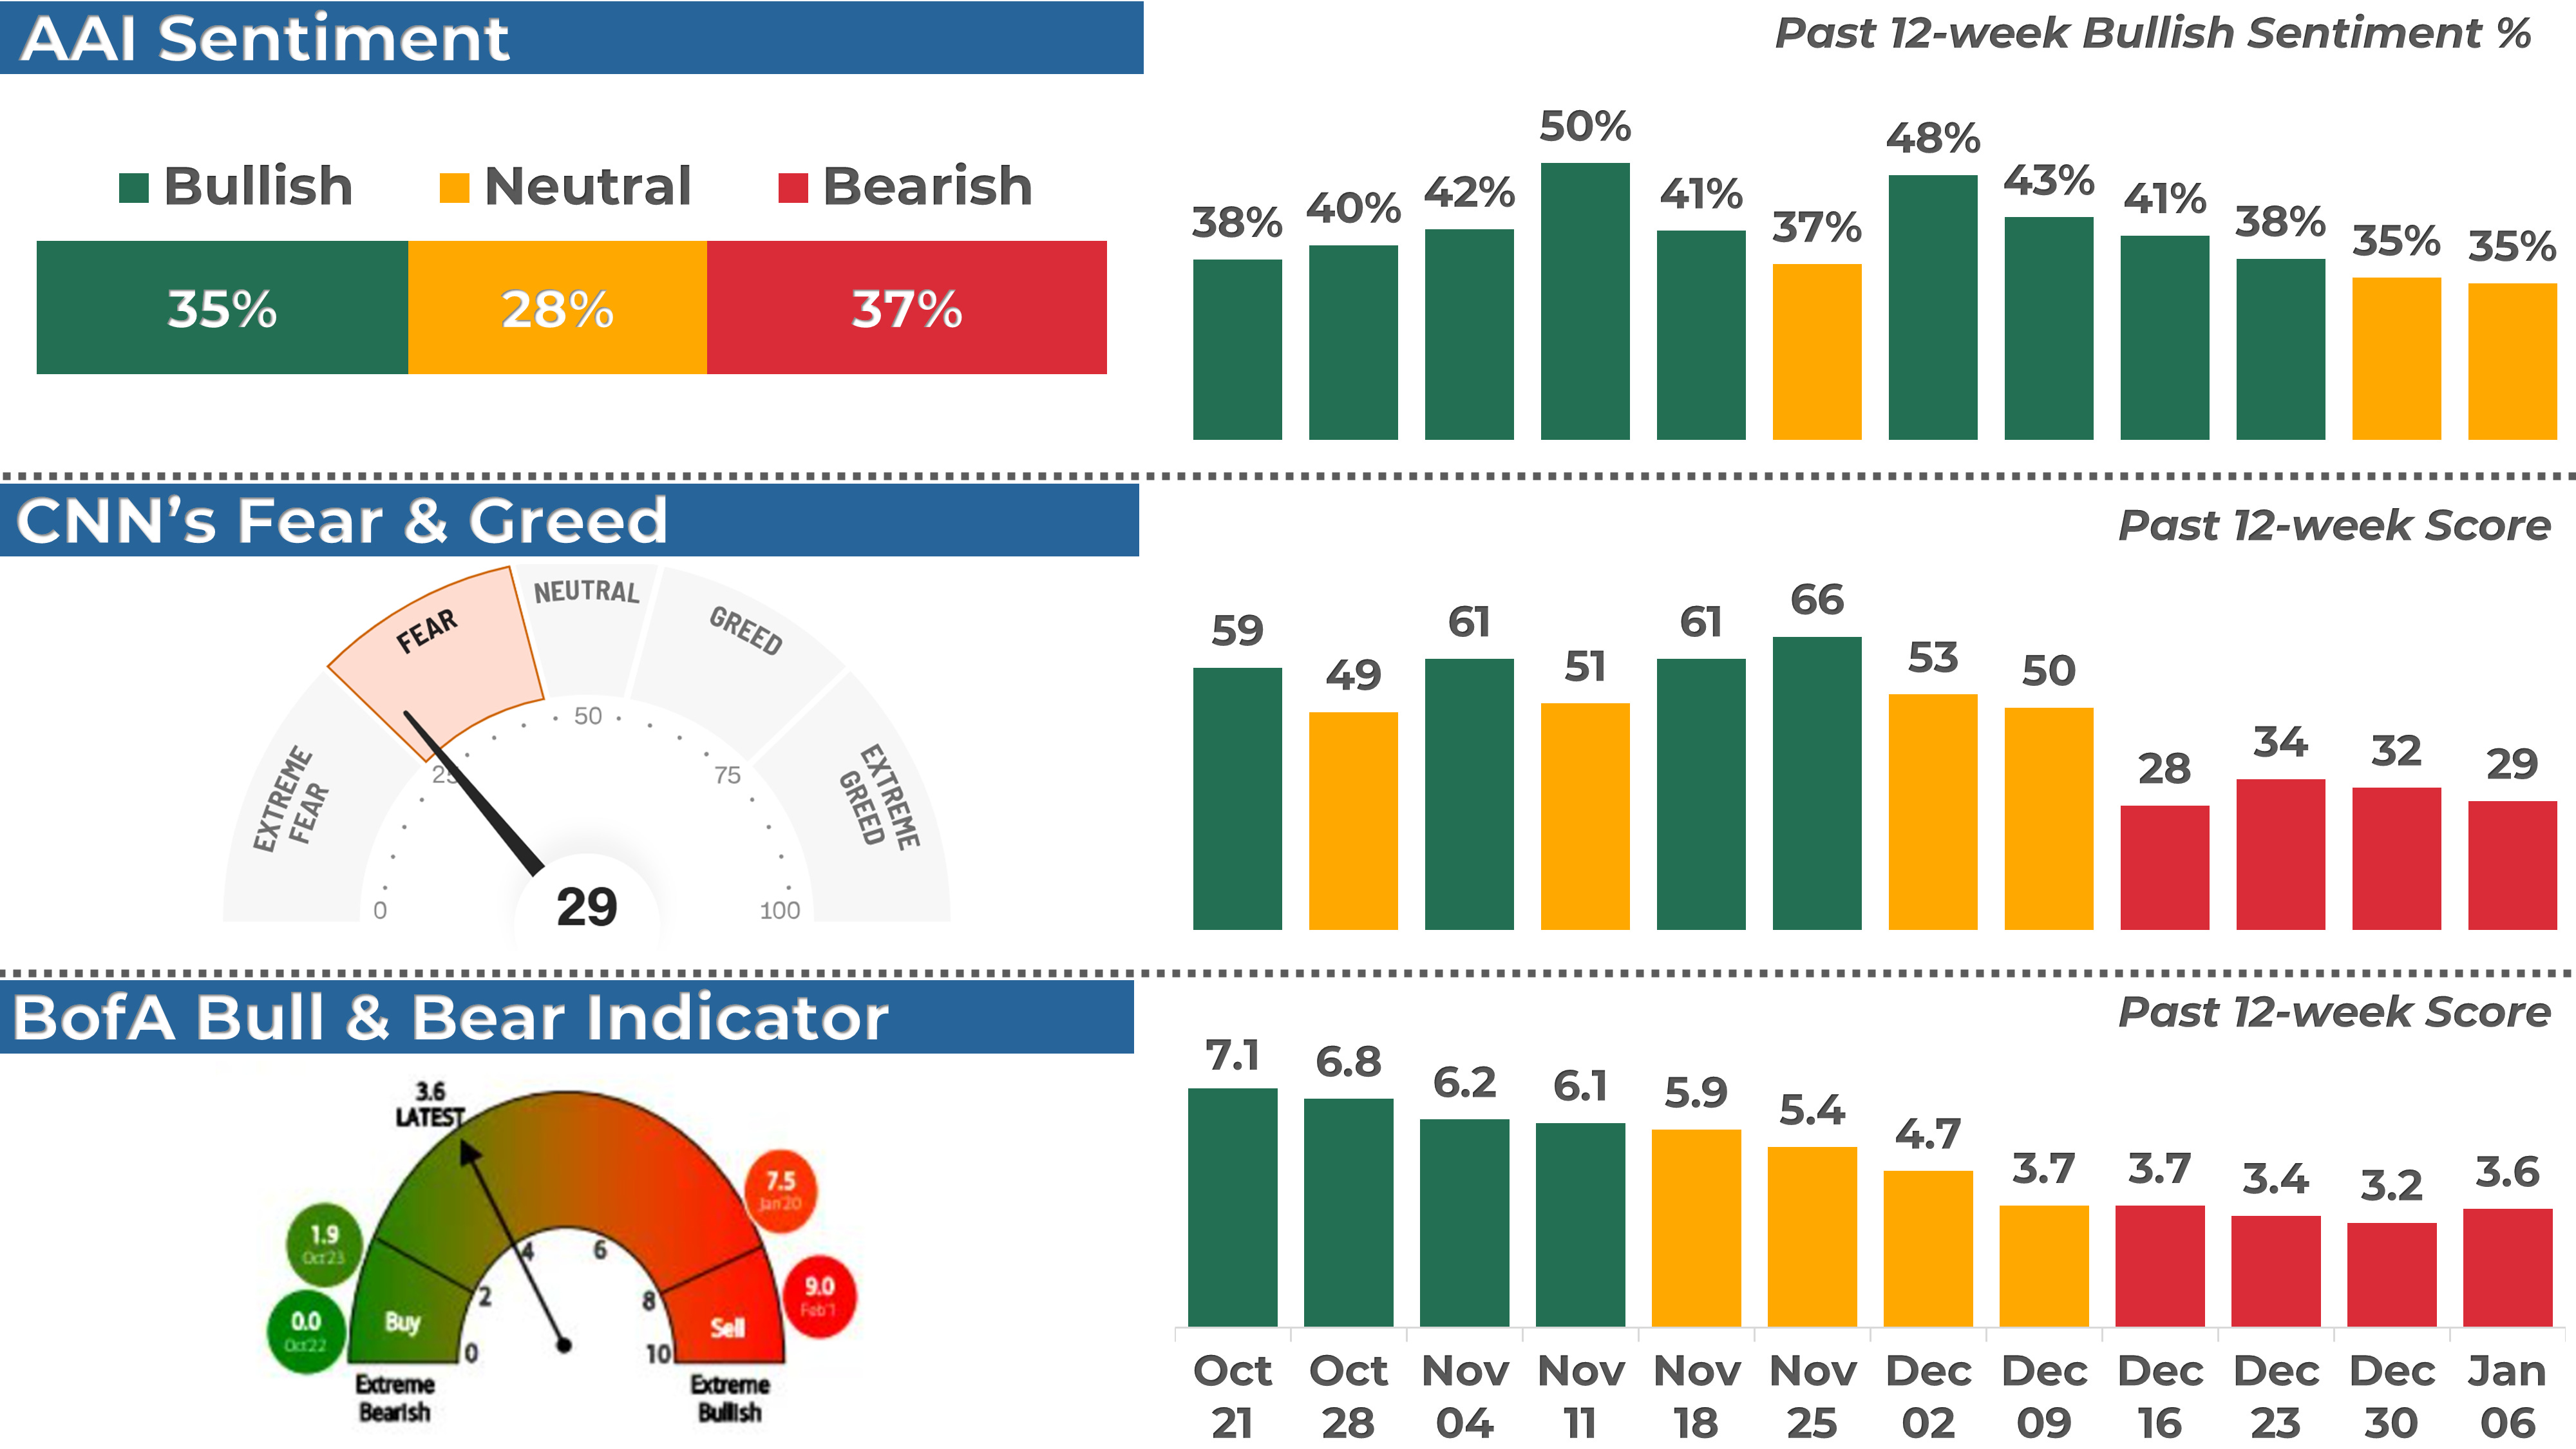
1. AAII Sentiment Survey (Individual Investors)
The American Association of Individual Investors (AAII) conducts a weekly survey to gauge members' expectations for the stock market over the next six months. Results are published every Wednesday.
In the latest survey, 35% of respondents had a bullish outlook, flat from the previous week.
2. BofA Bull & Bear Indicator (Institutional Investors)
The Bank of America Bull-Bear Indicator measures investor sentiment based on fund managers' and institutional investors' views. Scores range from 0 (extremely bearish) to 10 (extremely bullish).
The most recent reading was 3.6, a slightly bearish sentiment.
3. CNN Fear & Greed Index (Technical)
This daily measure analyzes seven indicators to assess how emotions drive market decisions. Scores range from Extreme Fear to Extreme Greed.
The index closed at 29 (Fear), down from 32 last Friday.
THE WEEK AHEAD
1. Economic Calendar
Key economic reports next week include the Consumer Price Index (CPI) and Producer Price Index (PPI), both set to provide critical insights into inflation trends. CPI, scheduled for Wednesday, will be closely watched, with expectations for a 0.3% month-over-month increase. On Thursday, Retail Sales data for December will shed light on consumer spending during the crucial holiday season, with forecasts pointing to a 0.5% m-o-m growth in core sales.

2. Earnings Calendar
Earnings season starts next week, and 20 companies from the S&P 500, including JPMorgan and UnitedHealth, are expected to release their quarterly results.
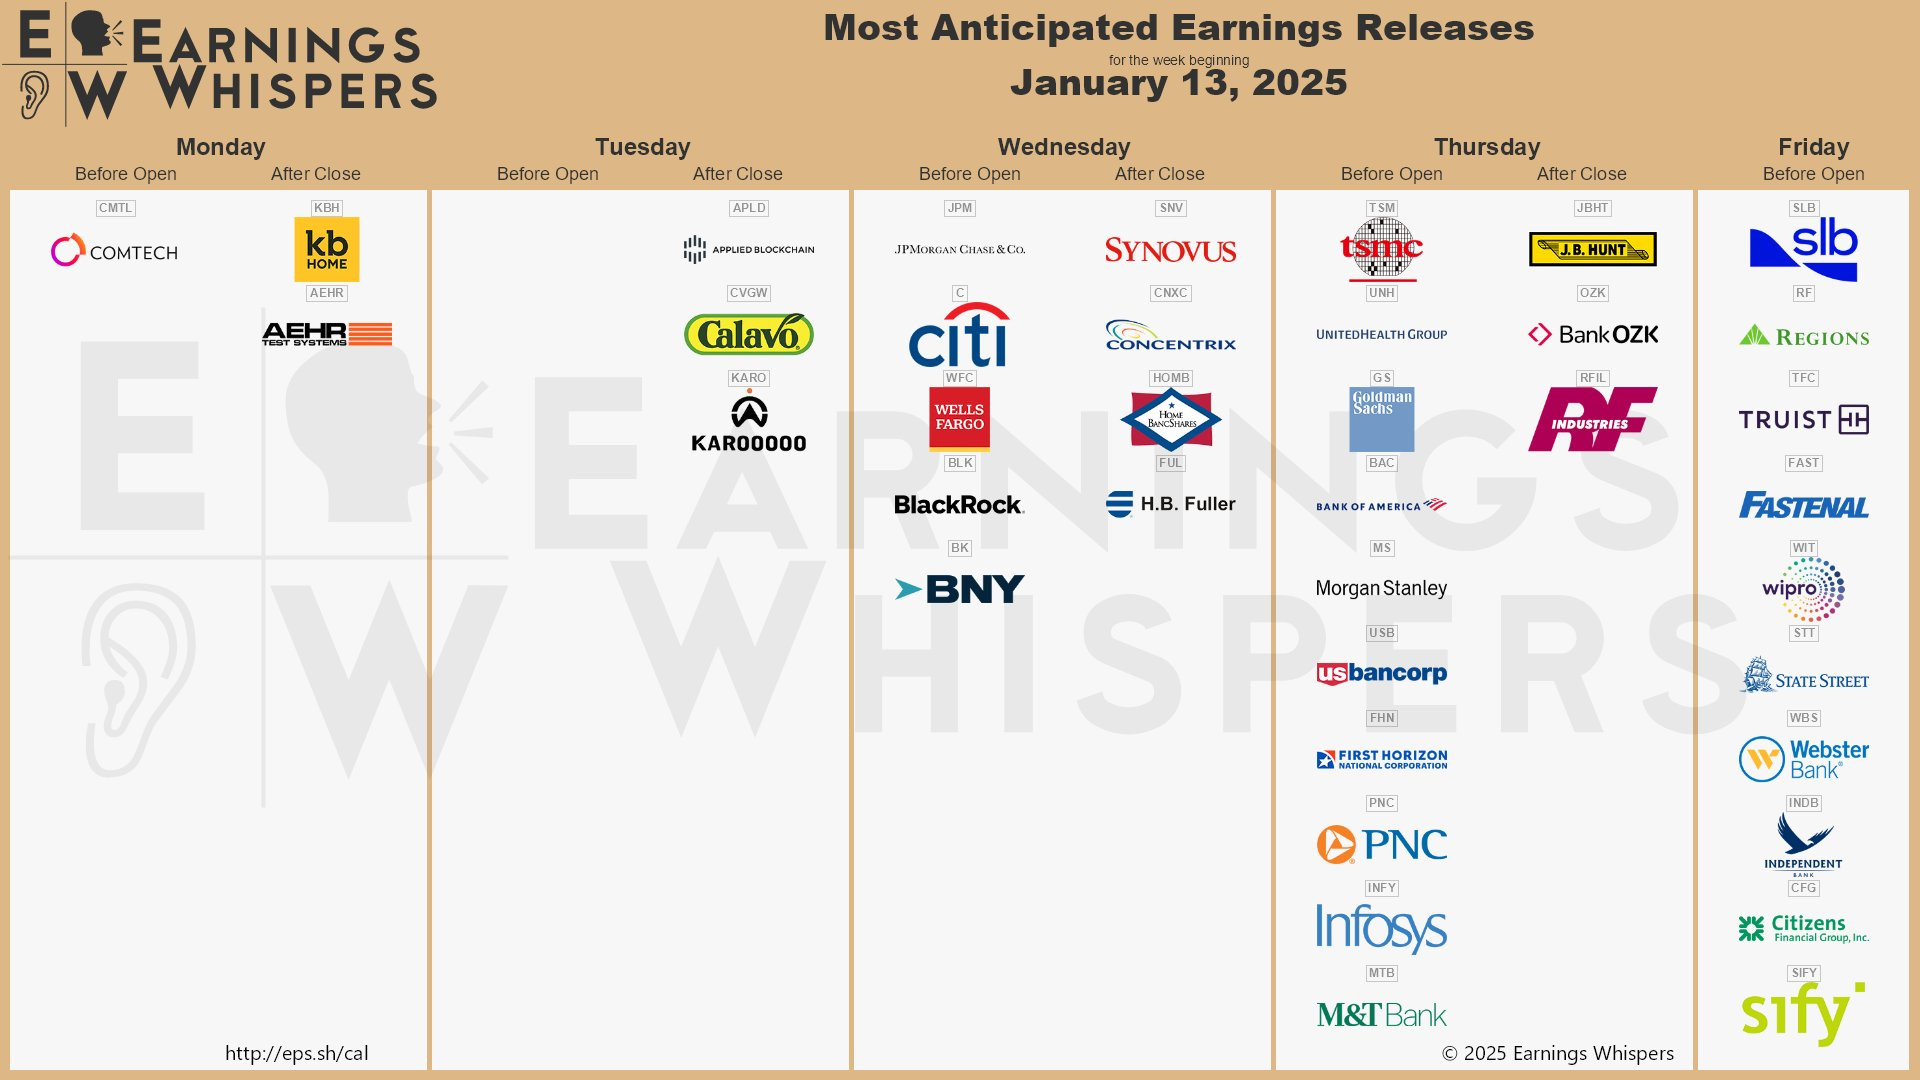
Below are notable stocks reporting earnings next week, along with several key indicators I like to monitor:
Stock Indicators:
3-Month Performance: Assessing recent stock trends.
RSI (Relative Strength Index): A reading above 70 suggests overbought conditions, while below 30 indicates oversold.
P/E Ratio: A value below 25 often points to a "cheap" valuation or low growth expectations.
Stock Price Reactions to Earnings:
1-Day Stock Return on Earnings: How the stock performs on its earnings release day.
Implied Volatility: The options market's forecast for the expected 1-day stock move after earnings.

3. Stock Analysis of the Week
Every week, I share my analysis of 1 stock reporting earnings in the coming days, focusing on implications for long-term investors. This week, I prepared an analysis of UnitedHealth ($UNH).
👨💻 My View: WATCH
UnitedHealth experienced a sharp sell-off in December following the tragic news of the CEO's murder. However, the stock seems to have found its footing around the $475-500 support zone.
The recovery could continue as long as the price stays above this key support. That said, I am watching next for a move above $550, a multi-year key level and coincides with the 30-week EMA, my favorite long-term trendline. Clearing this level would signal the start of a new bullish cycle.
Check out the post for more details about $UNH performance, trend and key levels.
4. Subscribers Poll: Your Outlook
CONCLUSION
Thank you for reading my Weekly Market Recap, which, I hope, got you ready for the week ahead.
If you want to take your investing journey to the next level, consider upgrading to a paid subscription. Subscribe now and learn more about my holistic, end-to-end momentum approach to investing.
Your first month is free, so this is the perfect opportunity to explore the full value of My Weekly Stock at no risk!
Thanks again, and I look forward to sharing my market recap with you next week.
Happy investing!
My Weekly Stock
DISCLAIMER
The information provided in this newsletter is for informational purposes only and should not be taken as financial advice. Any investments or decisions made based on the information provided in this newsletter are the reader's sole responsibility. We recommend that readers conduct their own research and consult a qualified financial professional before making investment decisions. The author does not assume any responsibility for any losses or damages arising from using the information provided in this newsletter.
Thanks for the weekly recap. Best and worst performers, and companies that hit highs and lows. Interesting to see.